The differences in microstructural organization of human posterior sclera are quantified as a function of age and race.
Abstract
Purpose.
The purpose of this study was to quantify the age and race-related differences in the microstructural organization of the human posterior sclera. Such differences may contribute to the predisposition of primary open-angle glaucoma in various high-risk populations.
Methods.
Posterior–temporal scleras from 75 right eyes were procured at an average distance of 3.5 mm from the center of the optic nerve head (ONH). A light-scattering device was used to investigate the matrix organization of posterior scleral fibers around the ONH. In addition to the degree of alignment (via eccentricity), the percentage occurrence of fiber angles within equatorial and meridionally aligned bins was quantified as a function of depth, sex, age, and race. There were 20 African Americans, 55 Caucasians, 49 males, 26 females, in this study, all falling within three age groups (<30, n = 8; 30–60, n = 33; and >60 years, n = 34). Three scleral layers, normalized for depth, were examined.
Results.
For all ages and both races, fibers were preferentially oriented equatorially at all layers (P < 0.001). The African Americans had a significantly higher percentage of occurrence of meridional fibers than did the Caucasians (P < 0.001). The percentage occurrence of meridional fibers decreased significantly from the inner to the outer layers of the posterior sclera (P < 0.001).
Conclusions.
Statistically significant microstructural differences were found in the posterior sclera between African American and Caucasian donors. Ongoing work is focused on identifying whether such microstructural differences play a role in the higher prevalence of glaucoma in African American populations.
As the second leading cause of blindness worldwide, glaucoma will affect an estimated 60 million people in 2010 and 80 million by 2020.1 Population-based studies of various racial and ethnic groups including African Americans, Caucasians, Hispanic Americans, Indians, and Chinese present different probabilities of glaucoma development between racial groups, with African Americans showing higher rates of open-angle glaucoma than any other race.2–10 In those studies, when one race was considered, the prevalence increased significantly with increasing age. Based on these findings, researchers have pointed out that age and race are two important risk factors that influence both the incidence and prevalence of the disease.11
The mechanical theory of glaucoma rests on the assumption that mechanical deformation due to locally acting forces at the lamina cribrosa may cause damage to and a loss of retinal ganglion cell (RGC) function, which is important in the vision loss associated with glaucoma.12–16 Recent research has suggested that the posterior sclera plays an essential role in the development of normotensive glaucoma, since relatively low IOP can itself lead to increased posterior deformation in the presence of altered scleral mechanical properties.16–20 It is also plausible that variability in the microstructure of the posterior sclera is responsible for the large variability in mechanical properties reported for this tissue in the literature.21–23
We hypothesized that microstructural changes in posterior sclera contribute to the predisposition to primary open-angle glaucoma found with advanced age and racial background. Although there is evidence that both the lamina cribrosa and the peripapillary matrix remodel in the presence of glaucoma,24 how the structural changes of lamina cribrosa and peripapillary matrix influence the biomechanical environment of the ONH has yet to be fully elucidated. The purpose of this study was to investigate whether differences in the extracellular microstructure of the human sclera occur as a function of age and race.
Methods
Summary of Donor Demographics
Seventy-five pairs of human scleral poles were acquired from 55 Caucasian and 20 African American donors. The samples came either from the laboratory of Daniel Stamer, PhD, at the University of Arizona (n = 14) or from the Cleveland Eye Bank (CEB) (n = 61). If available, the donors' information and ocular medical history were collected and recorded (n = 4). None of the donors whose information was available were identified as diabetic. Among the donors whose ocular medical history was available, no one was positive for glaucoma as indicated by their primary optometrist or ophthalmologist. No other diseases were identified for the 75 donors.
The donors' age ranged from 15 to 99, with 49 males and 26 females. The donors were divided into three age groups: younger than 30 years (8 donors, ages 15–28), between 30 and 60 years (33 donors, ages 32–59), and older than 60 years (34 donors, ages 60–99).
Sample Preparation
Eyes shipped from the CEB were stored in Hanks' balanced salt solution (HBSS). The mean ± SD of time between death and arrival at the Soft Tissue Biomechanics Laboratory (STBL) for all samples was 3.49 ± 1.64 days (range, 1–8 days). On arrival, the posterior poles were kept in phosphate-buffered saline (PBS) at 4°C and were dissected and snap frozen immediately.
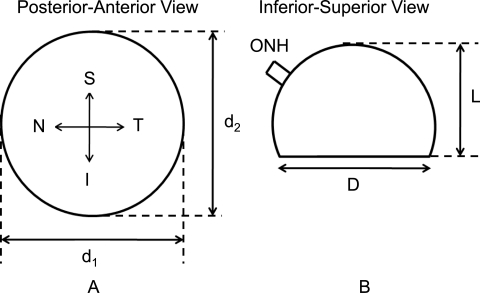
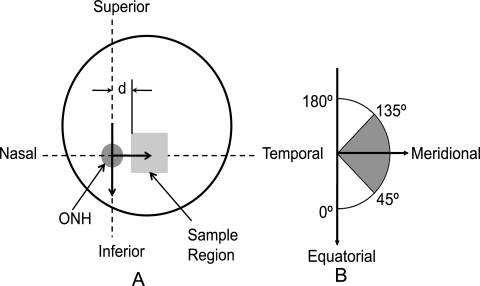
Before dissection, loose connective and fatty tissues were removed from the eyes, and measurements of globe diameter (D) and axial length (L) were taken (Fig. 1). Note that scleral globes were provided to the STBL in the shape shown in Figure 1, which is why true measures of globe diameter and axial length were unavailable. Specimens from the temporal side of the right posterior poles were cut, and subsequently, the minimum distance from the ONH center to the sample was recorded (Fig. 2A). From each sample, a region approximately 1.0 cm2 was isolated, placed in tissue-freezing medium (Triangle Biomedical Sciences, Durham, NC), and snap frozen in liquid nitrogen. Samples were flattened before snap freezing. All specimens were kept in a −150°C freezer until sectioning. The mean distance from the samples' nearest edge to the center of the ONH (d shown in Fig. 2A) was 3.5 mm, with an SD of 1.6 mm. Samples from the left posterior poles (and other quadrants in both eyes) were also harvested and stored in the cryostat for later processing.
Figure 1.
Geometric measurements of the posterior sclera taken before dissection. D is the mean globe diameter (D = (d1 + d2)/2). L is the axial length in posterior–anterior direction. Note that D and L do not necessarily correspond to accurate measures of globe diameter and specific axial length, since the posterior poles were cut at the eye bank and not in our laboratory. S, superior; I, inferior; N, nasal; T, temporal.
Figure 2.
(A) Sample harvest location from the right posterior sclera. d, minimum distance from the sample's edge to the ONH center. (B) Coordinate system used in analysis and values of ψ corresponding to anatomic directions. Note that the two arrows in (B) are identical with the two perpendicular to each other in (A). The polar coordinate system's origin is located at the ONH center as shown in (A). The shaded angle range in (B) corresponds to the meridional orientation.
Each posterior temporal square scleral block of the right eye was cryosectioned at 70-μm intervals through the depth and placed on microscope slides. Each section was then dehydrated in graded glycerol/water solutions (50%, 75%, and 87.5%), each for a half hour, and left in 100% glycerol overnight. The glycerol was then removed with a 100% alcohol solution. Tissue-mounting medium (Richard-Allan Scientific, Kalamazoo, MI) and a coverslip were then placed over the sample. Given a slice thickness of 70 μm, a 1-mm-thick sample would result in approximately 14 slices. The actual depth of each slice was normalized based on the entire thickness. Slices with normalized depths in the range of 0 to 0.33, 0.33 to 0.66, and 0.66 to 1 mm were grouped as outer, middle, and inner layers, respectively, with the inner layer corresponding to the choroidal surface. Therefore, each layer contained four to five slices. To identify possible differences in structural anisotropy through the depth of the sclera, we combined the data from all slices into one of three layers and compared across layers.
Small-Angle Light Scattering (SALS)
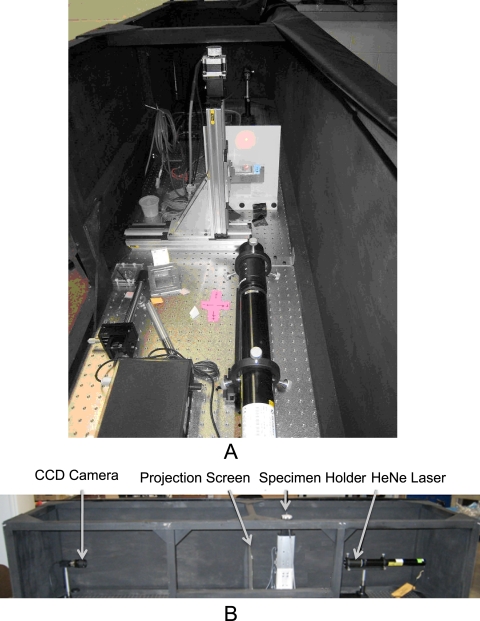
SALS is a well-developed technology that has been applied to studies of aortic valves,25 cornea,26,27 and cranial dura mater,28 among other tissues. Construction of the SALS device within the STBL (Fig. 3A) closely followed that previously developed and described by Sacks et al.29 This technique relies on the preferential scattering of HeNe light through thin soft tissues. The device assembly consists of an unpolarized 5-mW HeNe laser (λ = 632.8 nm; JDS Uniphase, Milpitas, CA), 2-D motion-controlled automated specimen holder, projection screen, and CCD camera (model XCD-V50; Sony, Tokyo, Japan), all mounted on a rigid optical platform (Fig. 3B). The pixel resolution of the CCD camera is 7.4 μm2. The specimen holder consists of two linear screw-driven tables (404XR series; Parker Hannifin, Cleveland, OH) with two stepper motors (IH23008; MCG, Inc., Eden Prairie, MN) set in plane, perpendicular to the laser and connected to a two-axis motor drive (MID-7602; National Instruments, Austin TX). For our SALS setup, the distance between the CCD and screen was 914 mm (for all tests), whereas the distance between the screen and specimen holder was 165 mm (for all tests). The interested reader can find further details regarding the SALS technique in another publication.29
Figure 3.
(A) SALS device within the STBL. (B) The arrangement of all components on the optical platform.
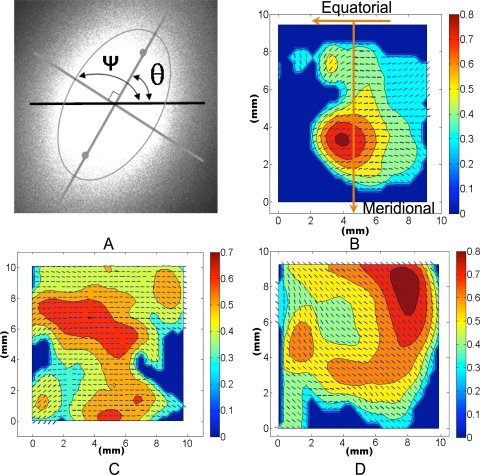
The laser light is transmitted through the tissue sample, and the beam is preferentially splayed 90° to the internal planar fiber microstructure. From the centroid of the splayed image, the major axis has an angle, θ, from the horizontal equator. The resulting angle plus 90° is the local fiber angle, ψ = θ + 90°, which is an estimate of the preferred direction of the local extracellular matrix, (e.g., collagen and elastin29 Fig. 4A).
Figure 4.
Typical SALS image at one location within the tissue and resulting contour–vector plot. (A) Typical SALS light splay image at one location within the tissue. Ψ, the fiber angle, and θ, the angle of the major axis of the ellipse from the horizontal axis. There is a 90° offset between these two angles. (B–D) Typical fiber angles (small vectors) and eccentricities (contour values) across slides from Caucasian, inner layer (B); Caucasian, middle layer (C); and African American, middle layer (D) samples. Note that each angle and eccentricity in (B–D) was derived from images similar to that in (A). For a typical 10-mm2 section, there would be a ∼29 × 29 grid in the contour–vector plot. The orientation of the contour–vector plots is labeled in (B).
The degree of fiber alignment used in this study was determined based on the eccentricity, E (0, 1), of the resulting ellipse which has the same normalized second moment as the splayed image (Fig. 4A). The normalized second moments of each image of splayed light were calculated directly from a built-in function (Regionprops; MatLab; The MathWorks, Natick, MA). The major and minor axes of an ellipse with the normalized second moments μyy, μxy, and μxx are given by30
 |
and
 |
Eccentricity is then the ratio of the distance between the foci of the ellipse and its major axis length, where 0 corresponds to a perfect circle and 1 corresponds to a line:
 |
It should be noted that the eccentricity, E, increases with increasing degree of fiber alignment. For a complete description of the entire process of generating the ellipse and calculating normalized second moments and major/minor axis lengths, the reader is referred to Haralick and Shapiro (pp 656–657).30 Images such as Figure 4A were generated at each location over the entire planar dehydrated sample in a 350 μm2-spaced grid as the specimen slide was translated with a custom-written, software-driven, motion-control system (LabView; National Instruments). Therefore, for a typical scleral block of 10 mm2 regions, there would be ∼29 × 29 locations. Image analysis was performed with a software program specifically designed for this purpose (Matlab; The MathWorks). Preliminary SALS scans on sclera showed that regions within a given slide that did not have tissue present resulted in eccentricities less than or equal to 0.3. For this reason, all measurements that had an eccentricity less than 0.3 were excluded from statistical analysis. The result was a vector–contour plot of local fiber directions and eccentricities for each slide, similar to those shown in Figures 4B–D.
In the analysis, the local fiber direction was transformed by using a polar coordinate system whose origin is the ONH and whose local radial direction is pointed away from the ONH. Therefore, a local fiber direction of 0° and 180° corresponds to equatorial alignment, whereas a value of 90° indicates fibers aligned meridionally (Fig. 2B). To generate a single metric of fiber direction over each entire sample for the comparisons between ages, races, and sexes, we quantified the percentage occurrence of fiber angles existing in bins between 0° and 45° and 135° and 180° (equatorial) and 45° and 135° (meridional) by the percentage of fibers in the above bins over the entire sample (over all locations within a slice and for all slices). Similarly, a representative value of eccentricity was taken as the average of all values over an entire sample. The percentage occurrences of fibers within the 45° and 135° angle range and the mean eccentricity were used for statistical comparisons. The distribution of percentage occurrence of meridional fibers and eccentricity as a function of the radial coordinate of the polar coordinate system (along the temporal meridian) was also investigated.
Statistical Analysis
Statistical analyses between layer, age, and racial groups were performed with commercial software (SigmaStat software version 3.1.1; Systat, Software, Inc., Chicago, IL). Kolmogorov-Smirnov tests were used to determine the normality of the data.
Differences in Percent Occurrence
The percentage occurrence values were transformed by using an arc sine transformation for age and racial groups to correct for non-normality. The arc sine transformation is useful for proportions that range from 0 to 1.31 A one-way analysis of variance (ANOVA) was then performed for the transformed data of the three age groups and for the three depth layers on the original data. Student's t-tests were performed to compare between the two racial groups on the transformed data. For the two sex groups, the data were not normal, even when transformed; therefore a Mann-Whitney rank sum test was applied to the original data.
Differences in Eccentricity
A Kruskal-Wallis one-way ANOVA on ranks was used to determine whether there were significant differences in the eccentricity as a function of depth. The same test was used to investigate differences within age groups. A Tukey test was then chosen as a multiple-comparison procedure to identify which treatment groups were significantly different. Mann-Whitney rank sum tests were selected to analyze the difference in the median eccentricity values between the African American and Caucasian groups and between the males and females.
Repeatability and Validation of SALS
The repeatability of the SALS technique was determined by SALS testing of a series of slides of the same scleral sample in two sequential sessions. The percentage of fibers with angles in the same range (60–120°) had an average relative difference of 6.33%, with an SD of 1.46% between the two runs. The eccentricities had a mean relative difference of 0.31%, with an SD of 0.16%.
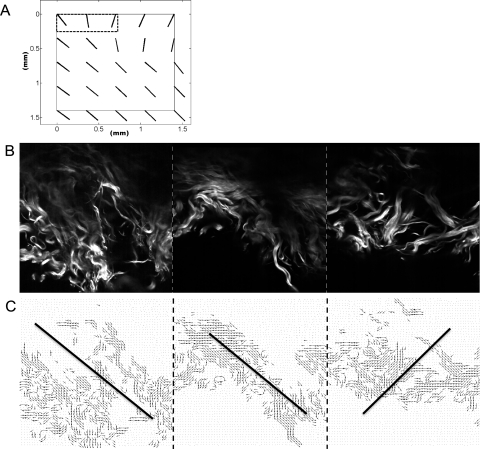
To validate the application of SALS technique on scleral tissue, we used multiphoton microscopy to observe the actual fiber architecture in a porcine sclera sample (∼1.5 mm2) at depths from 0 to 100 μm. Details for the methods used in the multiphoton microscopy are given in a study by Kirkpatrick et al.32 Briefly, the sample was imaged with a 150-fs pulsed titanium-sapphire laser (Chameleon Ultra 2; Coherent, Santa Clara, CA) coupled to a laser scanning microscope (TriMScope; Lavision Biotec, Bielefeld, Germany). Incident light is focused, and emitted signals are collected in nondescanning fashion with a 20 × 0.9 NA water-immersion objective lens (Olympus, Lake Success, NY). The laser is centered at 780 nm, and the second harmonic signal is collected onto a second nondescan PMT (photomultiplier tube) detector through a custom filter (380–400 nm; Chroma, Bellows Falls, VT). The field of view in the microscope we used is 350 μm2, which equals the spatial resolution we used in SALS. Therefore, one multiphoton image would correspond to one light-splay image (Figs. 5A, 5B). The three images have been pieced together in Figures 5B and 5C, to show the whole fiber structure. After multiphoton imaging, the specimen was subsequently taken through the SALS process. The angles were averaged throughout the same depths that were SALS tested. The percentage difference between the mean angle from the microscopy images and that from SALS was then quantified. Values of eccentricity for the multiphoton images were also collected and compared against the corresponding SALS results.
Figure 5.
Comparison between SALS and multiphoton microscopy results of a sample of porcine sclera. (A) The SALS plot of the porcine scleral slice which encompasses a depth between 0 and 70 μm. The black-dashed box at the top left corner indicates the three locations (the three small vectors) imaged with the multiphoton microscope. (B) A set of three adjacent multiphoton images (SHG) at 50-μm depth. Images were taken at 5-μm intervals (from 0 to 70 μm). (C) A quiver plot generated based on the microscopic images in (B). Small vectors indicate the fiber directions at each pixel. Solid lines: the mean orientations in each image. Note that the three microscope images, with a 350-μm2 field of view for each, were pieced together in (B) and (C) to show the whole fiber structure. (B, C, dash lines) The separation of each adjacent image. For validation, the vectors shown in (C) were averaged across all depths from 0 to 70 μm (C, solid lines) and compared to the vector value as reported from SALS.
For the validation study, the images obtained from both SALS test and multiphoton microscopy were compared. Every local fiber direction in the multiphoton microscopy data were plotted as a small vector in a quiver plot shown in Figure 5C. The solid line in each image is the mean direction. The three vectors within the dashed box in Figure 5A are the local fiber directions calculated based on the scattering patterns at the same locations corresponding to those shown in Figure 5B. The fiber directions obtained from both methods have a mean relative difference of 9.64%. The eccentricities for the SALS images corresponding to the highlighted region in Figure 5A were 0.63, 0.43, and 0.65 (left to right), whereas eccentricities for the corresponding multiphoton images in Figure 5B were 0.67, 0.49, and 0.68.
The effect of the storage time was also analyzed. The linear regression of mean eccentricity data as a function of storage time has an R2 value of 0.0025, whereas the R2 value of the linear regression of the mean percentage of occurrences of meridional fibers as a function of storage time was 0.0657. These indicate that there is no relationship between our quantified endpoints and the time of tissue storage.
We confirm that our research adhered to the tenets of the Declaration of Helsinki and that all subjects consented to donate tissue for research purposes. We complied with the ARVO Statement for the Use of Animals in Ophthalmic and Vision Research when using experimental animals.
Results
Radial Distance-Dependent Variations
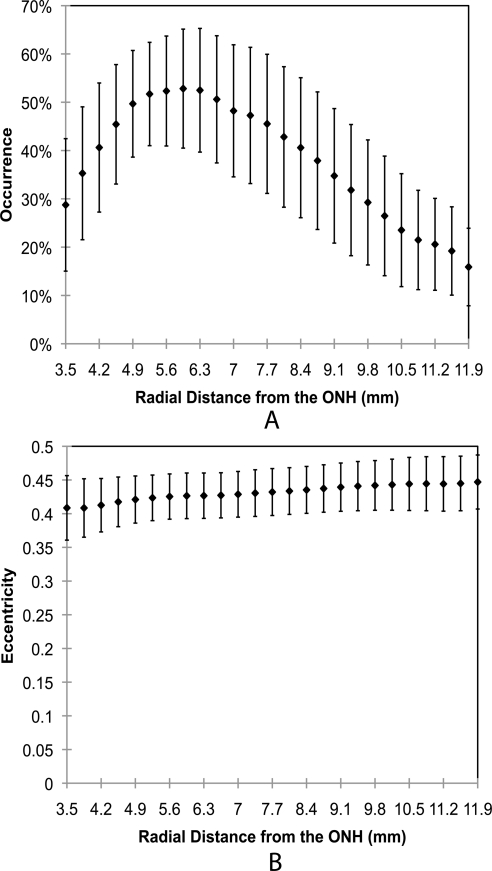
The mean globe diameter of the posterior sclera shells (D in Fig. 1) was 23.96 ± 0.89 mm, and the mean axial length in the posterior–anterior direction (L in Fig. 1) was 18.89 ± 1.03 mm. The mean percentage occurrence of fibers oriented meridionally in all samples is plotted as a function of radius (in the polar coordinate system) in Figure 6A. The percentage occurrence had a peak at a radius of ∼6 mm and decreased continually at both higher and lower radii. The relationship between the eccentricity and radius is shown in Figure 6B. The eccentricity was generally constant along the radius.
Figure 6.
Percentage occurrence of meridional fibers (A) and eccentricity (B) as a function of radial distance from the ONH for all samples. Error bars, standard deviations. For each sample, data were collected and averaged along the temporal meridian from the nearest to farthest edge, at 0.35-mm intervals. Data at similar radii were averaged through the depth over all the samples. Since samples had different widths (along the temporal meridian), the averaged data along the meridian starting at d = 3.5 mm up to d = 11.9 mm is displayed. Values from samples longer than 11.9 mm were not included.
Depth-Dependent Variations
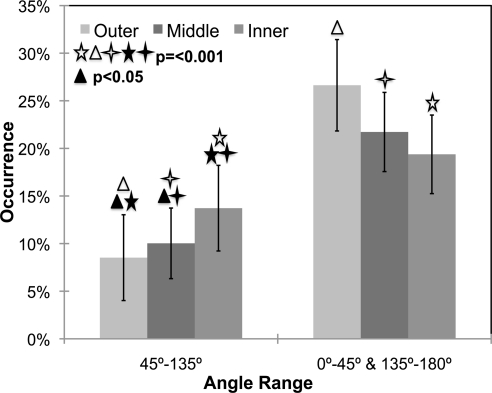
The percentage occurrence of fibers is plotted as a function of tissue depth in Figure 7. This figure demonstrates that the percentage of fibers located between 45°and 135° increased from the outer layer toward the inner layer. The data also suggest that the fibers in human sclera are predominantly aligned equatorially, regardless of depth location. The mean percentages of occurrence of meridionally aligned fibers were 8.68% ± 4.5%, 10.06% ± 3.7%, and 13.72% ± 4.5% for the outer, middle, and inner layers, respectively. There was a significant difference between the percentage of meridional fibers in the inner, middle, and outer scleral layers (P < 0.001 between the inner and outer, and between the middle and outer layers; P < 0.05 between the inner and middle layers).
Figure 7.
Percentage occurrence as a function of depth. Significant differences were found among varied layers (P < 0.001 between the inner and outer, and between the middle and outer layers; P < 0.05 between the inner and middle layers). Error bars, SD. All data in this plot are averaged over all radial locations at each depth. Note that all bar graph values add up to 100%, because for each sample six occurrence measures were taken (two angle bins for each of three layers).
The mean eccentricities were 0.449 ± 0.045, 0.446 ± 0.034, and 0.429 ± 0.030 for the outer, middle, and inner layers, respectively. To provide a representative measure of the variability within a sample, we calculated the mean of all sample standard deviations across all donors to be 0.037 ± 0.013. While there was a significant difference in eccentricity through the depth (P < 0.05), we believe that the small magnitude of these differences may not be physiologically meaningful.
Age-Dependent Variations
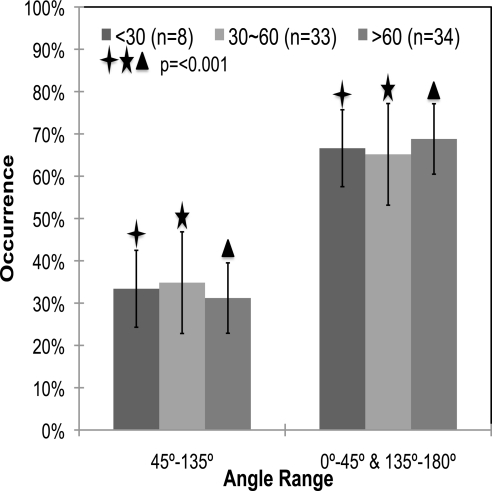
The mean percentages of occurrence of meridionally aligned fibers were 33.39% ± 9.1%, 34.83% ± 1.2%, and 31.20% ± 8.3% for the <30-, 30- to 60-, and >60-year age groups, respectively. For each age group, the average occurrence percentages and standard deviations versus the angle range are shown in Figure 8. There were no significant differences in percentage of fiber occurrence as a function of age (P = 0.348). There was, however, a significant preference of fibers aligned equatorially around the ONH at any age (P < 0.001). The mean eccentricities were 0.45 ± 0.006, 0.46 ± 0.006, and 0.44 ± 0.004 for the <30-, 30- to 60-, and >60-year age groups, respectively. There were no significant differences in eccentricity across age groups (P = 0.364).
Figure 8.
Preferential equatorial alignment of fibers in the posterior sclera of different ages. There were no significant differences within any angle range as a function of age. P < 0.001 between different angle ranges in each group. Error bars, standard deviations. The data for each age group add up to 100%, since each donor sample was put into its own age group.
Race-Dependent Variations
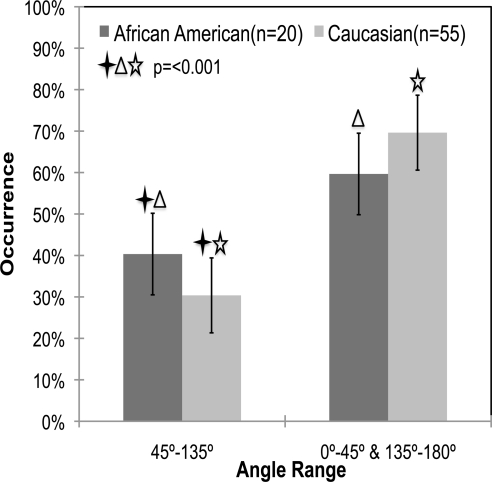
The mean percentage of occurrences of meridionally aligned fibers were 40.34% ± 9.8% and 30.37% ± 9.0% for the African American and Caucasian samples, respectively. Figure 9 shows the average occurrence percentages as a function of donor race. As can be seen in the figure, African Americans (n = 20) had a significantly higher percentage of occurrence of fibers aligned meridionally than did the Caucasians (P < 0.001). The mean eccentricities were 0.44 ± 0.007 and 0.44 ± 0.004 for the African American and Caucasian groups, respectively (P = 0.359). The difference between Caucasians and African Americans can be easily observed by comparing the representative SALS plots shown in Figures 4C and 4D, respectively.
Figure 9.
Mean percentage occurrence of fibers in African Americans (n = 20) versus Caucasians (n = 55) over the two angle ranges. There is a significant difference in the percentage occurrence of meridionally oriented fibers in African American versus Caucasian donors (P < 0.001). Error bars, standard deviation. The data for a racial group add up to 100%, since each donor sample was put into its own ethnicity group.
Sex-Dependent Variations
The average percentage occurrence of meridional fibers in the males was 33.5% ± 11.4%, and that in the females was 32.78% ± 9.6%. The eccentricity was 0.44 for both the males and females, and the standard deviations were 0.032 and 0.030, respectively. There were no statistically significant differences between the two groups in the percentage occurrences or eccentricity (P = 0.925 and 0.459, respectively).
Discussion
Our results indicate a preferential alignment of posterior fibers in the equatorial direction around the ONH. The racial difference in mean percentage of fibers between 45°, and 135° is statistically significant, indicating that African American have fewer fibers oriented in the equatorial direction around the ONH. A significant relationship of stronger equatorial alignment near the episcleral surface was also found; however, these small differences may not have physiological consequences.
Findings in recent studies have suggested that the three-dimensional anatomy of the eye, the scleral shell, and the mechanical properties of the posterior sclera determine the magnitude and distribution of IOP-induced deformations.16,19,20 The preferential alignment of fibers surrounding the ONH quantitatively found in this study corresponds to the circular pattern stated by Hogan et al.,33 who directly measured the collagen orientation in posterior sclera with light micrographs. Our results also correspond with those found indirectly by Girard et al.,34,35 who ascertained a similar preferential alignment using computational simulation. All these results are consistent with the study by Hernandez et al.,36 who also qualitatively described an equatorially preferred fiber alignment around the lamina cribrosa. While it is known that fibers straighten and elongate under a uniaxially applied load to resist deformation,37,38 the specific reason for equatorial matrix organization around the ONH is not fully understood. The authors believe this equatorial alignment of fibers around the ONH provides structural reinforcement to guard the delicate canal through which the optic nerve passes. Alterations in this alignment could then predispose posterior ocular tissues to a higher risk of mechanical damage.
The main purpose of this work was to identify whether differences in the matrix architecture of the posterior sclera occur as a function of age and race. Our research demonstrated a statistically significant decrease in the fraction of fibers oriented equatorially in African American donors compared with the Caucasians. Future work in our laboratory will focus on identifying whether such differences result in significant physiological alterations in the ONH biomechanical environment. Since previous studies have indicated a higher prevalence of primary open-angle glaucoma in the African American population,2–5 the decreased equatorial alignment in African American donors identified in our study may predispose these populations to a higher risk of optic nerve damage at normal levels of IOP.
A previous electron microscopy study of human sclera showed that collagen in the sclera is arranged in a more random pattern near the inner region and becomes more highly aligned and lamellar near the outer region.39 The trend through the scleral depth that we report herein agrees with these findings, in that we also found a higher tendency toward equatorial alignment on the episcleral surface. The functional reason for having a more randomly arranged pattern near the choroidal surface of the sclera is currently unknown. In addition, how and to what degree this arrangement contributes to the pathophysiological conditions associated with glaucoma has yet to be elucidated. Although not strong enough to be considered causative, it is possible that the scleral matrix alterations that we found participate in the development of primary open-angle glaucoma. Our research group is currently using the structural data obtained in this study for computational simulations (using microstructurally based constitutive models), to investigate how microstructural alterations of the posterior sclera affect ONH biomechanical environment.
One of the primary limitations of this study was that only the temporal region of the posterior sclera has been tested and analyzed. However, samples from nasal, inferior, and superior regions of the posterior sclera were also procured in our laboratory. The analysis of those samples is ongoing within our laboratory. It should also be noted that a large subset of the eyes tested in this study did not have ocular medical histories available. As such, these donors may have had unknown ocular diseases (e.g., glaucoma). Another unexpected limitation of this study was that our SALS system recorded non-0 eccentricities when the laser light was shown through regions of the slide without tissue. While advantageous, in that it provides a quantitative method of identifying tissue or nontissue regions on our slides, this problem may bring into question the quantitative measures of eccentricity reported in this study. In other words, it is possible that the eccentricities do not truly represent the precise degree of alignment in the scleral tissue. The reader should therefore use caution when interpreting the eccentricities reported in this work.
Another limitation of this study is that the tissues analyzed were days old. While we did not see any trends in our output variables as a function of time from death to snap freezing, our results should also be interpreted with this in mind.
Although the SALS technique is not novel, as far as we know, this study is the first application of SALS that focuses on the experimental measurement of fiber organization in human sclera. The results provide some evidence in support of the ongoing hypothesis that microstructural alterations in the human sclera contributes to the prevalence of glaucomatous damage at normal IOP. Further research is needed to more fully elucidate posterior scleral structural and mechanical alterations and how they might predispose high-risk races to glaucomatous damage at low IOPs.
Acknowledgments
The authors thank Daniel Stamer, PhD (College of Medicine, University of Arizona), for providing human ocular tissues to the STBL and Mark Borgstrom, PhD (Office of Student's Computing Resources, University of Arizona), for statistical support.
Footnotes
Supported by American Health Assistance Foundation National Glaucoma Research Grant AHAF G2009035 (JPVG) and partially by Science Foundation Arizona.
Disclosure: D. Yan, None; S. McPheeters, None; G. Johnson, None; U. Utzinger, None; J.P. Vande Geest, None
References
- 1. Quigley HA, Broman AT. The number of people with glaucoma worldwide in 2010 and 2020. Br J Ophthalmol. 2006;90:262–267 [DOI] [PMC free article] [PubMed] [Google Scholar]
- 2. Tielsch JM, Sommer A, Katz J, Royall RM, Quigley HA, Javitt J. Racial variations in the prevalence of primary open-angle glaucoma. The Baltimore Eye Survey. JAMA. 1991;266:369–374 [PubMed] [Google Scholar]
- 3. Girkin CA. Primary open-angle glaucoma in African Americans. Int Ophthalmol Clin. 2004;44:43–60 [DOI] [PubMed] [Google Scholar]
- 4. Leske MC, Connell AM, Schachat AP, Hyman L. The Barbados Eye Study. Prevalence of open angle glaucoma. Arch Ophthalmol. 1994;112:821–829 [DOI] [PubMed] [Google Scholar]
- 5. Racette L, Boden C, Kleinhandler SL, et al. Differences in visual function and optic nerve structure between healthy eyes of blacks and whites. Arch Ophthalmol. 2005;123:1547–1553 [DOI] [PubMed] [Google Scholar]
- 6. Quigley HA, West SK, Rodriguez J, Munoz B, Klein R, Snyder R. The prevalence of glaucoma in a population-based study of Hispanic subjects: Proyecto VER. Arch Ophthalmol. 2001;119:1819–1826 [DOI] [PubMed] [Google Scholar]
- 7. Varma R, Ying-Lai M, Francis BA, et al. Prevalence of open-angle glaucoma and ocular hypertension in Latinos: the Los Angeles Latino Eye Study. Ophthalmology. 2004;111:1439–1448 [DOI] [PubMed] [Google Scholar]
- 8. Dandona L, Dandona R, Srinivas M, et al. Open-angle glaucoma in an urban population in southern India: the Andhra Pradesh eye disease study. Ophthalmology. 2000;107:1702–1709 [DOI] [PubMed] [Google Scholar]
- 9. Ramakrishnan R, Nirmalan PK, Krishnadas R, et al. Glaucoma in a rural population of southern India: the Aravind comprehensive eye survey. Ophthalmology. 2003;110:1484–1490 [DOI] [PubMed] [Google Scholar]
- 10. Foster PJ, Johnson GJ. Glaucoma in China: how big is the problem? Br J Ophthalmol. 2001;85:1277–1282 [DOI] [PMC free article] [PubMed] [Google Scholar]
- 11. Boland MV, Quigley HA. Risk factors and open-angle glaucoma: classification and application. J Glaucoma. 2007;16:406–418 [DOI] [PubMed] [Google Scholar]
- 12. Sander EA, Downs JC, Hart RT, Burgoyne CF, Nauman EA. A cellular solid model of the lamina cribrosa: mechanical dependence on morphology. J Biomech Eng. 2006;128:879–889 [DOI] [PubMed] [Google Scholar]
- 13. Burgoyne CF, Morrison JC. The anatomy and pathophysiology of the optic nerve head in glaucoma. J Glaucoma. 2001;10:S16–S18 [DOI] [PubMed] [Google Scholar]
- 14. Sigal IA, Flanagan JG, Ethier CR. Factors influencing optic nerve head biomechanics. Invest Ophthalmol Vis Sci. 2005;46:4189–4199 [DOI] [PubMed] [Google Scholar]
- 15. Sigal IA, Flanagan JG, Tertinegg I, Ethier CR. Finite element modeling of optic nerve head biomechanics. Invest Ophthalmol Vis Sci. 2004;45:4378–4387 [DOI] [PubMed] [Google Scholar]
- 16. Burgoyne CF, Downs JC, Bellezza AJ, Suh JK, Hart RT. The optic nerve head as a biomechanical structure: a new paradigm for understanding the role of IOP-related stress and strain in the pathophysiology of glaucomatous optic nerve head damage. Prog Retin Eye Res. 2005;24:39–73 [DOI] [PubMed] [Google Scholar]
- 17. Bellezza AJ, Hart RT, Burgoyne CF. The optic nerve head as a biomechanical structure: initial finite element modeling. Invest Ophthalmol Vis Sci. 2000;41:2991–3000 [PubMed] [Google Scholar]
- 18. Downs JC, Roberts MD, Burgoyne CF. Mechanical environment of the optic nerve head in glaucoma. Optom Vis Sci. 2008;85:425–435 [DOI] [PMC free article] [PubMed] [Google Scholar]
- 19. Sigal IA, Flanagan JG, Tertinegg I, Ethier CR. Modeling individual-specific human optic nerve head biomechanics, I: IOP-induced deformations and influence of geometry. Biomech Model Mechanobiol. 2009;8:85–98 [DOI] [PubMed] [Google Scholar]
- 20. Sigal IA, Flanagan JG, Tertinegg I, Ethier CR. Modeling individual-specific human optic nerve head biomechanics, II: influence of material properties. Biomech Model Mechanobiol. 2009;8:99–109 [DOI] [PubMed] [Google Scholar]
- 21. Battaglioli JL, Kamm RD. Measurements of the compressive properties of scleral tissue. Invest Ophthalmol Vis Sci. 1984;25:59–65 [PubMed] [Google Scholar]
- 22. Mortazavi AM, Simon BR, Stamer WD, Vande Geest JP. Drained secant modulus for human and porcine peripapillary sclera using unconfined compression testing. Exp Eye Res. 2009;89:892–897 [DOI] [PubMed] [Google Scholar]
- 23. Girard M, Suh JK, Hart RT, Burgoyne CF, Downs JC. Effects of storage time on the mechanical properties of rabbit peripapillary sclera after enucleation. Curr Eye Res. 2007;32:465–470 [DOI] [PubMed] [Google Scholar]
- 24. Quigley HA, Dorman-Pease ME, Brown AE. Quantitative study of collagen and elastin of the optic nerve head and sclera in human and experimental monkey glaucoma. Curr Eye Res. 1991;10:877–888 [DOI] [PubMed] [Google Scholar]
- 25. Sacks MS, Smith DB, Hiester ED. The aortic valve microstructure: effects of transvalvular pressure. J Biomed Mater Res. 1998;41:131–141 [DOI] [PubMed] [Google Scholar]
- 26. Bettelheim FA, Kumbar M. An interpretation of small-angle light-scattering patterns of human cornea. Invest Ophthalmol Vis Sci. 1977;16:233–236 [PubMed] [Google Scholar]
- 27. Bettelheim FA, Magrill R. Small-angle light-scattering patterns of corneas of different species. Invest Ophthalmol Vis Sci. 1977;16:236–240 [PubMed] [Google Scholar]
- 28. Hamann MC, Sacks MS, Malinin TI. Quantification of the collagen fibre architecture of human cranial dura mater. J Anat. 1998;192(Pt 1):99–106 [DOI] [PMC free article] [PubMed] [Google Scholar]
- 29. Sacks MS, Smith DB, Hiester ED. A small angle light scattering device for planar connective tissue microstructural analysis. Ann Biomed Eng. 1997;25:678–689 [DOI] [PubMed] [Google Scholar]
- 30. Haralick RM, Shapiro LG. Computer and Robot Vision. Reading, MA: Addison-Wesley; 1992 [Google Scholar]
- 31. Myers JL. Fundamentals of Experimental Design. 2 ed Boston: Allyn and Bacon, Inc.; 1972:77 [Google Scholar]
- 32. Kirkpatrick ND, Andreou S, Hoying JB, Utzinger U. Live imaging of collagen remodeling during angiogenesis. Am J Physiol Heart Circ Physiol. 2007;292:H3198–H3206 [DOI] [PubMed] [Google Scholar]
- 33. Hogan MJ, Alvarado JA, Weddell JE. Histology of the Human Eye. Philadelphia: W. B. Saunders Co.; 1971:193–200 [Google Scholar]
- 34. Girard MJ, Downs JC, Bottlang M, Burgoyne CF, Suh JK. Peripapillary and posterior scleral mechanics, II: experimental and inverse finite element characterization. J Biomech Eng. 2009;131:051012 [DOI] [PMC free article] [PubMed] [Google Scholar]
- 35. Girard MJ, Downs JC, Burgoyne CF, Suh JK. Peripapillary and posterior scleral mechanics–part I: development of an anisotropic hyperelastic constitutive model. J Biomech Eng. 2009;131:051011 [DOI] [PMC free article] [PubMed] [Google Scholar]
- 36. Hernandez MR, Luo XX, Igoe F, Neufeld AH. Extracellular matrix of the human lamina cribrosa. Am J Ophthalmol. 1987;104:567–576 [DOI] [PubMed] [Google Scholar]
- 37. Kenedi KR, Gibson T, Daly CH. Bioengineering studies of the human skin: the effect of unidirectional tension. In: Jackson SF, Harkness RD, Partridge SM, Tristram GR. eds. Structure and Function of Connective and Skeletal Tissue. London: Butterworths; 1965:388–395 [Google Scholar]
- 38. Broom ND. Simultaneous morphological and stress-strain studies of the fibrous components in wet heart valve leaflet tissue. Connect Tissue Res. 1978;6:37–50 [DOI] [PubMed] [Google Scholar]
- 39. Komai Y, Ushiki T. The three-dimensional organization of collagen fibrils in the human cornea and sclera. Invest Ophthalmol Vis Sci. 1991;32:2244–2258 [PubMed] [Google Scholar]


