

Abstract
Mathematical model-based statistical inference applied to within-host dynamics of infectious diseases can help dissect complex interactions between hosts and microbes. This work has applied advances in model-based inference to understand colonization of cattle by enterohaemorrhagic Escherichia coli O157 : H7 at the terminal rectum. A mathematical model was developed based on niche replication and transition rates at this site. A nested-model comparison, applied to excretion curves from 25 calves, was used to reduce complexity while maintaining integrity. We conclude that, 5–9 days post inoculation, the innate immune response negates bacterial replication on the epithelium and either reduces attachment to or increases detachment from the epithelium of the terminal rectum. Thus, we provide a broadly applicable model that gives novel insights into bacterial replication rates in vivo and the timing and impact of host responses.
Keywords: Escherichia coli O157, modelling, cattle, innate immunity
1. Introduction
Enterohaemorrhagic Escherichia coli (EHEC) O157 has emerged as an important zoonosis over the last three decades. While an increasing number of infections occur indirectly from the environment rather than ingestion of contaminated meat, the majority of human infections originate from ruminants, in particular cattle. Cattle are colonized by EHEC O157 predominately at the terminal rectum [1] and the bacterial factors required for colonization and persistence have been the subject of extensive research [2–8]. These include a type III secretion system that injects a cocktail of up to 40 different effector proteins into the host cell, driving intimate attachment and manipulating innate responses to promote the persistence of the organism in the animal's gastrointestinal tract [9–13]. A number of approaches to limit shedding of the organism from cattle have been tested, including vaccines that aim to generate responses against these colonization factors [14–18]. Cattle colonized at the terminal rectum can shed up to 107 EHEC O157 per gram of faeces, leading to the term ‘supershedders’ [18]. Modelling studies have indicated that if interventions can reduce this high-level shedding to below 104 bacteria per gram of faeces, then this should restrict animal-to-animal transmission rates to an unsustainable level in the herd [19]. Research has demonstrated that prior colonization of animals by EHEC O157 can be partially protective against homologous strain challenge [20], but protection does not appear to correlate with antibody titres generated [20,21]. Therefore, despite our knowledge of the molecular mechanisms underlying adherence and immune modulation, we still have a relatively poor understanding of the host protective mechanisms that block colonization or limit bacterial shedding from cattle.
To provide further insight into the timing and nature of immune responses that restrict EHEC O157 colonization of cattle, we have developed a mathematical model that describes the attachment, detachment and growth of E. coli O157 : H7 at the terminal rectum of cattle. The model was fitted to individual animal's shedding curves and statistical analyses were used to assess the level of model complexity required to accurately represent the observed shedding patterns in the faeces of groups of cattle orally challenged with EHEC O157. In support of this approach, previous research has demonstrated that the shedding curves of animals colonized by rectal application of the bacteria are virtually indistinguishable from those of orally colonized animals [22], indicating that modelling the variables at this restricted site can accurately represent the colonization process in the whole animal. The model has highlighted a second shedding peak ascribed to the impact of the immune response and indicates that the main protective mechanism is restriction of bacterial replication rates, first on the epithelial cells and then in the mucous layer. This novel approach has generated a set of minimal but accurate colonization models that have provided new insights into the timing and impact of host responses that can now be tested experimentally. Future work aims to build this individual animal model into population-based models to allow scientists to predict the impact of alterations in cellular interactions through to the herd level.
2. Material and methods
Previously published [14,23] data from 25 orally challenged animals were used. None of the animals had received a vaccine, i.e. all were from control cohorts from previous trials and were challenged as described in McNeilly et al. [14,23]. In summary, all animals were determined to be free of EHEC O157 by immunomagnetic separation screening according to the manufacturer's instructions (Dynabeads anti-E. coli O157; Invitrogen). The average age of the calves at the time of bacterial challenge was 18 ± 5 weeks. The strain used was a nalidixic acid-resistant E. coli O157 : H7 strain ZAP198 [14], and faecal levels were determined daily for two weeks following oral inoculation by plating faecal dilutions onto sorbitol MacConkey agar plates containing 15 µg ml–1 nalidixic acid.
2.1. A mathematical model
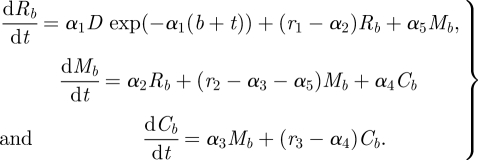
In order to capture the observed shedding dynamics, we derive a deterministic differential equation model that represents the flow, attachment, detachment and replication of bacteria within the terminal rectum. The model is summarized in figure 1. We assume there are three key compartments: the faeces in the terminal rectum, the layer of mucus excreted by cells in the epithelium at the terminal rectum and the epithelial cell surface. The time-dependent concentration of bacteria in these three compartments are Rb(t), Mb(t) and Cb(t), respectively, where t is the time in hours since the last bowel movement b. On day 0, cattle are orally challenged with a bolus dose of bacteria. We assume that the concentration of bacteria in faeces reaching the terminal rectum from the gut can be described by a decaying exponential function, i.e. D exp(−α1(b + t)), where α1 is the per capita decay rate and D a measure of the dose. Bacteria migrate between the faeces in the terminal rectum and the mucous layer at per capita rates α2 (faeces to mucus) and α5 (mucus to faeces). Bacteria in the mucous layer attach to epithelial cells at the per capita rate α3, and detach into the mucous layer at the per capita rate α4. In the rectal faeces, the mucous layer and cell surface, replication of the bacteria occurs at per capita rates r1, r2 and r3, respectively. Between each bowel movement, the bacterial concentrations in each compartment are therefore given by the following system of differential equations:
 |
2.1 |
Figure 1.

Model representing the flow and replication rates of bacteria within the terminal rectum of cattle hosts.
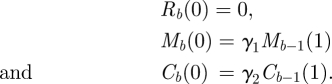
We assume that bowel movements occur every hour, that is when t = 1. A bowel movement evacuates the faeces from the terminal rectum. In addition, we assume that a proportion γ1 of the mucous layer is sheared off with the faeces, and a proportion γ2 of the epithelium is also sheared off. This means that the concentrations of bacteria in the faeces, the mucous layer and the cell wall just after the bth bowel movement are given by
 |
The system of equations (2.1) need only be solved at t = 1. This is achieved by diagonalizing the coefficient matrix to decouple the equations and using LAPACK routines to compute the eigenvalues, eigenvectors and inverse of the matrix [24].
Once challenged, cattle exhibit an immune response after a given time delay. For the purposes of this model, this captures both innate and adaptive responses. In our model, the effect of the immune response is represented by a modification in the flow and replication rates (α's and r's, respectively). It is postulated that the immune response may affect the replication rate of the bacteria, the attachment and detachment rates to and from the epithelial cells and the migration rates between the faeces and the mucous layer. We assume that the effect of the immune response on these rates begins at time T1 post challenge. For each rate p, the immune response is assumed to cause a linear change (decrease or increase) in its value between times T1 and T2p to a proportion cp of its initial value. After time T2p, rate p remains constant for the duration of the experiment. Although this is an over-simplistic representation of the multi-factorial effects of the immune response, there is insufficient data to justify a more complex representation.
2.2. Nested models
The aim of this work is to develop the simplest possible model to capture the observed shedding dynamics and to provide testable hypotheses that explain the effect of the immune response upon the bacteria in the terminal rectum of the host cattle. We therefore developed a set of nested models with a specific set of assumptions regarding the effect of the immune response upon the rates shown in figure 1. The full model M0 assumes that all replication rates and flow rates between the three compartments are affected by the immune response. However, it seems likely that the replication rate of bacteria in the faeces and the migration between the faeces and the mucous layer would not be affected by the immune response. This gives the simplified model M1, in which α2, α5 and r1 are not affected by the immune response while α3, α4, r2 and r3 are. Further simplifications to model M1 are considered by making each of the rates α3, α4, r2 and r3 unaffected by the immune response (models M2, M3, M4 and M5, respectively) and by making both α3 and α4 unaffected (model M6). The models are summarized in table 1.
Table 1.
Models tested and their adequacy to explain the data for all cattle. AIC, Akaike information criterion.
| model | parameters affected by immune response | adequate fit to data? | number of parameters, km |  |
AICm − AIC0 |
|---|---|---|---|---|---|
| M0 | α2, α3, α4, α5, r1, r2, r3 | yes | 26 | ||
| M1 | α3, α4, r2, r3 | yes | 20 | −8.99 | −281.99 |
| M2 | α4, r2, r3 | yes | 18 | −7.32 | −385.35 |
| M3 | α3, r2, r3 | yes | 18 | −18.91 | −362.19 |
| M4 | α3, α4, r3 | no | 18 | −243.35 | 86.71 |
| M5 | α3, α4, r2 | no | 18 | −148.16 | −103.68 |
| M6 | r2, r3 | no | 16 | −218.44 | −63.12 |
2.3. Derivation of the likelihood function
The shedding data (crosses in figure 2) are derived as follows. A faecal sample, taken from the surface of a faecal pat, was diluted at dilution d (typically 10−2, 10−3 and 10−4) and plated three times. Serial dilutions were taken if bacterial counts were greater than 800. An estimate of bacterial concentration in CFU per gram faeces is therefore
where S is the sum of the counts across all plates of a sample and D is the sum of the dilutions across all plates of a sample, i.e.  and
and 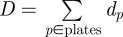 .
.
Figure 2.

Fits of the baseline model M0 to the observed shedding data (crosses) in all 25 cattle. The graphs show the log of the bacterial count on the surface of the faeces (in CFU g–1) against days post challenge. The solid lines give the best-fit solution, while the dark grey regions show the 50% posterior predictive intervals and the light grey regions show the 95% posterior predictive intervals of the model fit.
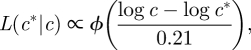
Owing to the large variability in the shedding curves, we fit our models to individual shedding curves rather than a curve averaged across animals. To do this requires an estimate of the error in the measured bacterial concentrations. In a separate experiment, five subsamples from the same faecal pat were diluted and plated three times at a dilution of 10−2 to give a total of 5 × 3 concentrations. We bootstrapped these data as follows. For each of the five subsamples, one of its three plate counts was sampled with replacement, and the standard deviation of the log-transformed concentration (equal to count/10−2) was calculated. This was done 1000 times and gave a mean standard deviation of 0.21 logs. We used this estimate for the magnitude of the measurement error in the main dataset.
We assume that log-transformed concentrations are independent and their errors are normally distributed with mean 0 and standard deviation 0.21. We use likelihood to give a measure of the distance between the data and the model solution. The likelihood of the concentration c* taken from the model solution given the observed concentration c is
 |
where ϕ is the standard normal distribution. If all plate counts of a particular faecal sample are above 800, then the likelihood of the concentration c* given an observed concentration above 800/D is
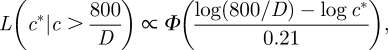 |
where Φ is the cumulative distribution function of the standard normal distribution. If all plate counts of a particular faecal sample are 0, then the likelihood of the concentration c* given an observed concentration below 1/D is
 |
The full likelihood is the product of the likelihoods over all observations from an animal.
We use an adaptive population-based Markov chain Monte Carlo (MCMC) method [25,26] to fit our models to the data. We use the Akaike information criterion or AIC [27] to compare models. We calculate the total AIC for model m across all animals as
where km is the number of parameters in model m and  is the maximum likelihood of animal a under model m. Models are ranked according to their AIC value, where the preferred model will have the lowest AIC.
3. Results
The fit of the full model M0 to the observed shedding data in all animals is shown in figure 2. The model gives an excellent fit to the data. We observe from figure 2 that the shedding curves of animals fall into one of two categories. For some animals, the shedding curves rise exponentially until the immune response takes effect, then decrease to zero. For the other animals, the immune response causes the shedding curve to firstly fall and then rise again before peaking for a second time and finally falling to zero.
For all animals, the simplified model M1 fits the data as well as the full model M0 ( ). The AIC value for model M1 is also lower than for model M0 (AIC1 − AIC0 = −281.99, table 1), suggesting that the extra parameters in model M0 are unnecessary to capture the data and the simpler model is preferred. When we simplify the model further, we find that models M2 and M3, in which α3 and α4, respectively, are fixed, provide good fits to the shedding data, with AIC values lower than the more complex model M1 (table 1). However, models M4 and M5, in which r2 and r3 are fixed, respectively, have AIC values higher than for model M1 and in particular are unable to capture the dynamics in animals with distinct secondary peaks in their shedding curves.
The maximum likelihood for the remaining model (M6), in which both α3 and α4 are fixed, is significantly higher than for M1 and gives a poor fit to the data. Models M4, M5 and M6 can, therefore, be discarded as viable models. We can thus conclude that, to explain the shedding data for the cattle with two peaks in their shedding curves, at least one of α3 and α4 and both r2 and r3 must be affected by the immune response. Therefore, we have two minimally adequate models (M2 and M3) that explain the shedding data. We consider each in turn.
The results for model M2 are summarized in figure 3. Before the immune system is activated, exponential growth in the mucous layer and on the epithelium replenishes the loss of bacteria from the mucous layer via bowel movements, and hence the shedding curve rises exponentially. The effect of the innate immune response upon the parameters is first apparent around 160 h post challenge. At this point, animals appear to fall into one of two categories. For those with only one peak in their shedding curves, the reproduction rates both in the mucous layer and on the epithelium are observed to rapidly fall to zero, while the detachment rate from the cells, α4, rises gradually (figure 3). This causes a decline in the shedding curve as the bacteria shed in the faeces cannot be replenished.
Figure 3.

Changes in (a) r3, (b) α4 and (c) r2 according to model M2 for all animals. Lines are best fits.
Different dynamics are observed for the remaining animals. For those with two peaks in their shedding curves, the replication rate on epithelial cells, r3, rapidly falls to zero (figure 3a). Growth in the mucous layer alone is not sufficient to replenish loss through shedding and so bacterial numbers rapidly fall in the mucous layer and hence the shedding curve falls. At the same time, the immune response causes an increase in the detachment rate from (or with) epithelial cells, α4, causing a second rise in the shedding curve (figure 3b). The replication rate in the mucous layer, r2, then falls gradually, and this leads to a reduction in shedding to undetectable levels (figure 3c).
The results for model M3 are summarized in figure 4, and explain the data in a slightly different way. For animals with one peak in their shedding curves, r2 and r3 rapidly fall to zero when the immune response takes effect, while the attachment rate to the cells decreases gradually. As bacteria are shed in the faeces, they cannot be replenished by reproduction and so the shedding curve falls to undetectable levels. However, in the remainder of the animals, the initial effect of the immune response is to cause the replication rate on epithelial cells, r3, to rapidly fall to zero (figure 4a). Growth in the mucous layer alone is not sufficient to replenish loss through shedding and so bacterial numbers rapidly fall in the mucous layer and hence the shedding curve falls. At the same time, the immune response causes the attachment rate to the epithelial cells, α3, to fall (figure 4b). So instead of bacteria attaching to the epithelial cells, they remain within the mucus. As for model M2, this is enough to slow down or reverse the decline in bacterial numbers in the mucous layer, and hence causes a slowdown in the decline or a rise, respectively, in the shedding curve. The replication rate in the mucous layer, r2, slowly falls, which ultimately means that growth cannot replenish loss through shedding, and hence the shedding curve ultimately falls (figure 4c). In both models, we observe that the replication rate of the bacteria on epithelial cells decreases to zero for all animals when the immune response is stimulated. However, the effect upon the replication rate in the mucous layer is less marked—owing to continual shedding of bacteria in the mucous layer when cattle defecate, a slight decrease in r2 appears sufficient to cause the shedding rates to fall to undetectable levels.
Figure 4.

Changes in (a) r3, (b) α3 and (c) r2 according to model M3 for non-vaccinated animals. Lines are best fits.
The mean and standard deviation of some of the estimated parameter values in models M2 and M3 are given in table 2. The mean parameter values are similar in both models. The replication rates on the epithelial cells are on average 1.2 h−1 according to model M2 and 1.1 h−1 according to model M3, which correspond to a doubling time of 42 and 58 min with standard deviations of 58 and 17 min for models M2 and M3, respectively. The replication rate is found to be higher in the mucous layer, at 2.7 h−1 for model M2 and 2.4 h−1 for model M3, corresponding to a doubling time of 23 and 21 min, with standard deviations of 21 and 12 min, respectively. These mean values are consistent with established replication rates for E. coli in nutrient-rich conditions [28]. Note that for both models M2 and M3, one animal was found to have very low values of r3 compared with the other animals (animal 15 for model M2 and animal 17 for model M3). In order to avoid biases, r3 for these animals were ignored when calculating mean doubling times.
Table 2.
Mean and standard deviations of estimated mean parameter values across all animals for models M2 and M3.
| parameter | units | mean value (s.d.), model M2 | mean value (s.d.), model M3 |
|---|---|---|---|
| α1 | h−1 | 0.099 (0.16) | 0.099 (0.16) |
| α2 | h−1 | 3.6 (1.6) | 3.0 (2.0) |
| α3 | h−1 | 6.4 (1.6) | 6.6 (1.8) |
| α4 | h−1 | 2.6 (2.0) | 3.4 (1.6) |
| α5 | h−1 | 5.4 (1.9) | 4.9 (2.3) |
| r1 | h−1 | 1.5 (0.8) | 1.6 (0.8) |
| r2 | h−1 | 2.7 (1.7) | 2.4 (0.9) |
| r3 | h−1 | 1.2 (0.6) | 1.1 (0.4) |
| γ1 | 0.75 (0.18) | 0.76 (0.15) | |
| γ2 | 0.23 (0.17) | 0.19 (0.12) | |
| D | CFU g−1 | 0.85 × 10⁴ (1.6 × 10⁴) | 1.0 × 10⁵ (1.5 × 10⁵) |
| T1 | h | 150 (54) | 160 (58) |
Research now needs to be carried out to determine rates of EHEC O157 : H7 replication in mucus and on cells. Bacteria attach (α3) about twice as fast to epithelial cells than they detach (α4). γ1 is predicted to be about three to four times higher than γ2, indicating that a much greater proportion of bacteria are removed from the mucous layer than from the epithelial cells when animals excrete. The mean time at which the immune response begins to affect the bacteria in the terminal rectum is predicted to be around 150–160 h (about 6.5 days) in both models.
Finally, we carried out an ANOVA to determine significant effects of parameter values on the observed shedding patterns in the animals. We test for effects on the number of peaks in the shedding curve, the height of the highest peak and the area under the shedding curve (an approximation for the total bacteria shed). When testing for models M2 and M3, no parameters are found to be significant in determining the height of the peak and the area under the shedding curve. However, significant effects are found with the number of peaks in the shedding curve. The p-values are summarized in table 3 for model M2 and table 4 for model M3. For both models, the detachment rate α4, the proportion of bacteria in the mucous layer removed upon excretion γ1, the size of the initial dose D and the time of onset of the immune response T1 are all found to correlate with the presence or absence of a second peak in the shedding curve. In model M2, α1 and α3 are also found to be significant, while α2 and γ2 are found to be significant in model M3. Double peaks are associated with lower dose D and lower α1, suggesting that they occur with a smaller more defined inoculum from the faeces into the rectal mucus. Double peaks are associated with higher attachment (α3) and lower detachment (α4) rates as well as earlier activation of the immune response (T1) and a higher proportion of bacteria being removed (γ1).
Table 3.
Significant p-values (at the 5% level) and F-statistic from ANOVAs of effects of parameters on the number of peaks in the shedding curve for model M2.
| parameter | p-value | F1,25 |
|---|---|---|
| α1 | 0.028 | 5.5 |
| α3 | 0.021 | 6.2 |
| α4 | <0.001 | 36.7 |
| Γ1 | 0.004 | 10.2 |
| D | 0.002 | 12.2 |
| T1 | 0.05 | 4.2 |
Table 4.
Significant p-values (at the 5% level) and F-statistic from ANOVAs of effects of parameters on the number of peaks in the shedding curve for model M3.
| parameter | p-value | F1,25 |
|---|---|---|
| α2 | 0.013 | 7.2 |
| α4 | 0.0046 | 9.8 |
| γ1 | <0.001 | 25.1 |
| γ2 | 0.017 | 6.6 |
| D | <0.001 | 47.2 |
| T1 | 0.036 | 5.0 |
In conclusion, we have developed two minimal models that provide adequate fits to individual animal's shedding data with two different biological interpretations for the effect of the immune response upon replication and flow of the bacteria in the terminal rectum. Unexpectedly, the modelling has drawn attention to a second peak in the shedding that occurs in the majority of animals. As discussed below, this has provided unique insights into the effect of innate responses and their timing that eventually limit the infection in the natural reservoir host. The work has allowed the development of testable hypotheses for future laboratory-based experiments, which are also discussed below.
4. Discussion
The application of mathematical modelling to the within-host dynamics of infectious diseases is becoming more widespread and more accepted as a means to understand the complex interactions between hosts and pathogens. Some diseases have received a lot of attention, in particular HIV [29] and malaria [26], while others have received very little. EHEC O157 : H7 can cause severe and fatal infections in humans that often originate from the main bovine reservoir host. It is therefore important to understand the excretion dynamics of this pathogen from its primary host and the factors that can limit excretion levels. The aim of this work was to apply advances in MCMC-based inference [26,27,30] to model a bacterial infection for the first time.
There are two critical issues that affect the fitting of nonlinear dynamical models to noisy data: the strong nonlinearity of the dynamical systems and the high-dimensional parameter space. These have several important consequences for nonlinear parameter estimation and biological inference: (i) analytical solutions rarely exist, thus requiring time-consuming numerical estimates of solutions, (ii) the objective function (e.g. likelihood) can be very complex (for example, multiple local minima or maxima, and ridges), and can easily trap search or sampling algorithms in suboptimal regions of parameter space, (iii) multiple solutions may exist, all of which need to be visited by the search or sampling algorithm, and (iv) searching or sampling parameter space is very slow for high-dimensional systems. If these issues are not adequately addressed, then a good characterization of the objective function is unlikely. The consequences are compromised model assessment, compromised model comparison and a lack of confidence in the validity of the biological inferences. These issues have meant that mathematical modellers and applied statisticians have neglected this area until recently. However, progress in the theory and application of MCMC-based inference overcomes all of these fundamental problems [26,27,30].
While there has been extensive research effort into understanding the microbial and host factors that contribute to infection, much of this has been developed through phenotypic and genetic analysis, with the aim of understanding specific virulence factors or host resistance traits. Mathematical modelling can provide important insights into biological mechanisms and is more routinely applied in epidemiology frameworks to understand pathogen flow through populations. In this study, we have applied a deterministic differential equation to model the excretion profile of EHEC O157 : H7 from its main reservoir host, cattle. An important approach to protect human health from EHEC infections is the development of vaccines that limit or prevent shedding from cattle. Despite the progress in this area, we have a limited understanding of the natural or vaccine-based protection that has been demonstrated in a number of studies [15,17,20,23,31]. EHEC O157 colonization of cattle has been modelled in one other paper [32] using a stochastic birth–death process of bacterial growth in different compartments of an animal's gut. However, the focus of that paper was on long-term shedding patterns in alternating infected and clean environments, whereas this work focuses on describing the acute phase-shedding curves and the underlying processes that govern them. Moreover, this current study applies information on the specific colonization site of EHEC O157 in the bovine host [1].
A critical facet of the colonization process in cattle is that it occurs primarily at the terminal rectum. This focus to a limited region of the gastrointestinal tract has implications for the colonization, host response and excretion dynamics. As the challenge strain is delivered as a single oral dose, the colonization and response kinetics can follow a fairly synchronous path, which is facilitated by the limited colonization area. The use of the same colonization protocol and strain for all the data analysed means that the variation probably reflects differences in the timing and impact of responses between animals. The model defined in figure 1 includes the multiplication, attachment and detachment rates in the main ‘micro-environments’ at the terminal rectum. Fixing of different parameters led to two reduced models that still provided a good fit encompassing variation in individual shedding curves. Although the two reduced models have slightly different biological implications, both indicate that effects on replication rate are critical on the epithelium and act between days 5 and 7 post oral inoculation to effectively negate bacterial replication on rectal epithelial cells. This is followed by similar effects on the replication rates of bacteria in the mucus.
The replication rates are composed of two variables, the doubling time of the bacteria and the rate at which bacteria are killed. Both these factors will be altered by the anticipated consequences of inducing an innate inflammatory response on the terminal rectal mucosa. In terms of restricting bacterial growth rate, stimulated epithelial cells release compounds such as lipocalin and lactoferrin to limit bacterial access to iron. Enteric bacteria attempt to overcome this by expression of multiple siderophores and siderophore receptors but the host response is likely to further repress the replication rate through this restriction [33]. One recently licensed approach to limit EHEC shedding from cattle is vaccination with EHEC ‘iron-regulated proteins’ that will include siderophore receptors [15]. Directly blocking their function with mucosal antibodies in addition to the possible restriction resulting from the host's response would be expected to have a marked impact on bacterial replication. In terms of bacterial killing, Paneth cells and potentially epithelial cells release cationic antimicrobial peptides, including defensins, that disrupt bacterial membrane integrity, leading to bacterial lysis [34]. The predicted fall in replication rates on epithelial cells is likely to be a consequence of both mechanisms. Future work will investigate the relative contributions of growth limitation and bacterial killing in the shedding dynamics. Based on the model, it is evident that this analysis, for example from rectal biopsies, should be carried out at the 5–7 day period following oral challenge to allow further insights into induced growth restriction and bactericidal responses.
Recent work on effector proteins secreted by EHEC has shown that many target different pathways leading to NF-κB signalling and inhibition of cell apoptosis, both functions aimed at improving the probability of EHEC persistence on the epithelium [10–12]. Our previous research has demonstrated an influx of neutrophils associated with an inflammatory response in the terminal rectal mucosa of cattle colonized by EHEC O157 : H7 at day 14 onwards following oral or rectal challenge [35]. As exemplified by the model, the earlier induction of the innate response is the key battleground affecting persistence and explains the selection of these effector proteins. It will also mean that even minor differences in this type of activity will be important in relation to total levels of bacteria excreted from an animal with important implications for human acquisition of the pathogen. For example, the EHEC O157 : H7 phage type most likely to be associated with human infections is also more commonly associated with higher shedding animals [24,36]. Future work will measure differences in innate responses between these strain types and predict, with the help of the model, shedding levels. These data can then be used to model transmission between animals in herds for which we have models that have been developed previously [19].
An intriguing observation that was only made as a consequence of this modelling research is the presence of a second shedding peak in the majority of the animals (figure 2). The second peak fits the two ‘reduced’ models and can therefore be potentially explained by different biological processes. Under both models M2 and M3, after immune activation, the replication rates fall in the mucous layer and the epithelium. For M2, the attachment rate to the epithelium from the mucus does not change but more bacteria become detached from the epithelium to enter the mucus. For M3, the detachment rate from the epithelium does not change but fewer cells attach to the epithelium, therefore, increasing the number of bacteria present in the mucus. Both of these processes have a biological basis and it is likely that both may contribute to the second peak. It is evident from histology carried out on rectal tissue from colonized animals that infection does lead to detachment of the affected epithelial cells [35]. Given the single infection dose and the limited colonization site, it is proposed that this detachment occurs over a defined enough time period to significantly increase bacterial numbers in the rectal mucus. An increase in bacterial numbers in the mucus as a consequence of immune induction could reflect increased turnover of epithelial cells as a mechanism to remove attached bacteria. This may also reduce possible sites for colonization on the epithelium, switching the mechanism to M3 rather than M2. Equally, the induced response through both innate and adaptive mechanisms could result in the secretion of factors that inhibit bacterial binding to the epithelium, therefore, raising levels of bacteria in the mucus. Alternatively, epithelial cell characteristics may change, e.g. surface markers that restrict attachment or a physical characteristic such as an increase in mucus secretion levels that would also hamper bacterial attachment. Future work will address the relative contribution of these different mechanisms that can inform intervention strategies, in particular the use of adjuvants that may stimulate the appropriate protective but non-adaptive responses.
The model also defines ranges of growth and attachment rates that can be tested in vitro, for example, the replication rate of the bacteria while attached to epithelial cells. The values obtained from the model indicated that E. coli can replicate in the mucous layer at rates equivalent to the fastest doubling times obtained under in vitro conditions (20 min [28]), vindicating the model as the organism is most likely to be perfectly adapted to take advantage of this niche host site and the nutrients available. Variation in these rates may reflect many different factors, including the existing microbial flora, relative levels of gastrointestinal inflammation, for example, as a result of co-infections, and genetic variation. Taken together, the derived model provides novel insights into colonization of cattle by EHEC O157 and the timing and nature of the immune response that leads to clearance of the infection. This can now be applied to target future research to explore the mechanisms involved in protection against EHEC O157 colonization, and investigate the significance of strain and host variation in the epidemiology of this important zoonosis.
Acknowledgements
The oral bacterial challenges (1010 colony forming units) were carried out at the Moredun Research Institute under Home Office licence 60/3179 with local ethical approval from the Moredun Research Institute Animal Experiments Committee.
References
- 1.Naylor S. W., Low J. C., Besser T. E., Mahajan A., Gunn G. J., Pearce M. C., McKendrick I. J., Smith D. G. E., Gally D. L. 2003. Lymphoid follicle-dense mucosa at the terminal rectum is the principal site of colonization of enterohaemorrhagic Escherichia coli O157 : H7 in the bovine host. Infect. Immun. 71, 1505–1512 10.1128/IAI.71.3.1505-1512.2003 (doi:10.1128/IAI.71.3.1505-1512.2003) [DOI] [PMC free article] [PubMed] [Google Scholar]
- 2.Dean-Nystrom E. A., Bosworth B. T., Moon H. W., O'Brien A. D. 1998. Escherichia coli O157 : H7 requires intimin for enteropathogenicity in calves. Infect. Immun. 66, 4560–4563 [DOI] [PMC free article] [PubMed] [Google Scholar]
- 3.Cornick N. A., Booher S. L., Moon H. W. 2002. Intimin facilitates colonization by Escherichia coli O157 : H7 in adult ruminants. Infect. Immun. 70, 2704–2707 10.1128/IAI.70.5.2704-2707.2002 (doi:10.1128/IAI.70.5.2704-2707.2002) [DOI] [PMC free article] [PubMed] [Google Scholar]
- 4.Dziva F., van Diemen P. M., Stevens M. P., Smith A. J., Wallis T. S. 2004. Identification of Escherichia coli O157 : H7 genes influencing colonization of the bovine gastrointestinal tract using signature-tagged mutagenesis. Microbiology 150, 3631–3645 10.1099/mic.0.27448-0 (doi:10.1099/mic.0.27448-0) [DOI] [PubMed] [Google Scholar]
- 5.Low A. S., et al. 2006. Cloning, expression and characterization of fimbrial operon F9 from enterohemorrhagic Escherichia coli O157:H7. Infect. Immun. 74, 2233–2244 10.1128/IAI.74.4.2233-2244.2006 (doi:10.1128/IAI.74.4.2233-2244.2006) [DOI] [PMC free article] [PubMed] [Google Scholar]
- 6.Mahajan A., et al. 2009. An investigation of the expression and adhesin function of H7 flagella in the interaction of Escherichia coli O157 : H7 with bovine intestinal epithelium. Cell Microbiol. 11, 121–137 10.1111/j.1462-5822.2008.01244.x (doi:10.1111/j.1462-5822.2008.01244.x) [DOI] [PubMed] [Google Scholar]
- 7.Rendón M. A., Saldaña Z., Erdem A. L., Monteiro-Neto V., Vázquez A., Kaper J. B., Puente J. L., Girón J. A. 2007. Commensal and pathogenic Escherichia coli use a common pilus adherence factor for epithelial cell colonization. Proc. Natl Acad. Sci. USA 104, 10 637–10 642 10.1073/pnas.0704104104 (doi:10.1073/pnas.0704104104) [DOI] [PMC free article] [PubMed] [Google Scholar]
- 8.Robinson C. M., Sinclair J. F., Smith M. J., O'Brien A. D. 2006. Shiga toxin of enterohemorrhagic Escherichia coli type O157 : H7 promotes intestinal colonization. Proc. Natl Acad. Sci. USA 103, 9667–9672 10.1073/pnas.0602359103 (doi:10.1073/pnas.0602359103) [DOI] [PMC free article] [PubMed] [Google Scholar]
- 9.Tree J. J., Wolfson E. B., Wang D., Roe A. J., Gally D. L. 2009. Controlling injection: regulation of type III secretion in enterohaemorrhagic Escherichia coli. Trends Microbiol. 17, 361–370 10.1016/j.tim.2009.06.001 (doi:10.1016/j.tim.2009.06.001) [DOI] [PubMed] [Google Scholar]
- 10.Hemrajani C., Berger C. N., Robinson K. S., Marchès O., Mousnier A., Frankel G. 2010. NleH effectors interact with Bax inhibitor-1 to block apoptosis during enteropathogenic Escherichia coli infection. Proc. Natl Acad. Sci. USA 107, 3129–3134 10.1073/pnas.0911609106 (doi:10.1073/pnas.0911609106) [DOI] [PMC free article] [PubMed] [Google Scholar]
- 11.Newton H. J., et al. 2010. The type III effectors NleE and NleB from enteropathogenic E. coli and OspZ from Shigella block nuclear translocation of NF-kappaB p65. PLoS Pathog. 6, e1000898. 10.1371/journal.ppat.1000898 (doi:10.1371/journal.ppat.1000898) [DOI] [PMC free article] [PubMed] [Google Scholar]
- 12.Vlisidou I., Marchés O., Dziva F., Mundy R., Frankel G., Stevens M. P. 2006. Identification and characterization of EspK, a type III secreted effector protein of enterohaemorrhagic Escherichia coli O157 : H7. FEMS Microbiol. Lett. 263, 32–40 10.1111/j.1574-6968.2006.00410.x (doi:10.1111/j.1574-6968.2006.00410.x) [DOI] [PubMed] [Google Scholar]
- 13.Tobe T., et al. 2006. An extensive repertoire of type III secretion effectors in Escherichia coli O157 and the role of lambdoid phages in their dissemination. Proc. Natl Acad. Sci. USA 103, 14 941–14 946 10.1073/pnas.0604891103 (doi:10.1073/pnas.0604891103) [DOI] [PMC free article] [PubMed] [Google Scholar]
- 14.McNeilly T. N., Mitchell M. C., Rosser T., McAteer S., Low J. C., Smith D. G. E. S., Huntley J., Mahajan A., Gally D. L. 2010. Immunization of cattle with a combination of purified intimin-531, EspA and Tir significantly reduces shedding of Escherichia coli O157 : H7 following oral challenge. Vaccine 28, 1422–1428 10.1016/j.vaccine.2009.10.076 (doi:10.1016/j.vaccine.2009.10.076) [DOI] [PubMed] [Google Scholar]
- 15.Thomson D. U., Loneragan G. H., Thornton A. B., Lechtenberg K. F., Emery D. A., Burkhardt D. T., Nagaraja T. G. 2009. Use of a siderophore receptor and porin proteins-based vaccine to control the burden of Escherichia coli O157 : H7 in feedlot cattle. Foodborne Pathog. Dis. 6, 871–877 10.1089/fpd.2009.0290 (doi:10.1089/fpd.2009.0290) [DOI] [PubMed] [Google Scholar]
- 16.Moxley R. A., Smith D. R., Luebbe M., Erickson G. E., Klopfenstein T. J., Rogan D. 2009. Escherichia coli O157 : H7 vaccine dose-effect in feedlot cattle. Foodborne Pathog. Dis. 6, 879–884 10.1089/fpd.2009.0297 (doi:10.1089/fpd.2009.0297) [DOI] [PubMed] [Google Scholar]
- 17.Potter A. A., et al. 2004. Decreased shedding of Escherichia coli O157 : H7 by cattle following vaccination with type III secreted proteins. Vaccine 22, 362–369 10.1016/j.vaccine.2003.08.007 (doi:10.1016/j.vaccine.2003.08.007) [DOI] [PubMed] [Google Scholar]
- 18.Chase-Topping M., Gally D., Low J. C., Woolhouse M. E. J. 2008. Supershedding and the link between and human and livestock infection with Escherichia coli O157:H7. Nat. Rev. Microbiol. 6, 904–912 10.1038/nrmicro2029 (doi:10.1038/nrmicro2029) [DOI] [PMC free article] [PubMed] [Google Scholar]
- 19.Matthews L., et al. 2006. Heterogeneous shedding of Escherichia coli O157 in cattle and its implications for control. Proc. Natl Acad. Sci. USA 103, 547–552 10.1073/pnas.0503776103 (doi:10.1073/pnas.0503776103) [DOI] [PMC free article] [PubMed] [Google Scholar]
- 20.Naylor S. W., Flockhart A., Nart P., Smith D. G. E., Huntley J., Gally D. L., Low J. C. 2007. Shedding of Escherichia coli O157 : H7 in calves is reduced by prior colonization with the homologous strain. Appl. Environ. Microbiol. 73, 3765–3767 10.1128/AEM.02670-06 (doi:10.1128/AEM.02670-06) [DOI] [PMC free article] [PubMed] [Google Scholar]
- 21.Johnson R., Cray W., Johnson S. 1996. Serum antibody responses of cattle following experimental infection with Escherichia coli O157 : H7. Infect. Immun. 64, 1879–1883 [DOI] [PMC free article] [PubMed] [Google Scholar]
- 22.Naylor S. W., Nart P., Sales J., Flockhart A., Gally D. L., Low J. C. 2007. Impact on Escherichia coli O157 : H7 shedding of the direct application of therapeutics to the terminal rectum of experimentally-colonised calves. Appl. Environ. Microbiol. 73, 1493–1500 10.1128/AEM.01736-06 (doi:10.1128/AEM.01736-06) [DOI] [PMC free article] [PubMed] [Google Scholar]
- 23.McNeilly T. N., Naylor S. W., Mitchell M. C., McAteer S., Mahajan A., Smith D. G., Gally D. L., Low J. C., Huntley J. F. 2008. Escherichia coli O157 : H7. Colonisation in cattle following systemic and mucosal vaccination with purified H7 flagellin. Infect. Immun. 76, 2594–2602 10.1128/IAI.01452-07 (doi:10.1128/IAI.01452-07) [DOI] [PMC free article] [PubMed] [Google Scholar]
- 24.Anderson E., et al. 1999. LAPACK users' guide, 3rd edn Philadelphia, PA: Society for Industrial and Applied Mathematics [Google Scholar]
- 25.Girolami M. 2008. Bayesian inference for differential equations. Theor. Comput. Sci. 408, 4–16 10.1016/j.tcs.2008.07.005 (doi:10.1016/j.tcs.2008.07.005) [DOI] [Google Scholar]
- 26.Miller M. R., Råberg L., Read A. F., Savill N. J. 2010. Quantitative analysis of immune response and erythropoiesis during rodent malarial infection. PLoS Comput. Biol. 6, e1000946. 10.1371/journal.pcbi.1000946 (doi:10.1371/journal.pcbi.1000946) [DOI] [PMC free article] [PubMed] [Google Scholar]
- 27.Akaike H. 1974. A new look at the statistical model identification. Automatic Control. IEEE Trans. 19, 716–723 10.1109/TAC.1974.1100705 (doi:10.1109/TAC.1974.1100705) [DOI] [Google Scholar]
- 28.Gonthier A., Guérin-Faublée V., Tilly B., Delignette-Muller M. L. 2001. Optimal growth temperature of O157 and non-O157 Escherichia coli strains. Lett. Appl. Microbiol. 33, 352–356 10.1046/j.1472-765X.2001.01010.x (doi:10.1046/j.1472-765X.2001.01010.x) [DOI] [PubMed] [Google Scholar]
- 29.Perelson A. S., Neumann A. U., Markowitz M., Leonard J. M., Ho D. D. 1996. HIV-1 dynamics in vivo: virion clearance rate, infected cell life-span, and viral generation time. Science 271, 1582–1586 10.1126/science.271.5255.1582 (doi:10.1126/science.271.5255.1582) [DOI] [PubMed] [Google Scholar]
- 30.Friel N., Pettitt A. N. 2008. Marginal likelihood estimation via power posteriors. J. R. Statist. Soc. B 70, 589–607 10.1111/j.1467-9868.2007.00650.x (doi:10.1111/j.1467-9868.2007.00650.x) [DOI] [Google Scholar]
- 31.McNeilly T. N., et al. 2010. IgA and IgG antibody responses following systemic immunization of cattle with native H7 flagellin differ in epitope recognition and capacity to neutralise TLR5 signalling. Vaccine 28, 1412–1421 10.1016/j.vaccine.2009.10.148 (doi:10.1016/j.vaccine.2009.10.148) [DOI] [PubMed] [Google Scholar]
- 32.Wood J. C., McKendrick I. J., Gettinby G. 2006. A simulation model for the study of the within-animal infection dynamics of E. coli O157. Prevent. Vet. Med. 74, 180–193 10.1016/j.prevetmed.2005.11.011 (doi:10.1016/j.prevetmed.2005.11.011) [DOI] [PubMed] [Google Scholar]
- 33.Fischbach M. A., et al. 2006. The pathogen-associated iroA gene cluster mediates bacterial evasion of lipocalin 2. Proc. Natl Acad. Sci. USA 103, 16 502–16 507 10.1073/pnas.0604636103 (doi:10.1073/pnas.0604636103) [DOI] [PMC free article] [PubMed] [Google Scholar]
- 34.Menendez A., Brett Finlay B. 2007. Defensins in the immunology of bacterial infections. Curr. Opin. Immunol. 19, 385–391 10.1016/j.coi.2007.06.008 (doi:10.1016/j.coi.2007.06.008) [DOI] [PubMed] [Google Scholar]
- 35.Nart P., Naylor S. W., Huntley J. F., McKendrick I. J., Gally D. L., Low J. C. 2008. Responses of cattle to gastrointestinal colonization by Escherichia coli O157:H7. Infect. Immun. 76, 5366–5372 10.1128/IAI.01223-07 (doi:10.1128/IAI.01223-07) [DOI] [PMC free article] [PubMed] [Google Scholar]
- 36.Chase-Topping M. E., et al. 2007. Risk factors for the presence of high-level shedders of Escherichia coli O157 on Scottish farms. J. Clin. Microbiol. 45, 1594–1603 10.1128/JCM.01690-06 (doi:10.1128/JCM.01690-06) [DOI] [PMC free article] [PubMed] [Google Scholar]