Abstract
We present the development and testing of a semi-automated tool to support the diagnosis of left ventricle (LV) dysfunctions from cardiac magnetic resonance (CMR). CMR short-axis images of the LVs were obtained in 15 patients and processed to detect endocardial and epicardial contours and compute volume, mass and regional wall motion (WM). Results were compared with those obtained from manual tracing by an expert cardiologist. Nearest neighbour tracking and finite-element theory were merged to calculate local myocardial strains and torsion. The method was tested on a virtual phantom, on a healthy LV and on two ischaemic LVs with different severity of the pathology. Automated analysis of CMR data was feasible in 13/15 patients: computed LV volumes and wall mass correlated well with manually extracted data. The detection of regional WM abnormalities showed good sensitivity (77.8%), specificity (85.1%) and accuracy (82%). On the virtual phantom, computed local strains differed by less than 14 per cent from the results of commercial finite-element solver. Strain calculation on the healthy LV showed uniform and synchronized circumferential strains, with peak shortening of about 20 per cent at end systole, progressively higher systolic wall thickening going from base to apex, and a 10° torsion. In the two pathological LVs, synchronicity and homogeneity were partially lost, anomalies being more evident for the more severely injured LV. Moreover, LV torsion was dramatically reduced. Preliminary testing confirmed the validity of our approach, which allowed for the fast analysis of LV function, even though future improvements are possible.
Keywords: left ventricle, ischaemic cardiomyopathy, cardiac magnetic resonance, diagnostic tool
1. Introduction
Ischaemic cardiomyopathy is responsible for up to 65 per cent of the prevalence of heart failure (HF) [1]. Despite appropriate medical management, myocardial infarction initiates a remodelling process that potentially entails left ventricle (LV) dilation and mitral valve (MV) insufficiency, often proportional to the extent of damaged myocardium. To compensate for reduced ventricular function, the LV dilates to increase stroke volume through two distinct phases governed by mechanical, genetic and neurohormonal factors [2]: early remodelling, characterized by infarct expansion with wall thinning and LV dilation with subsequent increase in wall stress, and late remodelling, in which increased wall stress induces cardiomyocytes hypertrophy. Unfortunately, remodelling leads to alterations in the LV architecture towards a spherical form, further increasing wall stress, resulting in a vicious cycle leading to HF.
Imaging techniques play a pivotal role in LV function assessment in supporting clinical decision-making. Among them, cardiac magnetic resonance (CMR) imaging is a non-invasive technique currently considered the standard reference in the clinical evaluation of the LV.
Conventional two-dimensional cine images are normally used to asses LV volume, function, mass and regional dysfunction [3,4]. However, their analysis requires slice-by-slice, phase-by-phase endo- and epicardial boundaries detection. Even with commercial software, it requires extensive manual corrections, thus resulting in a poorly automated, time consuming and subjective analysis technique. Different techniques for CMR LV semi-automated and automated border detection have been described [5], but they suffer from different limitations: a large number of manually segmented images required to build a model database or to train the model [6], analysis limited to end-diastolic (ED) and end-systolic (ES) phases only, no continuous temporal segmentation and computational complexity [7].
Tagged-CMR is widely adopted to calculate two-dimensional wall strains by tracking the two-dimensional motion of myocardial points (defined by tags crossing) over time; it permits rapid imaging and visualization, as well as automation [8]. However, this technique does not capture real three-dimensional strains and does not allow for the analysis of the complete cardiac cycle, since the tags (i) can become less distinct, and thus more difficult to track, owing to out-of-plane motion of the tissue, and (ii) fade after a few time-frames, so that the analysis cannot be extended to the entire cardiac cycle. Moreover, only a few slices are acquired via tagged-CMR as additional sequences to the conventional examination. The assessment of three-dimensional myocardial motion using MR tagging techniques using multiple orthogonal image planes [9–11] or fully three-dimensional MR tagged imaging [12] is still part of the research arena and is primarily limited by the need for lengthy image acquisition protocols and for tedious post-processing procedures.
The availability of a reliable technique for automated endocardial and epicardial contour detection and regional wall strain calculation throughout the cardiac cycle on conventional cine CMR images would overcome these limitations, providing an exhaustive quantitative analysis of the LV.
Within the framework of the virtual pathological heart of the virtual physiological human (VPH2) project, we aim at developing two decision support tools for cardiologists and cardiac surgeons, based on LV patient-specific modelling, the functional assessment tool (FAT) and the functional predictive tool (FPT). FAT quantitatively analyses LV, by semi-automated endocardial and epicardial detection, and MV function from CMR images, thus helping defining the severity and extent of disease in patients with LV dysfunction, with or without mitral regurgitation. FPT is used for an easy and fast simulation of post-operative scenarios subsequent to different surgical procedures.
The present paper is focused on the development, testing and validation of the LV-related capabilities of the FAT: (i) semi-automated detection of endocardial and epicardial contours for volumetric and wall motion (WM) analysis; (ii) quantification of LV volume, mass and regional WM; and (iii) computation of local strains in the myocardium. FAT contour detection was verified on a small population of subjects (n = 13), while its capability to correctly compute local LV wall strains was tested on a virtual phantom and on three real ventricles characterized by different clinical scenarios.
2. Methods
2.1. Cardiac magnetic resonance imaging
A group of 15 patients with previous myocardial infarction and regional WM abnormalities was considered. CMR studies were performed using a 1.5 T scanner (Signa Hdx, GE Healthcare, Milwaukee, WI, USA). An eight-element cardiac phased-array receiver surface coil with breath-holding in expiration and ECG-gating were used for signal reception. Three standard cine long-axis slices and a stack (from 8 to 12) of contiguous cine short-axis slices from the atrio-ventricular ring to the apex were acquired using a steady-state free-precession pulse sequence (30 phases, slice thickness 8 mm with no overlap and no gap, field of view = 40 cm, reconstruction matrix 256 × 256, repetition time = 3.5 ms, echo time = 1.5 ms, flip angle 45°).
2.2. Algorithms for contours detection
The semi-automated detection of LV contours was based on region-based image noise distribution (for LV endocardial detection) and on edge-based image gradient (for LV epicardial detection).
2.2.1. Endocardial border detection
The endocardial border detection is based on the formulation proposed by Chan & Vese [13] and on embedding in the segmentation model the a priori knowledge of the statistical distribution of grey levels in medical images [14]. In particular, concerning CMR, we note that image pixels are modelled as Gaussian distributed random variables. Then the proposed method drives the curve evolution to achieve a maximum-likelihood segmentation of the target, with respect to the statistical distribution law of image pixels.
Let us consider an image I as a real positive function defined in a domain Ω ⊂ ℜ2. The grey levels are assumed to be uncorrelated and independently distributed. They are thus characterized by their respective probability density. Now, we define a closed curve C partitioning the image domain in an ‘inside’ Ωi and an ‘outside’ Ωe and denote with Pi = ΠΩi(C)p(I) the probability of the random field inside the curve and with Pe = ΠΩe(C)p(I) the probability outside the curve. Without any a priori knowledge about the shape of the object to be detected, we look for the curve C that maximizes the likelihood function given by the product of the inner and the outer probability [15]: P[I|C] = Pi Pe.
Since the log function is strictly increasing, the maximum value of P[I|C], if it exists, will occur at the same points as the maximum value of l(I,C) = log(P[I|C]). This function is the ‘log likelihood’ and in many cases it is easier to work with it than with the likelihood function. Indeed, the product structure of the probability function is transformed in a summation or integral structure of the log likelihood. Passing to the continuous limit, we replace the sum with the integral and, to perform a maximum-likelihood segmentation of the target, we need to maximize the functional I with respect to variation of the curve C.
By considering the Gaussian noise distribution:
 |
2.1 |
where μ and σ are the average and variance of I, respectively, the corresponding log-likelihood is derived as in Chesnaud et al. [16]. Then, following the model proposed by Chan & Vese [13] and embedding in the segmentation model the a priori knowledge of statistical distribution of grey levels in CMR images [17], the final associated flow results:
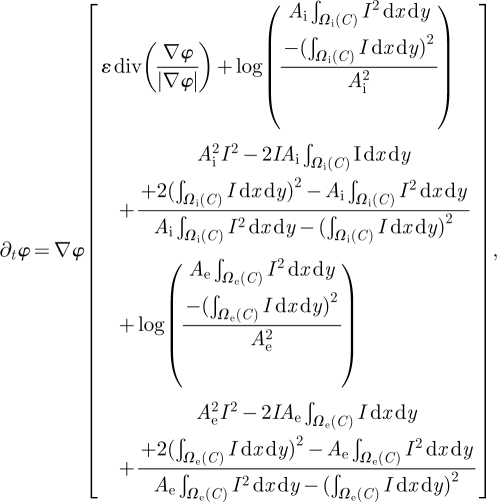 |
2.2 |
where Ai and Ae are, respectively, the number of pixels in Wi and We, and φ(x,y,0) is the initial function with the property that its zero-level set corresponds to the position of the initial front. Typically, it is defined by φt(x,y,0) = ±d, where d is the signed distance function from each point to the initial front [18], and δ(φ)/|∇φ|∂φ/∂ n = 0 are the boundary conditions.
The evolution process will stop when the region probability terms of the inside regions do equal the terms of outside regions, up to regularization of boundaries (figure 1a).
Figure 1.
Schematization of the border detection procedure: (a) after initialization of one point inside the LV cavity, the algorithm based on the region-based image noise distribution iterates expanding the cavity position; (b) a second step algorithm, based on curvature-based motion, is then applied to regularize the contour and thus include papillary muscles and ventricular trabeculations inside the LV cavity, thus producing the final position of the endocardial contour; (c) the Malladi–Sethian model for active contour evolution is then applied starting from the detected endocardium (in red) in order to determine the epicardial position (in white).
To define the initial function, we require the manual placement of a single point inside the LV cavity. From a mathematical point of view, we defined a curve C, centred in the manual selected point, as the zero-level set of an implicit real function φ taking values on the image domain Ω:
| 2.3 |
This initial circumference C undergoes the evolution described in equation (2.1) in order to maximize the functional F.
Following this step, the boundary regularization was achieved using a curvature-based motion not allowing curvature above the mean Euclidean curvature value of the detected contour and designed to automatically include the papillary muscles in the LV cavity (figure 1b).
2.2.2. Epicardial border detection
To identify the epicardial boundary (figure 1c), we drove the evolution of an initial contour applying the well-known Malladi–Sethian model for active contour evolution, which requires adequate boundary conditions.
The model includes a dependence of the speed on the curvature, a propagation expansion speed and an advection speed based on the image gradient:
| 2.4 |
where K is the mean curvature, g is the edge indicator, ν and λ are weighting coefficients.
The edge indicator g is a non-increasing function of the gradient of the initial image [19]:
 |
2.5 |
The parameter α depends on the characteristics of the noise in the image: α controls the sensitivity to edges and therefore it was empirically set to 20 to select the contrast of the objects we want to consider in the image during the motion of the embedding. The parameter ν is used to limit the regularization of the embedding controlled by the parameter λ: these parameters were set equal to 10 and 6, respectively.
The contour evolution will have a steady-state solution when the geometry dependent and expansion terms balance the advection term [17]. At the end of this step, the epicardial boundary was also regularized applying a modified curvature motion.
2.2.3. Algorithms initialization
For endocardial detection, the region-based approach was applied from basal to apical slices for each frame. In the basal slice, after initialization of the algorithm's parameters (radius of the initial circle, and per cent of radius decrement from one slice to the next one), the operator selected one point inside the LV cavity. Then, automatically, the applied algorithm expanded the initial circle according to the videointensity probability distribution followed by the regularizing expansion to include the papillary muscles, when present. Then, the algorithm processed the other slices, using the detected contour on the current slice (s) as initialization for the next (s + 1) slice, after reducing it by the per cent set by the operator.
For epicardial detection, this approach required a robust initialization on the first frame f. Then, for the next frame f + 1, the initialization was obtained by applying the ‘erode’ morphological operation applied to the resulting epicardial contour on the frame f.
For each slice and frames, the detected contours were then superimposed to the original image, to allow for possible corrections, if needed.
2.3. Left ventricle volume and mass quantification
The LV volume was automatically computed by summing the LV area in each slice (measured as pixel counts inside the endocardial contour) multiplied by the pixel spatial resolution and by the slice thickness (from the DICOM header). In the same way, the LV mass was computed as the difference between the LV epicardial and LV endocardial volumes, and multiplied by 1.05 to be expressed in grams.
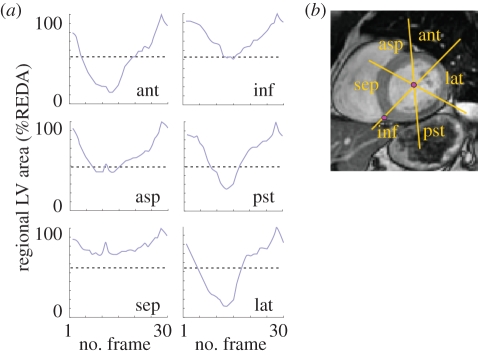
For the automated interpretation of regional WM, the ED frame was used to define the standard segmentation scheme for the LV short-axis view in each slice (figure 2b). In the slice at the mid-ventricular position, the ED centroid of the LV cavity was calculated as centre of mass of the binary image representing the detected LV cavity, in which all pixels in the cavity appear ‘on’ (i.e. have value 1) and have been attributed with a unit mass, and used as the origin of segmentation.
Figure 2.
(a) Schematization of the definition of the six sectors for wall motion (WM) interpretation: ant, anterior; asp, antero-septal; sep, septal; inf, inferior; pst, posterior; lat, lateral (see text for more details). (b) Example of the regional WM curves obtained by the endocardial detection throughout the cardiac cycle in one slice at mid LV level. The grey dotted line in each graph represents the 50% threshold applied to regional area change values to automatically detect WM abnormalities. In this example, the septal sector (sep) was automatically interpreted as abnormal.
An additional point was then manually placed at the junction between the right ventricular free wall and the interventricular septum. Starting from that point, the LV cavity was divided into six 60° wedge-shaped segments, corresponding to those used for visual assessment and grading of WM. For each segment, regional fractional area (RFA) in per cent of regional ED area was automatically calculated throughout the cardiac cycle using a fixed-coordinate reference system. From these six curves in each slice, RFA change (RFAC) was computed as the difference between the maximum and minimum value of RFA, expressed in per cent of the regional ED area. For each segment, these values were used to automatically interpret WM as normal (RFAC ≥ 50%) or abnormal (RFAC < 50%) (figure 2a).
2.4. Validation of left ventricle volume and mass quantification
For validation purposes, data calculated through our semi-automated procedure were compared with the manual measurements performed by an expert cardiologist. The latter analysed CMR data using commercial software (MASS v. 6.1, Medis, Leiden, The Netherlands) installed on the MRI workstation and proceeded into the conventional analysis of these images by manual tracing LV endo- and epicardial contours. Then, LV ED and ES volumes (EDV and ESV, respectively) and mass were measured using standard volumetric techniques. The same number of slices included for the reference value assessment by the expert were included in these computations, to avoid bias owing to the inclusion of a different number of slices.
Moreover, dynamic images were reviewed and regional WM was interpreted in three slices selected at apical, mid and basal levels. In each of these slices, the six regional segments (anterior, lateral, antero-lateral, septal, inferior and posterior) were qualitatively graded as normal or abnormal, thus providing the ‘gold standard’ for WM interpretation.
The results obtained from the automated analysis were then compared with the reference values by (i) linear regression and Bland–Altman analyses for LV volumes and mass; (ii) levels of agreement between the cardiologist WM grades and the automated classification of regional WM.
Sensitivity, specificity and accuracy for the automated interpretation of WM were also computed.
2.5. Calculation of left ventricle local strains and left ventricle torsion
Local strains in the LV myocardium were calculated through the following four steps:
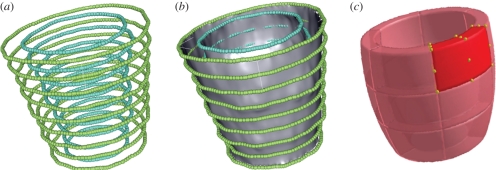
— A slice-based reconstruction method [20] was used to obtain smooth, three-dimensional endocardial and epicardial surfaces, discretized into three-node triangular elements, from the sampled previously detected contours (figure 3a,b).
— In the ED frame, endocardial and epicardial surfaces were divided into six longitudinal sections and three circumferential sections, for a total of 18 sectors (figure 3c). For each sector, its eight vertices were identified and the corresponding local principal curvatures calculated as in Vieira & Shimada [21].
-
— The eight vertices of each sector were tracked throughout the subsequent time-points by means of a nearest neighbour search, assuming that the position of a given point P on the LV surface and the surface's local shape in P change continuously throughout the cardiac cycle, and thus undergo small changes in a sufficiently short time-frame. Briefly, at the time-point t, the position of P on the triangulated surface St is xt. At t + 1, the triangulated surface St+1 is deformed, and P has moved to its new position xt+1, estimated as the position of the node in St+1 that minimizes the following function:
where xt + 1,i is the position of the ith node on the surface St + 1, xt and x0 are the known positions of P at t and at ED, K1 and K2 are the curvature tensor principal components and a1, a2, a3 are three positive scalar coefficients defined as: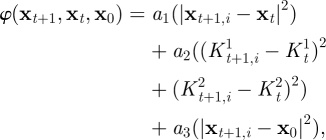
2.6 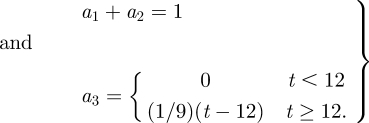
2.7 In the first term of φ, |xt+i − xt| is the displacement needed to move P from its initial position xt to its new one. The second term accounts for the change in local shape experienced by the surface, where
 and
and  are the concomitant changes in local principal. In both terms, quadratic quantities are considered; thus, their convex linear combination is minimized if both terms are minimized. The coefficients a1 and a2 were set to 0.2 and 0.8, respectively, accordingly with a preliminary sensitivity analysis. The third term of the function is active only for t ≥ 12, i.e. for the diastolic time-points, and enforces the return of the tracked point P to its initial position. The nearest neighbours search provided the time-dependent position of the eight vertices of each of the 18 sectors of the LV myocardium and, thus, the corresponding time-dependent displacements.
 -
— A continuous displacement field was reconstructed within each sector by treating the latter as an eight-node isoparametric hexahedral finite element. A local system of coordinates s = (s1, s2, s3) was defined, with si ∈ [−0.5;0.5] and with s1, s2, s3 aligned, respectively, along the local circumferential, radial and axial directions of the LV in a cylindrical reference system with the z-axis on the LV long axis. Coordinates and displacements of each point within the sector were estimated by interpolating the coordinates and the displacements of the eight vertices via linear shape functions:
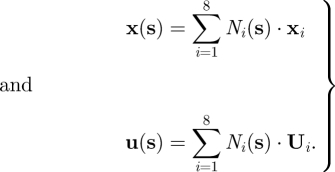
2.8 The strain tensor was computed as:
where C is the right Cauchy-Green strain tensor, F is the deformation gradient tensor, defined as F = ∂x/∂X, i.e. the derivative of the current position x as regards to the initial position X, and H is the displacement gradient tensor, defined as ∂u/∂X, i.e. the derivative of the displacement u as regards to the initial position X. H was computed as: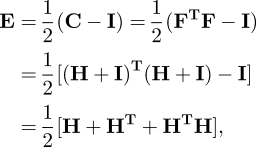
2.9
where J is the Jacobian matrix that maps the global coordinates onto the local ones, i.e. J = ∂X/∂s.
2.10 In particular, the strain tensor E was assessed at the centre of each sector (s1 = s2 = s3 = 0).
-
— For the six vertexes at the basal end of the endocardial surface, and for the six vertexes at its apical end, the time-dependent average rotation angle θrot was computed. In an orthonormal reference system x,y,z centred in the LV centre of mass, with the z-axis aligned with the long-axis, θrot was defined as:

2.11 Positive values of θrot(t) corresponded to a counter-clockwise rotation as seen from the LV apex. The ventricle torsion was computed as:
2.12
Figure 3.
(a) Points obtained by sampling the endocardial (blue) and epicardial (green) contours. (b) Three-dimensional smooth endocardial and epicardial surfaces. (c) Sketch of LV segments.
2.6. Validation of local strains calculation
The validation of the method for strains calculation consisted of two steps.
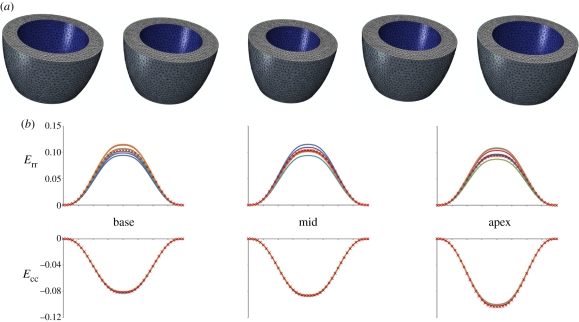
First, we tested its capability to compute strains on objects with simple geometry undergoing simple deformation processes. For this purpose, a virtual phantom, consisting in an ideal, axial-symmetric ventricle was defined and discretized into tetrahedral elements (figure 4a). By means of a commercial finite-element solver (ABAQUS, Simulia Inc., Dessault Systèmes), we simulated its inflation and deflation under the effect of a cyclic, time-dependent inner pressure. The phantom was divided into 18 sectors. The corresponding strains were computed by nearest neighbour tracking of the sectors' vertices, and compared with the values computed by the commercial solver for the tetrahedral elements located at the centre of each sector.
Figure 4.
Virtual phantom model: (a) phantom ventricle geometry discretized into tetrahedral elements; (b) comparison between the local strains of the virtual phantom computed with our code and the output provided by the finite-element solver. Given the axial-symmetry of the phantom, the finite-element solution consists in a single plot for the basal, mid and apical level of the phantom, respectively. (b) Navy blue, sect1; red, sect2; green, sect3; purple, sect4; sky blue, sect5; orange, sect6; red crosses, FEM.
Second, we assessed the method's capability to compute strains in the presence of more complex motion patterns, characterized by non-uniform expansion and deflation, and by torsion. We analysed a normal subject (SUBJECT1), with EDV and ejection fraction (EF) equal to 130 ml and 72 per cent, and two patients affected by late ischaemic pathology: SUBJECT2 (EDV = 117 ml, EF = 44%, antero-lateral infarction), and SUBJECT3 (EDV = 378 ml, EF = 16%, anterior and inferior-lateral infarction). For each subject, we computed time-dependent basal and apical rotation angles, torsion and regional.
3. Results
3.1. FAT validation
Of the 15 patients, two were excluded for artefacts in the images that precluded correct performance of the algorithm without heavy manual correction. The semi-automated analysis was then feasible in 13/15 (87%) patients.
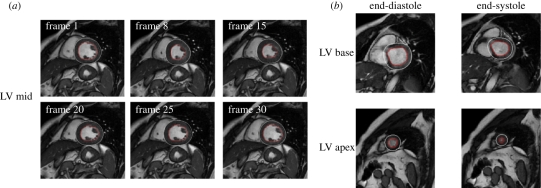
The time required to process a single frame (ED or ES) from base to apex, for both endo- and epicardial contours detection, was approximately 1 min using a standard PC. An example of the detected contours for ED and ES frames at three levels of the LV is shown in figure 5.
Figure 5.
Examples of (a) the detected endocardial (in red) and epicardial contours in a slice at mid-ventricular level, in the same frames throughout the cardiac cycle and (b) in a slice at basal and apical levels at end-diastole and end-systole. At basal levels, manual correction was often needed, as shown in this example by the misplacing of the epicardial contour.
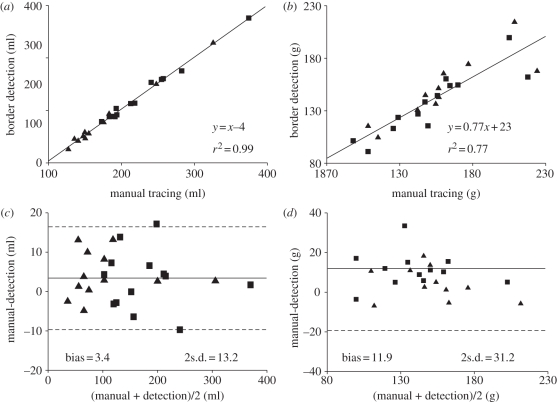
Good correlations were found with the reference values for LV EDV (y = 0.99x + 5.1, r2 = 0.99), and ESV (y = x + 4.34, r2 = 0.99), as well as with their derived parameters SV (y = 0.98x – 0.24, r2 = 0.97) and EF (y = x − 1.56, r2 = 0.98). For LV mass, a good correlation was found (ED, y = 1.07x + 5.41, r2 = 0.81; ES, y = 0.97x + 12.86, r2 = 0.74).
Bland–Altman analysis resulted in minimal bias and narrow limits of agreement in LV ED and ES volumes, and derived parameters. Conversely, a significant overestimation and wider limits of agreement were found for LV mass. In particular, the bias expressed as error%/mean of the gold standard values resulted less than 10 per cent in all parameters, except ED LV mass (table 1). Figure 6 visualizes the results obtained in LV volumes and mass, considering ED and ES measurements together.
Table 1.
Regression analysis results. EDV, end-disastolic volume; ESV, end-systolic volume; SV, stroke volume; EF, ejection fraction.
| bias | bias as error%/mean(%) | 95% limits of agreement | |
|---|---|---|---|
| EDV | −2.5 ml | −1.4 | −17.7 ÷ 12.7 ml |
| ESV | −4.2 ml | −4.1 | −15.3 ÷ 6.8 ml |
| SV | 1.7 ml | 2.1 | −7.6 ÷ 11.0 ml |
| EF% | 1.5% | 3.2 | −3.2 ÷ 6.2% |
| ED LV mass | −15.2 g | −11.2 | −44.9 ÷ 14.6 g |
| ES LV mass | −8.7 g | −5.8 | −41.3 ÷ 23.8 g |
Figure 6.
Linear correlation and Bland–Altman analysis of the results of (a, c) LV volumes and (b, d) mass (with end-diastolic, squares, and end-systolic, triangles, measurements considered together) obtained by manual tracing of CMR images (gold-standard) and through application of the developed endocardial and epicardial border detection algorithm.
As regards the automated detection of LV WM, the time needed to process a single slice (30 frames), for endocardial contour detection, and for regional WM analysis, was approximately 1 min. The gold standard interpretation resulted in 135 segments evaluated as normal, and 99 as abnormal.
Figure 2 shows an example of the regional WM curves, as well as the scheme used for their quantification. Of the analysed 234 segments (13 patients × 6 sectors × 3 slices), 77 were automatically classified as true positive, 115 as true negative, 20 as false positive and 22 as false negative, based on the selected 50 per cent threshold. These counts resulted in 77.8 per cent sensitivity, 85.1 per cent specificity and 82 per cent accuracy in the automated interpretation of WM.
3.3. Left ventricle local strains
3.3.1. Analysis of the virtual phantom
Figure 4 shows the good agreement between the local strains of the virtual phantom computed with our method and the finite-element solution, the maximum difference being equal to 14 per cent.
3.3.2. Analysis of the real ventricles
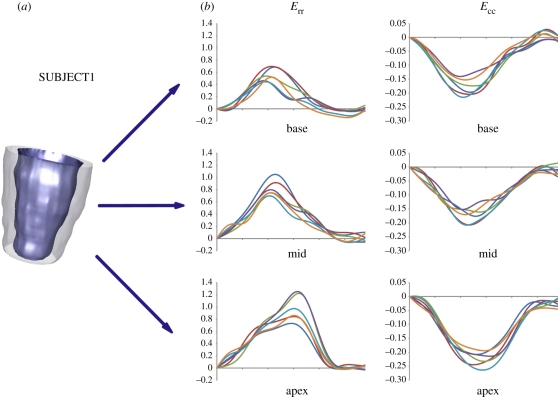
For normal SUBJECT1, the measured regional strain curves (figure 7) provided uniform strain patterns over all myocardial segments; in the systolic phase, all sectors contracted circumferentially and thickened radially. Circumferential shortening increased from the basal region to the apex: peak absolute values ranged from 15 to 21 per cent for the sectors of the basal and mid region, and from 19 to 26 per cent for the apical sectors. Similarly, the observed thickening was progressively more relevant going from the ventricular base to the apex: plots showed maximum values of 51–70%, 69–100% and 72–125% for the sectors in the basal, mid and apical region, respectively. Apical and basal maximal systolic rotations and maximal torsion were 7.8°, −2.8° and 10.2°, respectively (see figure 9, top panel).
Figure 7.
(a) Three-dimensional reconstruction of LV endocardial and epicardial surfaces at ED for SUBJECT1. (b) Radial (Err) and circumferential strain (Ecc) curves for the six sectors of the basal, mid and apex regions. (b) Navy blue, sect1; red, sect2; green, sect3; purple, sect4; sky blue, sect5; orange, sect6.
Figure 9.
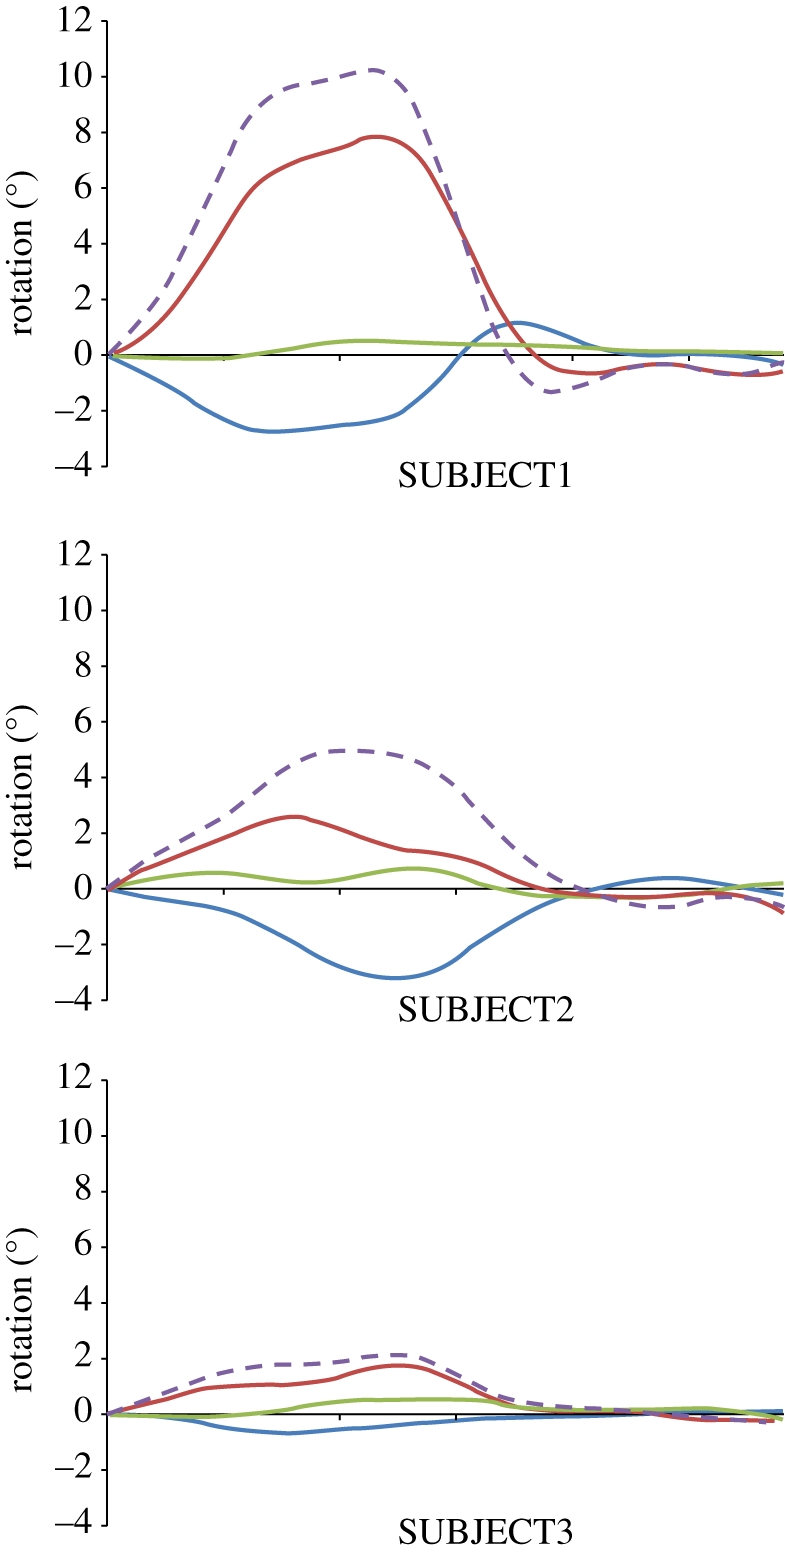
LV rotation profiles for SUBJECT 1, 2 and 3. Blue, green and red solid lines indicate basal, mid and apical rotation, respectively. Violet dashed line indicates LV torsion.
In the pathological subjects, the normal waveform of time-dependent strains, coherence between sectors at the same level, and trends characterizing the changes from the basal to the apical region, were lost.
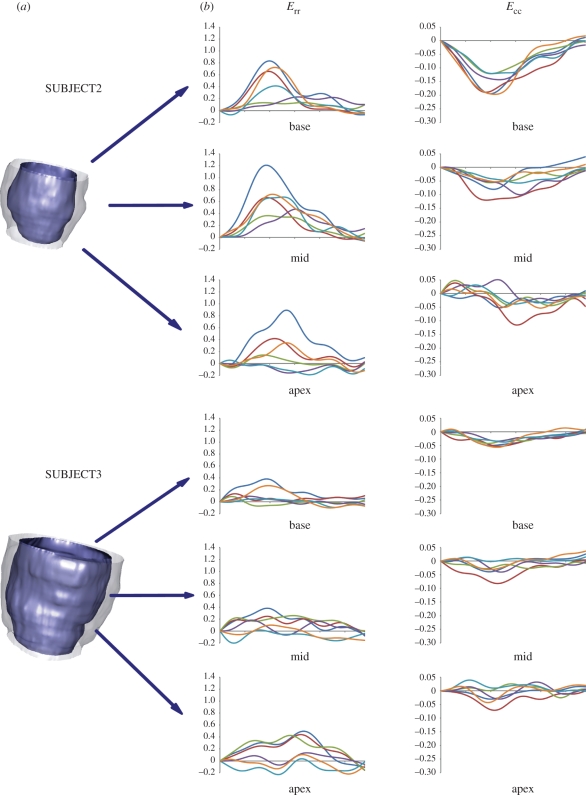
For SUBJECT2 (figure 8, top panel), in the basal region, circumferential shortenings showed a slower dynamics, with maximal values ranging from 12 to 20 per cent. In the mid and apical regions, progressively more irregular patterns and lower maximal values (from 5% to 12% and from 3% to 5%, respectively) were computed. As regards radial thickening, four of the basal sectors showed values from 40 to 80 per cent, whereas much lower values (13% and 22%) were observed in the remaining two sectors. In the mid and apical regions, maximum thickening ranged from 36 to 120 per cent and from 2 to 88 per cent, respectively. Apical and basal maximal systolic rotations and maximal torsion were 2.6°, −3.1° and 4.9°, respectively (figure 9, mid panel).
Figure 8.
(a) Three-dimensional reconstruction of LV endocardial and epicardial surfaces at ED for SUBJECT2 and 3. (b) Radial (Err) and circumferential strain (Ecc) curves for the six sectors of the basal, mid and apex regions.(b) Navy blue, sect1; red, sect2; green, sect3; purple, sect4; sky blue, sect5; orange, sect6.
SUBJECT3 showed even more abnormal circumferential shortenings and radial thickenings (figure 8, bottom panel). None of the 18 sectors shortened by more than 8 per cent, thus indicating very poor contraction of the myocardium. Maximal thickening values ranged from 5 to 38 per cent, from 0 to 38 per cent and from 3 to 50 per cent in the basal, mid and apical sectors, respectively. Moreover, two sectors in the mid and apical regions experienced thinning. Apical and basal maximal systolic rotations and maximal torsion were 1.7°, −0.7° and 2.1°, respectively (figure 9, mid panel).
For each of the three subjects, the computation of strains, rotation angles and torsion required about 60 min on a standard desktop PC with single CPU (Intel core2@1.86 Ghz).
4. Discussion
In this paper, we presented a new tool for LV analysis from CMR imaging, characterized by two novel aspects when compared with previous approaches [22].
The former consists in the automation of a relevant part of the procedure needed to recognize endocardial and epicardial contours.
The latter consists in the calculation of myocardial local strains through a Lagrangian approach, i.e. by actually tracking different portions of the myocardium in space throughout its deformation process.
In this study, on a small population of subjects, we tested the features of the software that allows for LV endo- and epicardial borders detection for volumetric and WM analysis. Moreover, we tested the capability to correctly compute local LV wall strains on a virtual phantom and applied it to three LVs characterized by different clinical scenarios.
4.1. Automated detection of contours for analysis of volumetric and wall motion analysis
CMR imaging provides accurate measurements of LV volumes, EF and mass, nevertheless, the quantification of volumes is based on time-consuming manual tracing of endocardial and epicardial boundaries in multiple slices. The subjective nature of this procedure limits the reproducibility of volume measurements and consequently of the set of derived parameters. The proposed combined automated endocardial and epicardial border detection procedure overcomes these limitations by allowing manual intervention just to optimize the automated detected contours. Despite this advantage, the proposed approach was not completely reliable in several LV basal slices, owing to the presence of the aorta. In this case, manual tracing was performed in order to provide a reliable contour. The technique could be easily applied to all frames in the cardiac cycle, on a different number of slices of fixed thickness for each frame.
4.2. Analysis of left ventricle strains and torsion
For validation purposes, we first applied our method for strain estimation on a simplified virtual phantom. The computed strain curves well agreed with the ones yielded by a commercial finite-element solver throughout the whole cardiac cycle, confirming that our method fulfils the minimum requirement of being accurate in presence of simple motion patterns. The application of the method on three real subjects showed its capability to capture more complex motion and strain patterns.
In the healthy subject, physiologically meaningful strain curves were found: consistently with previous findings [23,24] almost uniform circumferential shortening and increasing thickening were assessed from LV base to apex. Moreover, LV torsion was consistent with data from tagged MRI and Doppler tissue imaging [25], both in terms of time-course and maximal values.
In the ischaemic patients, we found a decrease in peak systolic circumferential and radial strains, in agreement with the expected loss of contraction properties following infarction, as well as in peak systolic torsion, consistently with previous findings [26]. Moreover, regional inhomogeneity and dyssynchrony of the strain pattern were detected. These abnormalities were more evident in SUBJECT3, consistently with his much lower EF.
Thus, in these preliminary tests, the calculation of rotations, LV torsion and local strains based on nearest neighbour search appeared able to provide realistic results.
However, the method suffers from some limitations. First, even though the metrics adopted in the nearest neighbour algorithm include a term aimed at enforcing the return of the tracked points to their initial position, computed time-dependent strains showed residual values around 5 per cent at the end of the cardiac cycle. This issue is reported also in other recent studies [27]; possible causes include the natural aperiodicity of LV deformation owing to heart-rate variability, and the inherent limitations of CMR acquisitions.
Second, in order to compute strains within each of the 18 LV wall sectors, we treated each of them as a first-order isoparametric hexahedral element. However, it does not allow for capturing the non-negligible curvature of the endocardial and epicardial surfaces of the sectors. To this aim, we plan to move to the use of higher order elements.
5. Conclusions
In the reported preliminary testing, the FAT tool resulted effective in computing LV volumes, myocardial strains and torsion from conventional cine short-axis CMR images. Obtained results were in agreement with manual ground truth values, and with reported literature. Although not fully automated, our method required minimal user interaction, thus improving repeatability. FAT capability in capturing regional functional features may be of use in the interpretation of the remodelling process following myocardial infarction; this information could be useful in the clinical decision-making process and potentially used as input for patient-specific LV modelling tools.
Acknowledgements
The research leading to these results has received funding from the European Community's Seventh Framework Programme (FP7/2007-2013) under Grant agreement no. 224635.
Footnotes
One contribution of 17 to a Theme Issue ‘The virtual physiological human’.
References
- 1.Hertz M. I., et al. 2008. Registry of the international society for heart and lung transplantation: a quarter century of thoracic transplantation. J. Heart Lung Transplant 27, 937–942 10.1016/j.healun.2008.07.019 (doi:10.1016/j.healun.2008.07.019) [DOI] [PubMed] [Google Scholar]
- 2.Sutton M. G., Sharpe N. 2000. Left ventricular remodelling after myocardial infarction: pathophysiology and therapy. Circulation 101, 2981–2988 [DOI] [PubMed] [Google Scholar]
- 3.Hundley W. G., Meshack B. M., Willett D. L., Sayad D. E., Lange R. A., Williard J. E., Landau C., Hillis L. D., Peshock R. M. 1996. Comparison of quantitation of left ventricular volume, ejection fraction, and cardiac output in patients with atrial fibrillation by cine magnetic resonance imaging versus invasive measurements. Am. J. Cardiol. 78, 1119–1123 [DOI] [PubMed] [Google Scholar]
- 4.Nagel E., Schneider U., Schalla S., Ibrahim T., Schnackenburg B., Bornstedt A., Klein C., Lehmkuhl H. B., Fleck E. 2000. Magnetic resonance real-time imaging for the evaluation of left ventricular function. J. Cardiovasc. Magn. Reson. 2, 7–14 [DOI] [PubMed] [Google Scholar]
- 5.Frangi A. F., Niessen W. J., Viergever M. A. 2001. Three-dimensional modeling for functional analysis of cardiac images: a review. IEEE Trans. Med. Imaging 20, 2–25 10.1109/42.906421 (doi:10.1109/42.906421) [DOI] [PubMed] [Google Scholar]
- 6.Uzumcu M., van der Geest R. J., Swingen C., Reiber J. H., Lelieveldt B. P. 2006. Time continuous tracking and segmentation of cardiovascular magnetic resonance images using multidimensional dynamic programming. Invest. Radiol. 41, 52–62 10.1097/01.rli.0000194070.88432.24 (doi:10.1097/01.rli.0000194070.88432.24) [DOI] [PubMed] [Google Scholar]
- 7.Angelie E., de Koning P. J., Danilouchkine M. G., van Assen H. C., Koning G., van der Geest R. J., Reiber J. H. 2005. Optimizing the automatic segmentation of the left ventricle in magnetic resonance images. Med. Phys. 32, 369–375 [DOI] [PubMed] [Google Scholar]
- 8.Osman N. F., Kerwin W. S., McVeigh E. R., Prince J. L. 1999. Cardiac motion tracking using CINE harmonic phase (HARP) magnetic resonance imaging. Magn. Reson. Med. 42, 1048–1060 (doi:10.1002/(SICI)1522-2594(199912)42:6<1048::AID-MRM9>3.0.CO;2-M) [DOI] [PMC free article] [PubMed] [Google Scholar]
- 9.O'Dell W. G., Moore C. C., Hunter W. C., Zerhouni E. A., McVeigh E. R. 1995. Three dimensional myocardial deformations: calculation with displacement field fitting to tagged MR images. Radiology 195, 829–835 [DOI] [PMC free article] [PubMed] [Google Scholar]
- 10.Pan L., Prince J. L., Lima J. A., Osman N. F. 2005. Fast tracking of cardiac motion using 3D-HARP. IEEE Trans. Bio. Med. Eng. 52, 1425–1435 10.1109/TBME.2005.851490 (doi:10.1109/TBME.2005.851490) [DOI] [PubMed] [Google Scholar]
- 11.Young A. A. 1999. Model tags: direct three-dimensional tracking of heart wall motion from tagged magnetic resonance images. Med. Image Anal. 3, 361–372 10.1016/S1361-8415(99)80029-2 (doi:10.1016/S1361-8415(99)80029-2) [DOI] [PubMed] [Google Scholar]
- 12.Ryf S., Spiegel M. A., Gerber M., Boesiger P. 2002. Myocardial tagging with 3DCSPAMM. J. Magn. Reson. Imaging 16, 320–325 10.1002/jmri.10145 (doi:10.1002/jmri.10145) [DOI] [PubMed] [Google Scholar]
- 13.Chan T. F., Vese L. A. 2001. Active contours without edges. IEEE Trans. Image Proc. 10, 266–277 10.1109/83.902291 (doi:10.1109/83.902291) [DOI] [PubMed] [Google Scholar]
- 14.Bovik A. C. 1988. On detecting edges in speckle imagery. IEEE Trans. Acous. Speech Signal Proc. 36, 1618–1627 10.1109/29.7550 (doi:10.1109/29.7550) [DOI] [Google Scholar]
- 15.Azzalini A. 1996. Statistical inference-based on the likelihood. London, UK: Chapman and Hall [Google Scholar]
- 16.Chesnaud C., Refregier P., Boulet V. 1999. Statistical region snake-based segmentation adapted to different physical noise models. IEEE Trans. PAMI 21, 1145–1157 10.1109/34.809108 (doi:10.1109/34.809108) [DOI] [Google Scholar]
- 17.Sarti A., Corsi C., Mazzini E., Lamberti C. 2005. Maximum likelihood segmentation of ultrasound images with Rayleigh distribution. IEEE Trans. Ultrason. Ferroelectr. Freq. Control 52, 947–960 10.1109/TUFFC.2005.1504017 (doi:10.1109/TUFFC.2005.1504017) [DOI] [PubMed] [Google Scholar]
- 18.Sethian J. A. 1996. Level set methods: evolving interface in geometry fluid mechanics, computer vision and materials science. Cambridge, UK: Cambridge University Press [Google Scholar]
- 19.Perona P., Malik J. 1990. Scale-space and edge detection using anisotropic diffusion. IEEE Trans. PAMI 12, 629–639 10.1109/34.56205 (doi:10.1109/34.56205) [DOI] [Google Scholar]
- 20.Lin X., McFarlane N. J. B., Zhao Y., Clapworthy G. J., Dong F., Raedelli A. 2010. Visualisation of Left Ventricular Dysfunction In The Virtual Pathological Heart Proc. 7th Int. Conf. on Biomedical visualization, Medivis10, 14th Int. Conf on Information Visualisation, IV10, 27–29 July 2010, London, UK, pp. 635–640 [Google Scholar]
- 21.Vieira M., Shimada K. 2005. Surface mesh segmentation and smooth surface extraction through region growing. Comput. Aided Geom. Design 22, 771–792 10.1016/j.cagd.2005.03.006 (doi:10.1016/j.cagd.2005.03.006) [DOI] [Google Scholar]
- 22.Kennel N. G., Pennell D. J. 2007. CMR of ventricular function. Echocardiography 24, 185–193 [DOI] [PubMed] [Google Scholar]
- 23.Zhong L., Su Y., Yeo S., Tan R., Ghista D. N., Kassab G. 2009. Left ventricular regional wall curvedness and wall stress in patients with ischemic dilated cardiomyopathy. Am. J. Physiol. Heart Circ. Physiol. 296, H573–H584 10.1152/ajpheart.00525.2008 (doi:10.1152/ajpheart.00525.2008) [DOI] [PMC free article] [PubMed] [Google Scholar]
- 24.Edvardsen T., Gerber B. L., Garot J., Bluemke D. A., Lima J. A. C., Smiseth O. A. 2002. Quantitative assessment of intrinsic regional myocardial deformation by Doppler strain rate echocardiography in Humans: validation against three-dimensional tagged magnetic resonance imaging. Circulation 106, 50–56 10.1161/01.CIR.0000019907.77526.75 (doi:10.1161/01.CIR.0000019907.77526.75) [DOI] [PubMed] [Google Scholar]
- 25.Notomi Y., et al. 2005. Assessment of left ventricular torsional deformation by doppler tissue imaging. Validation Study Tagged Magn. Reson. Imaging Circ. 111, 1141–1147 10.1161/01.CIR.0000157151.10971.98 (doi:10.1161/01.CIR.0000157151.10971.98) [DOI] [PubMed] [Google Scholar]
- 26.Rüssel I. K., Götte M. J. W., Bronzwaer J. G., Knaapen P., Paulus W. J., van Rossum A. C. 2009. Left ventricular torsion: an expanding role in the analysis of myocardial dysfunction. J. Am. Coll. Cardiol. Img. 2, 648–655 [DOI] [PubMed] [Google Scholar]
- 27.De Craene M., et al. 2010. Temporal diffeomorphic free-form deformation for strain quantification in 3D-US images Med Image. Comput. Comput. Assist. Interv. 13, 1–8 [DOI] [PubMed] [Google Scholar]


