Abstract
The aim of this work is to introduce the general concept of ‘Bond Graph’ (BG) techniques applied in the context of multi-physics and multi-scale processes. BG modelling has a natural place in these developments. BGs are inherently coherent as the relationships defined between the ‘elements’ of the graph are strictly defined by causality rules and power (energy) conservation. BGs clearly show how power flows between components of the systems they represent. The ‘effort’ and ‘flow’ variables enable bidirectional information flow in the BG model. When the power level of a system is low, BGs degenerate into signal flow graphs in which information is mainly one-dimensional and power is minimal, i.e. they find a natural limitation when dealing with populations of individuals or purely kinetic models, as the concept of energy conservation in these systems is no longer relevant. The aim of this work is twofold: on the one hand, we will introduce the general concept of BG techniques applied in the context of multi-science and multi-scale models and, on the other hand, we will highlight some of the most promising features in the BG methodology by comparing with examples developed using well-established modelling techniques/software that could suggest developments or refinements to the current state-of-the-art tools, by providing a consistent framework from a structural and energetic point of view.
Keywords: multi-scale, computational biology, systems biology, biomechanics
1. Introduction
Computational models in integrative physiology present a particular challenge in that they require both a multi-scale and a multi-science approach. This inherent complexity is well recognized; biological systems encompass a wide range of temporal and spatial scales and involve ‘knowledge’ in a wide range of disciplines and ‘bridges’ to produce a coherent, albeit disparate in many cases, model. While the importance of multi-scale modelling in this context is increasingly recognized, there is little underpinning literature on the methodology and generic description of the processes involved [1,2], while some initiatives (www.complex-automata.org/) have addressed this by developing a multi-scale, multi-science framework.
The aim of this work is twofold: on the one hand, we will introduce the general concept ‘Bond Graph’ (BG) techniques applied in this context and, on the other hand, we will highlight some of the most promising features in the BG methodology by comparing with examples developed using well-established modelling techniques/software that could suggest developments or refinements to the current state-of-the-art tools, by providing a consistent framework from a structural and energetic point of view. BGs are inherently coherent as the relationships defined between the ‘elements’ of the graph are strictly defined by causality rules and power (energy) conservation. BGs clearly show how power flows between components of the systems they represent. The ‘effort’ and ‘flow’ variables enable bidirectional information flow in the BG model. When the power level of a system is low, BGs degenerate into signal flow graphs in which information is mainly one-dimensional and power is minimal, i.e. they find a natural limitation when dealing with populations of individuals or purely kinetic models, as the concept of energy conservation in these systems is no longer relevant. Also, many system models do not use power variables and yet can be represented usefully as ‘pseudo BGs’. Pseudo BGs have been used particularly for open systems in which it is convenient to consider control volumes or compartments with boundaries across which mass can flow, which is a usual approach in physiological systems. It could be claimed that these ‘pseudo BGs’ are not much more than sophisticated block diagrams. There is some truth in this, but for many systems, quite a lot of structure can be exhibited in BGs, which is not evident in other diagrams or which can be shown only in a clumsy way [3]. Also, the BGs exhibit causal information and sign conventions and allow the substitution of alternative submodels in an orderly way. Thus, it seems worthwhile to use pseudo BGs for system models in which the most convenient form of description precludes the use of true BGs.
Biological systems are usually described in terms of a large number of chemical reactions coupled with diffusion, transport, mechanical processes, etc. The formalization presented in this paper by using BG language is well suited to this purpose. Very importantly, the topology of the BG not only reflects the natural structure of the system under study but also, coupling of several energy domains may be treated rigorously; compartmentalization and extension of the model are relatively simple and the formulation [4] in terms of equations for a simulation programme and their debugging of physical inconsistencies are orderly done by using well-defined algorithms [4,5]; in fact, BGs are energetically coherent and they find a natural development field in multi-science applications.
One difficulty in multi-scale models is to create bridges between the different scales. Epistemologically speaking, BGs are a powerful tool to suggest new approaches, which may lead to innovative modelling ideas, difficult to reach by using other methods [6]. Although producing a comprehensive view of the potentialities of BG models in a reduced and contained form is a challenge, we hope to show that BGs have just the right high level for multi-scale and energy-based biological models.
2. Brief introduction to the fundamentals of bond graph modelling
The objective of this section is to present a brief overview of BG modelling, for which there is widely available literature. The reader is referred to Gawthrop & Smith [7] or Karnopp et al. [8] for details.
2.1. Causality
The relationships defined between the ‘elements’ of the BG are strictly defined by causality rules and power (energy) conservation. Information is exchanged via the ‘ports’ in each element as shown in figure 1.
Figure 1.
Bond graphs as a port-based modelling approach. Ports are indicated in the figure with thick black dots.
A vital concept in BG is the causality. In each bond of a BG there are two associated variables; thus, in each node, the modeller must indicate how these variables will be related. This is graphically represented using a ‘causal stroke’ in the bonds (figure 2). This stroke indicates the direction of the flow (akin to the electrical current, volumetric flow, velocity, etc.) and effort (pressure, force, electric potential, etc.) variables in the bond, i.e. the stroke is related to the effort and the ‘open end’ is related to the flow.
Figure 2.
(a) Causality (stroke) in a bond between two elements. (b) The same relationship between elements using the equivalent of block diagrams.
These causality relationships could help to translate any BG model into a block diagram (and vice versa). Figure 3 shows a very simple example where this translation process can be seen. It also shows how the graphical structure of the BG is simpler than the block diagram model of the same system, thus avoiding the ‘spaghetti syndrome’. Previous works have shown that this simplified structure and the use of the causality concept can help in the analysis of multi-time scale systems [9].
Figure 3.
From bond graphs to block diagram: (a) shows a ‘word bond graph’, i.e. a representation of the model in lay terms, with the main processes interconnected. (b) BG model. (c) Port-based approach of the model with arrows indicating the information going in and out of each element. (d) Expansion of the nodes to blocks, following (e) a block diagram.
2.2. Elements
Nodes or elements in BGs represent basic behaviours. There are nine basic behaviours associated with five physical phenomena: (i) supply and demand; (ii) reversible transformations (e.g. interdomain connections); (iii) distribution (intradomain connections); (iv) irreversible transformations; and (v) accumulation.
The usual analogy of this port-based approach is the modelling of electrical circuits where capacitances and inductances are related to energy accumulation, resistances are related to energy dissipation, and sources and transformers represent, respectively, inputs and energy transformations. In the classical BG approach, the nine basic elements used are shown in table 1.
Table 1.
Classic representation of BG elements.
| effect | elements | no. of ports |
|---|---|---|
| accumulation | C, I | 1 |
| sources | Se, Sf | 1 |
| energy transformations | transformers (TF), gyrators (GY) | 2 |
| resistance or dissipation | resistance (R) | 1 |
| parallel and series connection | 0-junction (parallel), 1-junction (series) | infinite |
This classical representation of BG elements can be extended to multi-port elements. Multi-port elements obey the same fundamental rules than the 1-port elements but they include the effect of several variables. Multi-port elements typically appear in biology and physiology when dealing with chemical reactions (as they involve different states) and systems described by partial differential equations (convection–diffusion equations, for example). They will also typically appear in multi-scale systems. For a detailed description of BG elements, please see the BGs references suggested at the beginning of this section. The equations calculating ‘effort’ and ‘flow’ variables in BGs are usually presented in integral form.
The next sections will present clear examples of physiologically based models using BGs as well as a contrast with different available software and the model representations that these software will produce. We hope to present a convincing case of the need of a better and coherent representation of systems as this will prove fundamentally important for interoperability issues.
3. An example of bond graphs in physiology: chemomechanical transduction in the cardiac muscle
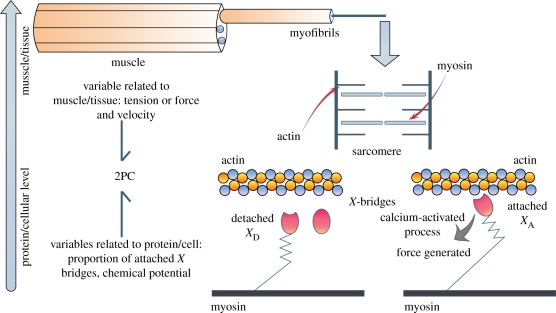
A fine example of a multi-scale process in biology is provided by the chemo-mechanical transduction in muscle. A theory of muscle contraction on the interaction of two types of protein chains [10] proposes that the actin and myosin filaments present in the cardiac muscle (figure 4) do not shorten when the muscle contracts, but slide longitudinally along each other and develop a force between them owing to ‘cross-bridges’ (also called X-bridges) located in the myosin filament and which attach (chemical reaction from the detached state to the attached one) to specific sites on the actin filament when these sites are activated by a calcium-based process. During contraction, the detached cross-bridges use the energy provided by a supply of ATP to attach to the actin filament. After attachment, the bridges can shorten and/or exert force and then they detach and the cycle begins again. The extensions of these attachments are different in more sophisticated models. During the attachment phase, the muscle contracts and the ‘cross bridges’ detach progressively to finally reach the relaxation phase (most of the bridges are detached) following a cyclic behaviour. The sliding mechanisms of the cross bridges (from now on we will call them X-bridges) produce a force that is extended to the whole cardiac chamber. This force will act on the blood mass contained in the ventricle, creating the pressure necessary to eject the volume of blood to the arterial and venous network.
Figure 4.
In the cardiac muscle, the basic unit is called a ‘sarcomere’. It is mainly composed of two protein chains: actin and myosin (see lower-middle panel). Protrusions called bridges, originating from the myosin filament and previously activated by an ATP molecule, will attach to the actin chain. These bridges will then behave like springs exerting a force that will make actin and myosin slide on each other, producing cardiac contraction. This action is repeated cyclically during a heart beat by hundreds and thousands of attachments and detachments (note: a single bridge attaches and detaches several times during a beat and consumes one ATP per attachment). This is called the ‘cross bridges cycle’. The contractile protein mechanisms, represented by a 2PC: two ‘ports’ connect to two different domains and scales, chemical and mechanical. The energy storage/conversion will be achieved with a coherent set of equations.
It is important to notice that physically, there is a real coupling between the chemical and mechanical variables in the model, owing to the chemo-mechanical transduction: the chemical reaction of attachment of a bridge creates an elastic potential energy and a mechanical movement of the bridge changes the shape of the attachment site and thus its chemical reactivity. This fact is important in terms of energy coherence, and such a coupling needs to be expressed clearly in the model.
For this example, we will keep it as simple as possible, with all bridges attaching with the same extension. Millions of bridges go through that cycle somewhat asynchronously and several times per beat.
3.1. Protein/cell level—chemical reaction
To represent the chemical reaction from the detached state (XD) to the attached one (XA) and vice-versa we will use the simplest chemical model available:
| 3.1 |
where ka and kd are periodically varying kinetic constants of attachment and detachment. As a first heuristic approximation, chemical potentials (μ) will be given by the modified Nernst formula
| 3.2 |
and
| 3.3 |
These equations need some justification. They are valid in idealized conditions (diluted solutions, ideal mixing, large volumes, non-compartmentalization), which are certainly unverified here. They are only used as a first approximation and we consider that they are enough for the purpose of this paper.
In equation (3.2), the chemical potential is a function (β) of lm, the length of the muscle fibres, the number of attached and detached bridges (XA, XD) and chemical constants (AA, BA). The only non-classical feature of these equations is the b factor of equation (3.2). Nevertheless, it appears explicitly in the derivation of the equations of the chemo-mechanical coupling developed in the study of Díaz-Zuccarini [11] and LeFèvre et al. [6]. For a more detailed explanation, the reader is referred to Díaz-Zuccarini & LeFèvre [12].
Using the usual expression of the reaction rate in chemical thermodynamics, the reaction flow may be expressed as
| 3.4 |
which can be reduced to
| 3.5 |
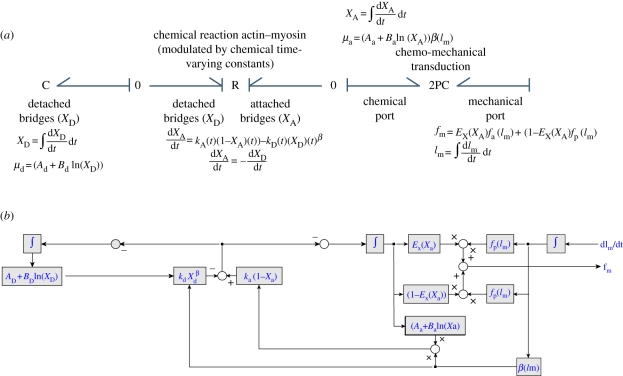
It is important to notice that in reality, these kinetic reactions are strongly influenced by the calcium mechanisms in the cardiac cells. A more detailed model for such processes is necessary for more accurate models on the chemical side. A chemical reaction in BG is represented with an ‘R’ element. In this case, this R element will be modulated and nonlinear (figure 5).
Figure 5.
(a) BG model of the chemo-mechanical transduction and the constitutive equations for each element. The chemical reaction element (R) has two ports that exchange information on the detached bridges and the attached bridges. Equally, the 2PC has two ports and this is truly multi-scale: this element converts chemical energy (left side port) to mechanical energy (right-hand port). For consistency, additional ports for heat exchange could be added to the R, in case thermal aspects are considered. (b) The equivalent block diagram. This only shows the equations from one block to the next. The bidirectional nature of the chemo-mechanical transduction process is not clearly shown in this case. The direct identification of processes (that is one characteristic of BGs and particularly useful for multi-scale cases) is not necessarily straightforward.
3.2. From the protein/cell level to the muscle/tissue level: chemo-mechanical transduction, the 2PC
The chemo-mechanical transduction will be achieved in the BG model by a double-port capacitor (2PC element) shown in figures 4 and 5. We will see in the equations presented below that the mechanical force will be a function of the chemical variables too. Capacitive N-ports with various energy domains that might span different scales are one of the most useful and unique features of BGs, as they allow a consistent approach to reversible transduction with energy storage. The 2PC relates the chemical and mechanical aspects of the model. One port will be ‘chemical’, i.e. it will exchange information related to the protein contraction mechanisms, while the other port will be ‘mechanical’, i.e. it will link the cellular/protein model with the higher muscle/tissue level (figure 4). This type of energy transduction is very uncommon in engineering but is common in biology. This process is easier to model with BGs than with other modelling techniques as multi-energy C-elements are classical BG features. The originality of the 2PC relies on its equations, which will be presented below (for a detailed description of the derivation of these equations, the reader is referred to [11,12]).
A single muscle equivalent to all the muscles of the heart is considered. Its length is lm and XA is the number of attached cross bridges (X-bridges, as shown in figure 4). Neglecting the energy in free cross bridges, the energy (E) of the muscle is given by
| 3.6 |
Then, the mechanical power will be calculated as follows:
| 3.7 |
where fm is the force in the cardiac muscle, vm is the velocity, μA is the chemical potential and  is the rate of change of attached X-bridges.
To simulate the 2PC, Em must be chosen (i.e. formulated) in order to obtain the equations for fm and μa. Complete details of this formulation may be found in the study of Díaz-Zuccarini & LeFèvre [12]. For this paper, only the final equation for the mechanical force in terms of chemical and mechanical variables will be presented
| 3.8 |
In this case, the muscular force developed by the muscle fibres will be a function of EX, which is the state function representing the muscle activation (it changes periodically and varies between 0 and 1). The derivation of this equation and equation (3.8) is presented in detail in the study of Díaz-Zuccarini [11] and Díaz-Zuccarini & LeFèvre [12]. E′act and E′pas are calculated as follows:
 |
3.9 |
and
 |
3.10 |
The sub-indices ‘act’ and ‘pas’ mean ‘active’ and ‘passive’ state (as typically referred to in a pressure volume diagram of the ventricle), so, they calculate the ‘active’ and ‘passive’ forces in the cardiac muscle. They will be denoted as fa and fp
| 3.11 |
and
| 3.12 |
where lo is the resting length of the muscle. It is important to notice that the polynomial expression of equations (3.11) and (3.12) has been obtained by simple inspection, by contrasting with experimental results obtained from the classic literature in cardiac experiments. A polynomial relationship was deemed good enough for our purposes and it provided a simple relationship that can be manipulated easily and would not lead to any numerical complications.
Finally, figure 5 shows the BG model (and block diagram equivalent) of the chemo-mechanical transduction and the constitutive equations that describe the different processes involved.
Some characteristics of this model are worth discussing.
— The two-port R represents the reaction mechanism between the actin and myosin proteins. This is the only element introducing both an apparent mechanical viscosity and a true heat generation in our model. Apparent viscosity will result if, as it seems to be the case in reality, kA and kD are functions not only of time but also of muscle velocity, thus introducing a kinetic (i.e. non-heat generating) velocity dependence of the force generated in the mechanical port of the 2PC (right-hand side, figure 5).
— By adding the necessary entropy of heat equation to the R element, we could also describe true heat generation (that the model currently ignores) and this would add a third port (thermal) to the R element. As described in this paper, the model does not explicitly represent the ATPase effect on the actin–myosin mechanism but a more sophisticated mechanism could be added separately in this model. As presented here, ATP is in excess. The full reaction would be AMfree + nATP → AMattached + nADP. Capacitors might as well be attached to the respective side of the reaction for ATP and ADP.
— Both XA and XD are represented by C-elements. As seen above, XA is not an independent element but the chemical port of the 2PC.
— The 2PC element may be simple or have an internal structure made of many elements. In this case, we will take the simplest possible hypothesis and we will consider it as a 2-port element of one single level (no sub-structures). As the contraction of the actin–myosin produces force in the cardiac muscle, seen from the ventricular side (right-hand side in figure 5), this element must provide elastic potential energy and thus behave as a variable spring ‘X’, i.e. a C-element (variables: lm, dlm/dt, fm). On the other side (left-hand side in figure 5), it must receive and store a concentration of attached cross-bridges coming from the model of the cross-bridges cycle. In BGs, a storage of chemicals is also a C-element (variables: XA attached cross-bridges, dXA/dt reaction speed and μa potential).
3.3. Simulation results
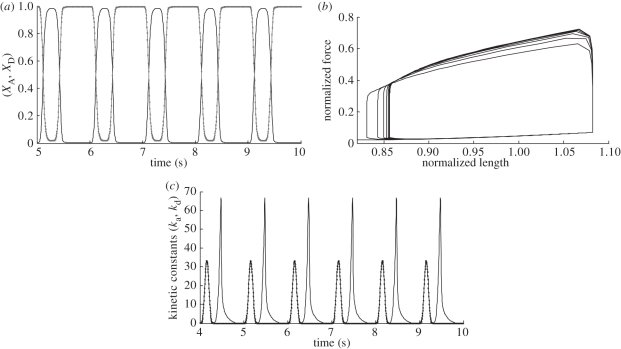
Some simulation results of the model represented by figure 5 are briefly presented in this section for illustration purposes only (figure 6).
Figure 6.
Simulation results of the model (illustration purposes only). (a) Variation of the attached (XA) and detached (XD) cross-bridges with time. (b) Force–length relationship. (c) Kinetic periodic constants (ka, kd).
Simulations were performed by using physiological boundary conditions at the macroscopic level. The model presented in figure 5 is a sub-model of a multi-scale model of cardiac dynamics from the cell to the organ, hence the last biological scale is the organ level, in which the model of the left ventricle has been connected to a 2-element windkessel model. The model is coupled from the sub-cellular to the physiological level and the bidirectional relationships at all levels between efforts and flows ensure consistency. The model has been simulated in Fortran, post-processed in Matlab and the solution of the differential equations has been achieved by implementing a simple Euler method. It is worth noticing that the equations shown are all energetically coherent. The authors believe that multi-scale models present a challenge in this sense as the multiple modulations and changes of domain that will be required when using other approaches might introduce energy inconsistencies. Since the BGs are firmly rooted on power conservation, all the equations must obey fundamental energy conservation laws. This last aspect of BGs will lead us to the following sections of this paper, in which the structures of models in computational physiology/biology, their coherence and ontologies are briefly discussed.
4. Appropriate systems modelling and ontological representation and annotation
Most systems biology software are user-friendly; great effort has gone into making these software intuitive and easy to work with, which is in part responsible for their appeal to the biological modelling community. Also, a considerable effort from the Systems Biology community has been focused on the standardization of mathematical models and annotation [13], a welcomed development that enables and encourages further versatility in the implementation of such models. However, these software make use of condensed forms of representation that do not necessarily show all the processes taking place in the models. The standard languages to develop dynamical models of biological/physiological systems (e.g. SBML) use defined structures in which the user is limited to describe the model using compartments, species and reactions and where additional relationships between variables are described as ‘events’ (related to discrete changes in a variable because of changes in another variable) and ‘rules’ to describe algebraic relationships between variables.
The use of rules and events is not graphically represented in Systems Biology software. This feature becomes automatically a hindrance, because on the one hand, the cause–effect relationship might be lost and on the other hand, there is no classification for the rules; they are used in the model as tools, but in fact, for consistency, they should be related to specific (biological) mechanisms that are important in the system.
A positive aspect of the BG methodology is that these ‘algebraic rules’ are always related to specific elements in the model. The best examples for these relationships are given by resistive (‘R’) elements and transformer (‘TF’) elements. The use of these elements in a model, typically represent two types of mechanisms: R elements are related to dissipative processes and TF elements are related to energy transformation processes (or changes from one domain to another domain). From this perspective, a BG approach is properly aligned with a better description of a biological system; the conventional ‘algebraic rules’ will be associated to physiological/biological processes such as clearance, degradation or even the transformation of domain (or scale) in a multi-scale/multidomain model.
In §4.1, some illustrations or examples of processes developed in BGs will be compared with other modelling methodologies developed for the current software in systems biology/physiology. In §4.2, a brief discussion on the shortcomings of BGs will be presented.
4.1. Examples
4.1.1. Chemical reaction in a volume
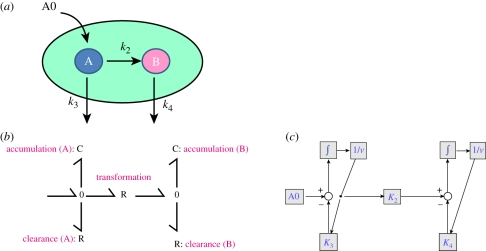
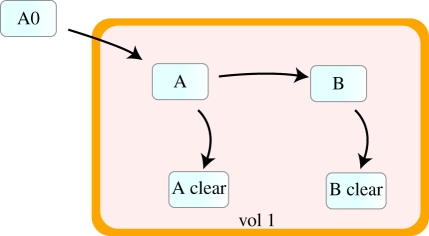
Figure 7 describes a generic volume (that might represent the volume of a cell for example) where there is an input (e.g. a ‘dose’) of A (called A0), a chemical reaction between two chemical species A and B and two processes of degradation (or clearance) for A and B.
Figure 7.
(a) Representation of a biological process. Chemical reaction between two chemical species (A, B), as described in the text. (b) BG representation of that process. An element R calculates the chemical reaction between A and B. Clearance is also described by R elements, while the accumulation of A and B is represented by C elements (storage of mass/energy). The equivalent block diagram model is shown in the (c). In this case, a similar graphical structure is obtained for this simple model. It could be argued that in this case, BGs do not offer any real advantage; however, BG models are much more structured and lumped effects are represented with a limited number of elements (R, C, I, etc.), which is a distinctive asset when dealing with the ontological annotation of systems.
One of the pros of the BG representation in figure 7 is that it corresponds with the representation of the system element by element: all the processes are described in both the diagram and the BG. Each element and each bond (half arrows) are related to specific mechanisms in the system. A rather obvious drawback is that it might be difficult for a modeller to ‘think’ of the chemical species as capacitances (C elements in the diagram) as they will store energy and/or mass. The formal aspects of BGs and the structured framework are sometimes perceived as unnecessary. However, this representation is consistent in all BG models and forces homogeneity.
Figure 8 provides another representation of the same system. If we implement the same model in other available software, such as JDesigner (http://www.sys-bio.org/software/jdesigner.htm) for example (just as a matter of illustration as this might occur in other software), we obtain as shown in figure 8.
Figure 8.
Chemical reaction between two chemical species (A, B). Model implemented in JDesigner.
The model shown in figure 8 consists of three species (and reactions) which must be created to represent clearance and the dose. There are very positive aspects worth highlighting in this representation, for example the model is based on a classical representation of biochemical networks which is more familiar to most life-science modellers and has the advantage of explicitly representing the paths of material flows. However, there are also some disadvantages: the dose and the clearance are represented as ‘chemical’ reactions, which do not correspond to the physical process that is taking place. Additionally, we increase the size of the model by adding three new chemical species that must appear in order to add these additional processes. There is a mismatch between the system and the model that impact its consistency.
As a matter of fact, there are several options to incorporate the source and the clearance in figure 8:
To use ‘rules’ for each of these processes (that will not appear in the diagram).
To add these flows as part of the kinetic rate of the ‘Reaction’ (again, not shown in the diagram)
Important issues that warrant attention in integrative physiology are the standardization, homogeneity and consistency of coupling models of different nature. When processes are hidden, unclear or do not appear in the model, this creates problems for a proper ontological representation of the system. If processes are not properly and clearly represented, the ontological annotation will be misleading. If processes that are not shown in the model (for example by using (a) or (b)) were somehow annotated properly, they would be invisible in the graphical representation of the system. In any case, the information can be misleading, incomplete or both.
4.1.2. Physiological-based pharmacokinetics model of human anaesthetic drug uptake
A more relevant example for the virtual physiological human is the development of a physiological-based pharmacokinetics (PBPK) model of human anaesthic drug uptake. Some of the bases of this example were proposed by Mapleson et al. [14,15] and Davis & Mapleson [16]. A first approximation to model the physiology of this problem was using analogies with electrical circuits [14]. Gawthrop & Smith [7] used this model as a starting point to develop the BGs models shown in this section. The use of BGs showed relevant advantages from a modelling perspective, as the graphical models obtained are a better description of the physiological processes involved in different compartments (e.g. organs) and the causal relationship between different variables is represented explicitly in the graph.
4.1.2.1. A simple pharmacokinetic model
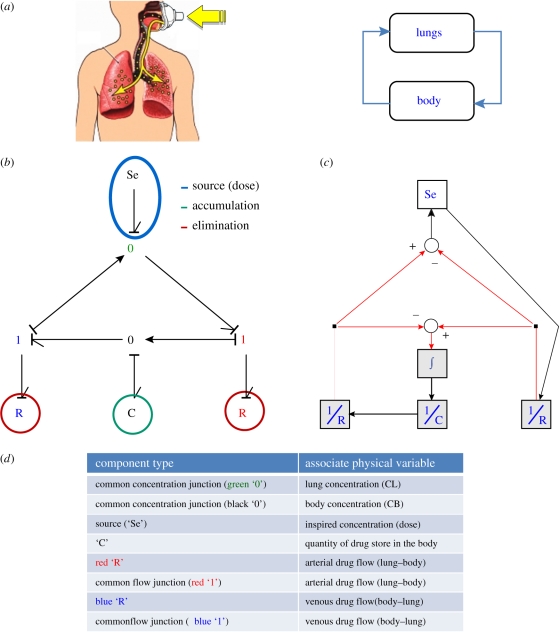
Figure 9 shows a simple diagram to model this complex process. The model is composed of two compartments, one for the lungs and one for the rest of the body. From the simple graphical representation in figure 9a, it is only possible to know that the two compartments are connected and that drug will be in a loop between the compartments; however, there is no information about specific physical (or physiological) processes or how the variables in the model are related.
Figure 9.
Simple pool model of human anaesthetic uptake and the equivalent BG model and block diagrams. An advantage of using a highly structured modelling tool (e.g. BGs) is the possibility to extend any model by including new elements associated to specific physical processes or mechanisms. Taking the same example of anaesthetic drug uptake, a BG model can be built by considering similar processes described in figure 9 but for each organ in a multi-compartmental PBPK model (figure 10). In this case, all the mechanisms considered in the model and the causal relationships are expressed in the graphical model.
Figure 9b shows the BG model for this system. In this case, each element in the graphical model is related to a different process (e.g. dose, accumulation of the drug, clearance) and the user can infer the causal relationships between the variables from the model. Owing to the simplicity of this particular model it is possible to generate a very similar representation using block diagrams figure 9c. However, the cause–effect relationships and the use of both variables (concentration and mass flow) could cause some confusion for the user trying to understand the physical mechanisms controlling the drug concentration and the mass flows in the compartments.
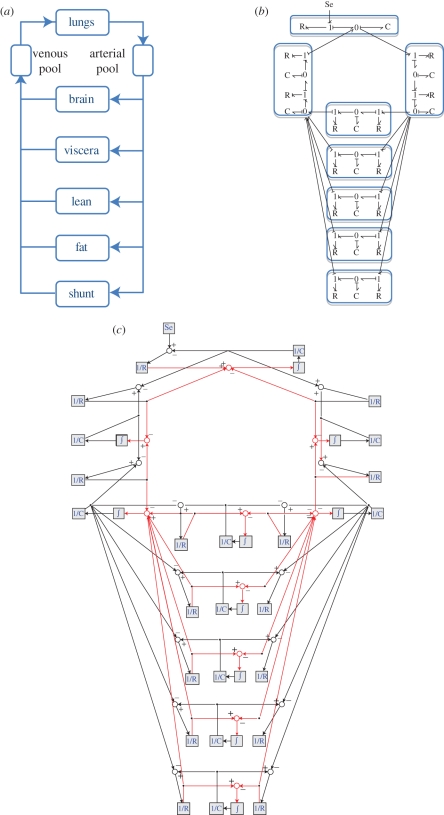
Figure 10 shows three different representations for the PBPK model. The BG model shown in figure 10b is placed between the classical representation of PBPK models and the detailed representation of a standard block diagram. The user might identify some advantages of using a BG representation in this example, e.g. (i) all the physical processes are explicitly represented in the BG model; (ii) cause–effect relationships are clearly expressed using the ‘causality’ strokes (something that could be missed in figure 10c because of the complexity of the graph); (iii) the use of ‘bonds’ carrying two variables (concentration and mass flow) helps to obtain a simplified graph closer to the condensed representation of classical PBPK models. The BG model should also be easier to annotate owing to a compact and consistent nomenclature.
Figure 10.
PBPK model of the human anaesthetic drug uptake [7]. (a) PBPK model. (b) BG model. (c) Block diagram equivalent model.
A fundamental problem in the ontological annotation of physiologically based models is the fact that a ‘common language’ must be used to describe a myriad of processes. The models presented using BG in this paper are structurally adapted for a quick and coherent ontological annotation as they provide an appropriate level of description and representation of all the processes involved and a set of characteristics that define each type of process (element C represents accumulation or storage of mass/energy, element R represents chemical reactions, and so on). For other approaches, the task could be more challenging as hidden processes must be described although they are not visible and artificial mechanisms must be included in the annotation process as well. This will inevitably lead to confusion.
4.2. Shortcomings
The power of the BG method lies in its ability to generate equations linking different domains and scales in a unified, coherent and transparent fashion. In complex systems where it is easy to misrepresent fundamental mechanisms and interactions using ad hoc methods, the formalism provided by highly structured and energy-consistent methodologies, such as BGs can be of great help in ensuring that all appropriate connections are made and very importantly, consistently. However, BGs have some shortcomings:
— In simple systems, BGs do not offer substantial advantages over standard methods.
— BGs are perceived as too cumbersome or difficult to penetrate.
— In systems where the thermal domain must be included, formal BGs require the use of abstract concepts, such as entropy, instead of enthalpy (which is much more commonly used in engineering-based approaches) [8].
— BGs are not good candidates to model hybrid systems; however, this is not a unique problem of this methodology.
— BGs were created for Physical and Engineering applications [17], so there is no current standardization for BG modelling in Biology and Physiology and new improvements to the methodology (e.g. a new graphical method with new definition of effort and flow variables) might be required for some of these applications.
5. Brief insight into the dynamical analysis of bond graph models
5.1. Structural observability
Based on the concept of structural rank and using causal manipulation of the original BG model, some authors (Sueur & Dauphin-Tanguy [18] and Pichardo-Almarza et al. [19,20]) have shown the possibility to derive information about the structural observability of a system. The main result of this type of analysis is related to the possibility to specify the right location and number of sensors (or measured variable) to assure that the state variables of a system are observable (i.e. can be estimated using an observer).
5.2. Structural identifiability
The global identifiability is a structural property of models, which associates a unique set of parameters with given input/output response. The translation of this property into BG modelling language allows the combination of the physically meaningful language of BG methodology and the numerical accuracy of identified transfer function models. A first approach was developed by Delgado & Profos [21] to determine local identifiability of linear systems. Decotte & Dauphin-Tanguy [22] developed graphical methods based on causal manipulations to determine the identifiability of BG models; giving information mainly about the global identifiability of the system studied.
6. Software based on bond graph modelling
There is a variety of software for BG modelling and simulation. Examples are: 20-sim (www.20sim.com), Camp-G (Matlab Toolbox) (www.bondgraph.com), Symbols (http://www.htcinfo.com/) and MS1 (http://www.lorsim.be/eng/ms1_desc.htm). A tool for the structural analysis was also developed by Azmani & Dauphin-Tanguy [5].
In general, these software are focused on systems that span multiple physical domains and the information domain, where model entry and model processing are fully integrated. This means that already during model entry and editing, models can be checked on their consistency. In the particular case of 20-sim, it has its own simulator using sophisticated numerical integration methods taken from internationally accepted numerical libraries.
Other software based on BG has been very successful in modelling and simulation of multi-science applications (e.g. engineering). Two of the best examples are Modelica (https://www.modelica.org) and Amesim (http://www.lmsintl.com/imagine-amesim-1-d-multi-domain-system-simulation).
BG software provide a graphical interface that supports the structural properties and equations of a specific model. An additional (standardization) tool for the exchange of models is a novel XML-based format called Bond Graph Markup Language (BGML) [23]. This tool supports the exchange and the reuse of BG models between various BG and non-BG software. BGML is basically the description of a BG model using XML schema where the model equations and constitutive relations (linear or not) are represented in MathML.
7. Conclusions
BG modelling has been extensively used in engineering applications mainly because of its unified approach for different scientific domains and its graphical nature that help to obtain simplified models, in which it is relatively simple, from a graphical point of view, to understand the connection between the physics and the equations of the model. This simplified model structure has shown also comparative advantages for the analysis of dynamical systems. Mathematical modelling in biology requires a good translation between the physico/chemical interactions in an entity or ‘level’ (e.g. cell, tissue, organ) and the equations of the model. An appropriate description and representation of systems is of paramount importance for a homogeneous annotation and the development or implementation of consistent ontologies. Because of their internal coherence, BG modelling shows compelling features that could be taken into consideration by mathematical biology software for a unified and consistent approach to develop multi-scale and multi-physics models in integrative biology.
Acknowledgements
The authors would like to acknowledge the support of the European Commission (Project ‘S-SARCOMERE’, grant number 224896, European Reintegration Grant, Marie Curie Actions) in the development of this work.
Footnotes
One contribution of 17 to a Theme Issue ‘The virtual physiological human’.
References
- 1.Evans D. J. W., et al. 2008. The application of multiscale modelling to the process of development and prevention of stenosis in a stented coronary artery. Phil. Trans. R. Soc. A 366, 3343–3360 10.1098/rsta.2008.0081 (doi:10.1098/rsta.2008.0081) [DOI] [PubMed] [Google Scholar]
- 2.Southern J., Pitt-Francis J., Whiteley J., Stokeleyc D., Kobashi H., Nobes R., Kadooka Y., Gavaghan D. 2008. Multi-scale computational modelling in biology and physiology. Progr. Biophys. Mol. Biol. 96, 60–89 10.1016/j.pbiomolbio.2007.07.019 (doi:10.1016/j.pbiomolbio.2007.07.019) [DOI] [PMC free article] [PubMed] [Google Scholar]
- 3.Karnopp D., Azarbaijani S. 1981. Pseudo bond graphs for generalized compartmental models in engineering and physiology. J. Franklin Inst. 312, 95–108 10.1016/0016-0032(81)90081-8 (doi:10.1016/0016-0032(81)90081-8) [DOI] [Google Scholar]
- 4.LeFèvre J., Barreto J. 1985. A mixed block diagram bond graph approach for biochemical models with mass action and rate law kinetics. J. Franklin Inst. 319, 201–215 10.1016/0016-0032(85)90074-2 (doi:10.1016/0016-0032(85)90074-2) [DOI] [Google Scholar]
- 5.Azmani A., Dauphin-Tanguy G. 1992. ARCHER: a program for computer aided modelling and analysis. In Bond graphs for engineers (eds Breedveld P. C., Dauphin-Tanguy G.), pp. 263–277 North Holland: IMACS [Google Scholar]
- 6.LeFèvre J., LeFèvre L., Couteiro B. 1999. A bond graph model of chemo-mechanical transduction in the mammalian left ventricle. Simul. Practice Theory 7, 531–552 10.1016/S0928-4869(99)00023-3 (doi:10.1016/S0928-4869(99)00023-3) [DOI] [Google Scholar]
- 7.Gawthrop P. J., Smith L. P. S. 1996. Metamodeling: bond graphs and dynamic systems. NJ, USA: Prentice-Hall [Google Scholar]
- 8.Karnopp D., Margolis D., Rosenberg R. 1990. System dynamics: a unified approach, 2nd edn. New York: Wiley-Interscience [Google Scholar]
- 9.Sueur C., Dauphin-Tanguy G. 1991. Bond graph approach to multi-time scale systems analysis. J. Franklin Inst. 328, 1005–1026 10.1016/0016-0032(91)90066-C (doi:10.1016/0016-0032(91)90066-C) [DOI] [Google Scholar]
- 10.Huxley A. F. 1957. Muscle structures and theories of contraction. Prog. Biophys. Chem. 7, 205–279 [PubMed] [Google Scholar]
- 11.Díaz-Zuccarini V. A. 2003. University of Lille;Etude des conditions d'efficacité du ventricule gauche par optimisation téléonomique d'un model de son fonctionnement. PhD thesis. See https://iris.univ-lille1.fr/dspace/
- 12.Díaz-Zuccarini V., LeFèvre J. 2007. An energetically coherent lumped parameter model of the left ventricle specially developed for educational purposes. Comput. Biol. Med. 37, 774–784 10.1016/j.compbiomed.2006.07.002 (doi:10.1016/j.compbiomed.2006.07.002) [DOI] [PubMed] [Google Scholar]
- 13.Sauro H., Bergmann F. 2008. Standards and ontologies in computational systems biology. Essays Biochem. 45, 211–222 10.1042/BSE0450211 (doi:10.1042/BSE0450211) [DOI] [PMC free article] [PubMed] [Google Scholar]
- 14.Mapleson W. W. 1963. Quantitative prediction of anesthetic concentrations. In Uptake and distribution of anesthetic agents (eds Papper E. M., Kitz R. J.), pp. 104 New York: McGraw-Hill [Google Scholar]
- 15.Mapleson W. W. 1973. Circulation-time models of the uptake of inhaled anaesthetics and data for quantifying them. Br. J. Anaesth. 45, 319–333 10.1093/bja/45.4.319 (doi:10.1093/bja/45.4.319) [DOI] [PubMed] [Google Scholar]
- 16.Davis N. R., Mapleson W. W. 1981. Structure and quantification of a physiological model of the distribution of injected agents and inhaled anaesthetics. Br. J. Anaesth. 53, 399–406 10.1093/bja/53.4.399 (doi:10.1093/bja/53.4.399) [DOI] [PubMed] [Google Scholar]
- 17.Paynter H. M. 1961. Analysis and design of engineering systems. Cambridge, MA: MIT Press [Google Scholar]
- 18.Sueur C., Dauphin-Tanguy G. 1991. Bond graph approach for structural analysis of mimo linear systems. J. Franklin Inst. 328, 55–70 10.1016/0016-0032(91)90006-O (doi:10.1016/0016-0032(91)90006-O) [DOI] [Google Scholar]
- 19.Pichardo-Almarza C., Rahmani A., Dauphin-Tanguy G., Delgado M. 2005. Proportional—integral observers for systems modelled by bond graphs. Simul. Modell. Pract. Theory 13, 179–211 10.1016/j.simpat.2004.10.001 (doi:10.1016/j.simpat.2004.10.001) [DOI] [Google Scholar]
- 20.Pichardo-Almarza C., Rahmani A., Dauphin-Tanguy G., Delgado M. 2005. High gain observers for non-linear systems modelled by bond graphs. J. Syst. Control Eng. 219, 477–498 10.1243/095965105X33608 (doi:10.1243/095965105X33608) [DOI] [Google Scholar]
- 21.Delgado M., Profos G. 1999. Identifiability of dynamic systems represented by bond graphs. Math. Comput. Modell. Dyn. Syst. 5, 89–112 10.1076/mcmd.5.2.89.6174 (doi:10.1076/mcmd.5.2.89.6174) [DOI] [Google Scholar]
- 22.Decotte B., Dauphin-Tanguy G. 2002. Structural identifiability of bond graph models. Proceedings of the 14th European simulation symposium and exhibition (ESS′2002), 23–26 October 2002, Dresden, Germany Erlangen, Germany: SCS European Publishing House. [Google Scholar]
- 23.Borutzky W. 2006. BGML—a novel XML format for the exchange and the reuse of bond graph models of engineering systems. Simulation modelling practice and theory 14, 787–808 10.1016/j.simpat.2006.01.002 (doi:10.1016/j.simpat.2006.01.002) [DOI] [Google Scholar]


