Abstract
Ischaemic heart failure remains a significant health and economic problem worldwide. This paper presents a user-friendly software system that will form a part of the virtual pathological heart of the Virtual Physiological Human (VPH2) project, currently being developed under the European Commission Virtual Physiological Human (VPH) programme. VPH2 is an integrated medicine project, which will create a suite of modelling, simulation and visualization tools for patient-specific prediction and planning in cases of post-ischaemic left ventricular dysfunction. The work presented here describes a three-dimensional interactive visualization for simulating left ventricle restoration surgery, comprising the operations of cutting, stitching and patching, and for simulating the elastic deformation of the ventricle to its post-operative shape. This will supply the quantitative measurements required for the post-operative prediction tools being developed in parallel in the same project.
Keywords: heart, heart failure, surgical planning, virtual surgery, visualization, computer graphics
1. Introduction
Heart failure (HF) is a serious problem worldwide in terms of mortality and economic cost. In the USA, the lifetime risk of developing HF above the age of 40 is 20 per cent, and approximately half of patients die within 5 years of diagnosis. In 2010, the cost of HF to the US in direct healthcare alone was estimated to be $35 billion [1]. In the UK, HF was estimated to cost 4 per cent of all healthcare expenditure in 2000 [2].
The most common cause of HF is ischaemic heart disease [3], in which part of the heart muscle, or myocardium, has ceased to function because of a lack of oxygen. This is most serious when it affects the left ventricle (LV) and causes left ventricular dysfunction (LVD), in which the ability of the LV to pump blood to the body is impaired. The dysfunction is a result of several factors: the loss of muscle action in the affected part of the myocardium; changes in the size and shape of the ventricle; and, in some cases, backward flow (regurgitation) through the mitral valve.
Surgical treatment of LVD consists of removing those parts of the myocardium that are entirely necrotic. The dysfunctional ventricle is typically enlarged, and often a bulge associated with an aneurysm will be found in the necrotic area. Its form also tends to change from an ellipsoid to a less efficient spherical shape. The enlargement is undesirable because it increases the muscle tension required to achieve a given blood pressure, forcing the heart to work harder to eject blood from the LV. The distortion can also make valve closure less complete, which makes regurgitation more likely.
Thus, the aim of surgery is not only to remove the diseased tissue, but also to return the LV to its correct volume and shape—this is known as LV restoration. Other procedures that might be performed in combination with the LV restoration surgery include revascularization, in which the blood flow is rerouted in an attempt to restore some function to regions that are failing but not necrotic, correction of mitral valve regurgitation and resynchronization, in which one or more pacemakers are fitted. A description of LV restoration procedures is given in Wallen & Rao [4].
Currently, few tools are available to assist the cardiac surgeon with treatment and surgical planning, though the right ventricle (RV) has received some attention in the literature, mainly because of its role in congenital defects. Two studies have shown that valid models can be constructed and predictions made from magnetic resonance imaging (MRI) sequences: Tang et al. [5] developed patient-specific models of the mechanics and fluid flow in RVs with tetralogy of Fallot, and were able to predict the post-operative shape and performance of the RV after removal of scar tissue; and Sorensen et al. [6] simulated a range of RV surgical procedures on a highly realistic virtual reality model, and reported good agreement in appearance between the real surgery and the simulation. Hartyanszky et al. [7] developed a system called computer-assisted ventricle engineering (CAVE) for pre-operative planning of the cutting lines, based on CT slices; CAVE predicts post-operative LV volume and has been used to predict a successful outcome in a patient who would otherwise not have been treated. Ionasec et al. [8] developed a four-dimensional patient-specific model of the whole heart, including its chambers, valves and haemodynamics, and demonstrated its application for planning the placement of stent-mounted implants.
Treatment planning is made more difficult by the different responses of patients to the same treatment. Several studies, for example [9–11], have reported that almost a third of cardiac resynchronization therapy patients were ‘non-responders’ in that their hearts did not show significant improvement in function. If no distinction is made between responders and non-responders, it can be possible to conclude, as in Wallen & Rao [4], that there is no evidence of any long-term benefit from LV restoration, despite the short-term relief of symptoms. To distinguish responders from non-responders, a range of patient-specific risk factors, including genetics, should be taken into account. A review of current progress in patient-specific modelling can be found in Neal & Kerckhoffs [12].
The Virtual Pathological Heart of the Virtual Physiological Human (VPH2)1 is an integrated medicine project, which will create a suite of modelling, simulation and visualization tools for patient-specific prediction and planning in cases of post-ischaemic LVD, with or without mitral valve regurgitation. The project employs MRI and models of the LV, the mitral valve, the fluid flow and the blood circulation, together with surgical simulation and genetics to assess the patient's current condition, to perform virtual surgery and to predict the post-operative result and the long-term response to the treatment. While endocardial and epicardial segmentation, regional function and tissue viability are characteristics that are present in the majority of the currently available software products, the VPH2 platform will be unique in including quantitative analysis of the mitral valve and the simulation of surgical procedures, and in having export capabilities for further finite-element method design and processing.
Highly detailed simulations of cardiac surgery exist, but they are not primarily intended for surgical planning as they tend to be designed for training purposes [13], or to require a virtual reality environment and haptic feedback [14]. A multi-scale, integrated model of the heart called euHeart2 is currently being developed within the VPH programme; this can be registered to patient-specific data, but it is still at a development stage and has not yet been used in clinical practice.
This paper describes the tool being developed in VPH2 for simulated LV reconstruction surgery. This provides an interactive three-dimensional visualization of the LV, which enables the user to view the epicardium and endocardium and the extent of the necrotic damage, to carry out the operations of cutting, stitching and patching, and to view the deformation of the ventricle into its post-operative shape. An earlier stage of this work has been described in Lin et al. [15]. The tool is novel in being designed for rapid use in a clinical setting, being entirely based on patient data, and requiring a minimum amount of modelling to produce a post-operative prediction. Clinical outcomes will be improved because the user will be able to include different surgical options in a highly integrated prediction of risk.
It is not claimed that the system described will be the final output from the project, but it is felt that sufficient has been achieved so far to make a description of the concept behind the system and it initial realization worthwhile. We have indicated in the text additional components that will be available in the near future as a result of work in progress at the time of writing.
2. Input data
The input data for this work consists of two sets of MRI: time-varying ‘short-axis’ MRI, and static gadolinium (Gd) MRI. VPH2 has aimed for simplicity of use and minimal discomfort to the patient in the clinical setting; hence the minimum of imaging modalities have been used to satisfy the data requirements of high resolution images, motion capture and accurate location of the necrotic region.
Short-axis MRI was chosen as the main imaging modality because its high spatial and temporal resolution make it the best technique for capturing the wall motion of the ventricle: it is widely available, non-invasive and requires no radiation or contrast agent. Echocardiography provides similar resolution, but the transthoracic mode is prone to attenuation and artefacts caused by air and fat, and the transesophageal mode is particularly invasive. A further disadvantage of echocardiography is the difficulty in producing a single image of the whole ventricle.
For quantifying the necrotic region, Gd MRI is a well-validated technique. Additional modalities such as fMRI or tagged MRI would have been interesting, but are not as widely available, and such extra imaging would have placed unacceptable demands on the patients.
In the short-axis MRI, the scanner is positioned to collect slice images of the heart with the image planes normal to the long axis of the LV. This sequence is time-varying, with 30 frames captured at each slice position, starting with the first frame at end-systole, the end of the contraction part of the cardiac cycle. A small number of slices, approximately 10, are captured, each starting at the same nominal point in the heart cycle. The inter-slice resolution is approximately 8 mm, which is the minimum slice-to-slice step size of the MRI scanner, and is not untypical of MRI machines in general. Hence, the slices comprise a three-dimensional image with very good pixel resolution within the slice planes, but poor inter-slice resolution. The top and bottom (apex) of the ventricle are not captured. The time sequence is used in related parts of the VPH2 suite to map the contractility of the ventricle wall, but all the work described in this paper is non-time-varying, and based on the end-diastole frame; the end-diastole is used because the volume at this point is needed in the calculation of the ejection fraction, which is one of the most important measures of the functioning of the ventricle.
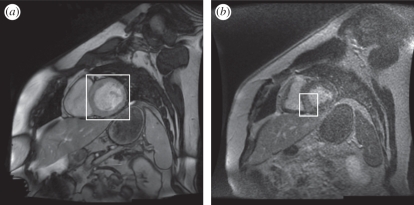
In the Gd MRI modality, the MRI is configured to detect a Gd compound that is preferentially absorbed by necrotic tissue. A three-dimensional data volume is captured in the same manner as the short-axis MRI, but without the time variation; only the mid-diastole frame is captured. This particular point in the cardiac cycle is used because the heart is relatively still during diastole, so the image contains fewer motion artefacts. The capture of the Gd MRI at a different point in the cardiac cycle from that of the short-axis MRI surfaces is not ideal for the purposes of registration but is unavoidable owing to the different demands on the images. The Gd injection is highly toxic, and the number of slices tends to be limited by the short time during which it remains active. The result is a three-dimensional image of the heart revealing the location of the necrotic region. Figure 1 shows approximately corresponding slices through the same heart, in short-axis and Gd MRI.
Figure 1.
(a) Short-axis MRI of heart, indicating the left ventricle (LV); (b) Gd MRI of heart, indicating the brighter necrotic area in the septal region of the myocardium.
3. Pre-processing
The MRI images are pre-processed to extract the endocardium and epicardium (the inner and outer surfaces of the ventricle wall) in the form of triangular mesh surfaces, which can be visualized and manipulated in three dimensions. The pre-processing stages are:
— segmentation, in which the endocardium and epicardium are located in the images;
— reconstruction, in which the mesh surfaces are built from the segmented points in the images; and
— registration, in which the positions of the Gd surfaces are registered with the short-axis MRI, and the Gd data copied on to the mesh surfaces for visualization.
3.1. Segmentation
The purpose of segmentation is to identify contours in the MRI image slices that correspond to the endocardium and epicardium of the LV. The ventricle wall is segmented by a novel combination of two methods: the segmentation method for extracting the endocardium is a region-based level-set method [16]; and the segmentation method for the epicardium is an edge-based level-set method [17]. The segmentation is applied to short-axis MRI, and the result is a pair of contours in each image slice, corresponding to the endocardium and epicardium, respectively. The segmentation requires one point per slice to be selected in the ventricle cavity, otherwise it is fully automatic.
Segmentation of the necrotic areas from the Gd MRI images is performed by the method developed for this specific application as described in Positano et al. [18]. This has previously been described and validated in Caiani et al. [19]. Each point in the contour of the ventricle wall is labelled with the ‘transmurality’ value, which is the percentage thickness of the wall that is necrotic at that point.
The segmentation produces four separate point clouds marking the endocardium and epicardium in short-axis MRI and Gd MRI, respectively. The points are labelled with their respective slice numbers; the Gd points are also labelled with the transmurality.
3.2. Surface reconstruction from three-dimensional contour points
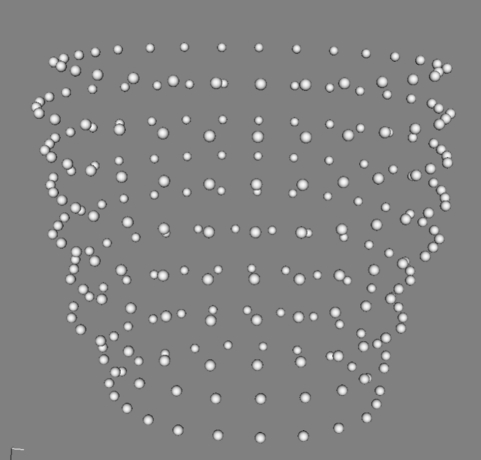
The reconstruction step creates the LV surface models from the point clouds output from the segmentation. The data consist of sets of contour points; they are sparse in the axial direction, rarely consisting of more than 10 contours, approximately 8 mm apart. Figure 2 shows one such set.
Figure 2.
Example of a point cloud corresponding to the segmentation of the epicardium.
The contours are not captured simultaneously; rather they are captured at different times but nominally all at the same point in the cardiac cycle. The low resolution and errors owing to mistiming or the patient's breathing make it difficult to create a good mesh for later processing.
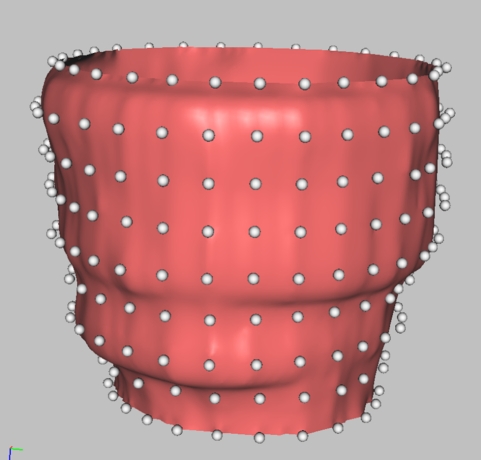
The novel surface reconstruction method developed in this work is a hybrid algorithm and has been reported in detail in Lin et al. [15]. It combines features of point-based algorithms [20–22] and slice-based algorithms [23–25]. Figure 3 shows a point cloud with its corresponding reconstructed surface.
Figure 3.
Point cloud with reconstructed epicardium surface.
One problem to note is that movement of the patient during the scanning can result in some slices being translated parallel to the slices. This should be corrected without removing any genuine bulges caused by aneurysms. In VPH2, the contours are corrected by aligning the centres of mass of the contour points along a linear regression line. Slices containing aneurysms have to be manually excluded from the correction.
3.3. Gadolinium heart ventricle registration
Registration is necessary because the Gd MRI is taken in an independent pass, so a correspondence has to be established between the Gd data and the short-axis MRI surface. This is achieved using the iterative closest point (ICP) algorithm [26]; ICP is a fast, classical and well-tested registration algorithm that does not rely on sensitive surface information.
ICP is used to minimize the difference between two point clouds. It iteratively updates the transformation (translation and rotation) needed to minimize the distance between two input point sets, and always converges monotonically to a local minimum with respect to the distance objective function. Its output is the refined transformation matrix.
The input data are low-resolution in the axial direction and noisy. There are no surface landmarks apart from bumps, which are as likely to be noise as real features. In addition, the top and bottom of the ventricle are absent from the data, the up-and-down motion of the heart making them too difficult to capture; if the input datasets have different lengths missing, or parts were captured at different points in the cardiac cycle, registration in the axial direction becomes very difficult. Details on these problems and approaches to solve them have been previously reported in Lin et al. [15]. Work currently taking place to facilitate the process will allow the inclusion of the position of the septum (the wall between the RV and LV) in the segmented input data, thus providing a reliable constraint for the relative rotation of the surfaces, and the identification of landmarks to constrain the vertical translation component.
After the transformation matrix is calculated from the registration of the two models, the transmurality values on the Gd data are mapped to the short-axis surface in the following manner. The Gd points and the short-axis surface are both mapped to a parameterized surface—in this case, a cylinder. Although the individual points in both cases represent the same physical surface, there is no correspondence between the two sets of points. Interpolation is then performed on the parameterized surface to map the transmurality associated with the Gd vertices. In the final step, the interpolated transmurality is mapped back from the cylinder to the vertices on the short-axis surface. The process is illustrated in figure 4.
Figure 4.
Mapping of transmurality from Gd MRI points to short-axis MRI surface: (a) point cloud with transmurality; (b) points mapped to parameterized surface; (c) interpolation of transmurality to parameterized surface; (d) mapping of transmurality onto epicardium.
4. Surgical simulation
This section describes an interactive tool for the simulation of LV restoration surgery, consisting of cutting, stitching and patching. When these operations have been completed, the stitches are pulled tight, and the LV deforms elastically to predict the final post-operative shape. The tool is implemented on the multimod application framework (MAF) platform for medical visualization [27], and makes extensive use of the visualization toolkit (VTK) library [28].
The purpose of the tool is the rapid prototyping of surgical options, indicating to the surgeon which options are likely to give good or bad results. The timescale for surgical planning is quite short: in this study, the MRI data are available 3–7 days before the surgical decision. The pre-processing of the images is performed by the MRI personnel, and the surgeon is expected to spend no longer than 30 min on simulation and planning, so the tool should be easy to use and quick to return quantitative predictions of the post-operative ventricle and its functionality.
4.1. Initial visualization
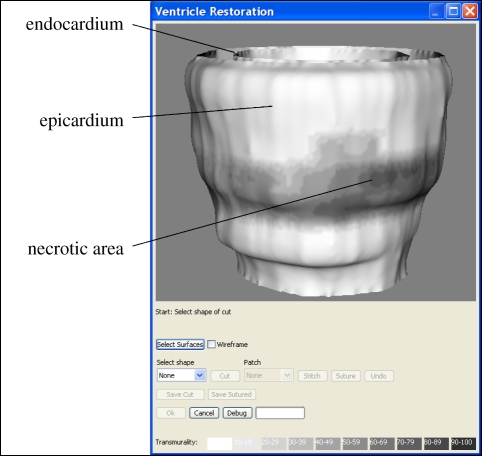
Figure 5 shows the epicardium and endocardium, displayed as mesh surfaces. The user can interactively view the ventricle from any angle, with translation and zooming controlled via the mouse. The resolution needs to be high, partly so that the user does not see shape artefacts arising from discretization, and partly because the mesh-cutting algorithm in VTK produces better results when the triangles are small; the endocardium and epicardium surfaces in figure 5 contain approximately 27 000 and 38 000 triangles, respectively. If the user wishes to view the endocardium through the epicardium, a pseudo transparency is available by switching to a wireframe view; true transparency would be desirable, but would be too computationally expensive to implement with so many triangles.
Figure 5.
The LV, showing the endocardium and epicardium surfaces and the necrotic area, shaded dark.
The colour scale for transmurality is the same as that used throughout the VPH2 project: a linear mapping of the percentage onto a 10-point scale from red to black, with 0 per cent (completely healthy) mapped to pure red, and 100 per cent (completely necrotic) mapped to pure black. The relationship between transmurality and the probability of recovering myocardial function [29,30] is itself sufficiently linear that the scale can be considered a good representation of the clinical severity.
In its current form, the visualization lacks location features, and the positions of the coronary arteries, which constrain where sections can be cut, are not marked. As noted, this is being addressed currently by the inclusion of the position of the septum. Further, ongoing work to support revascularization will provide a map of the coronary arteries, which will be registered and displayed on the surface.
4.2. Cutting operation
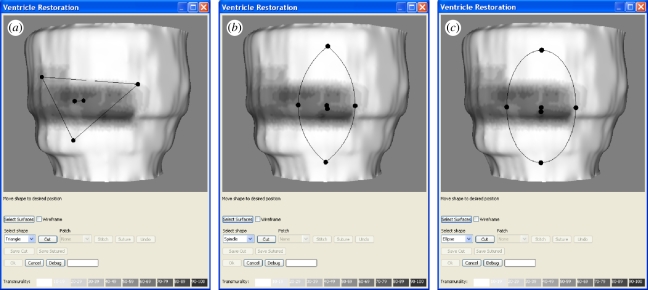
For the cutting operation, the user selects a shape for the cut from a dialogue menu. Currently the shapes available are triangle, spindle or ellipse; these were agreed with cardiologists and the cardiac surgeons in the project consortium. Mathematical precision is not necessary in defining the cut, as the shape cannot be reproduced exactly in the operating theatre; it is sufficient that the tool allows a reasonable approximation to the common surgical options.
On first thoughts, a freehand drawing tool might appear to be an attractive way of defining the position of the incisions, but, in practice, the cutting tool widget is much quicker and less clumsy to use than such a drawing tool would be. It also stands repeated use without becoming tiresome. While the user is not free to draw every possible shape, the system includes the shapes that are commonly used in practice, and more could easily be added if users required them. A further advantage of providing a set menu of shapes is that the corresponding stitching patterns can be determined in advance, allowing stitching to be simulated automatically; this would be difficult to achieve with an unconstrained shape.
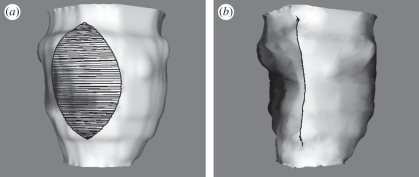
When the shape of the cut is selected from the menu, an interactive widget appears on the epicardium surface, as shown in figure 6. The widget can be positioned and manipulated by using the spherical handles supplied. It is initially positioned on the surface facing the virtual camera, and an automatic correction is applied at each interaction to ensure that the widget remains as close as possible to the surface, while keeping the handles visible. When the user is satisfied with the widget position, the ‘cut’ button is selected and the widget shape is punched through the surfaces.
Figure 6.
Cutting tool widgets: (a) triangle, (b) spindle and (c) ellipse.
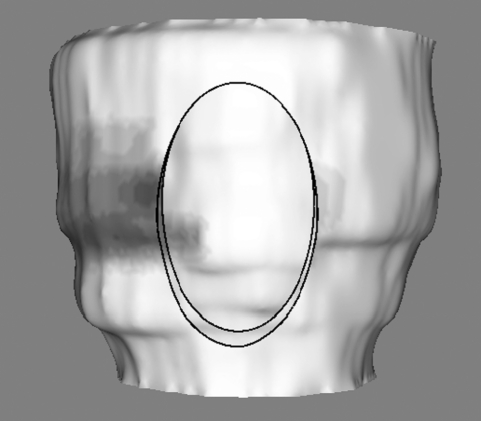
Figure 7 shows the result of the ellipse cut; the epicardium diametrically opposite the cut is visible through the resulting hole. The cut itself is executed by the standard VTK cutting function, but the widgets and the implicit functions controlling the cut are novel VTK extensions created specifically for this work.
Figure 7.
Result of cutting using an ellipse widget.
4.3. Stitching
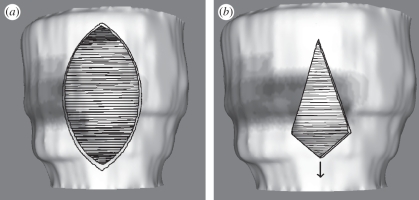
When the user has cut the required hole in the LV, an option is provided to place a patch (see §4.4), or to stitch without a patch. For the latter, the stitches are placed automatically across the hole with no user input. In the case of the spindle and ellipse, the stitches are placed normal to the central axis, which is defined as the longest chord between pairs of points around the hole. Pairs of points opposite each other across the central axis are identified, and each pair is joined by a stitch. Figure 8a shows the stitching pattern for a spindle-shaped hole. In the case of the triangle, the longest chord is simply the longest side, and is not the correct axis for the stitching direction; instead, the correct way to stitch a triangle is to place the stitches parallel to the shortest side. To avoid buckling, the mid-point of the shortest side is pulled outwards, deforming the triangle into a kite shape. This is shown in figure 8b.
Figure 8.
Stitching patterns: (a) spindle and (b) triangle.
4.4. Patching
As stated in §1, one of the aims of LV restoration surgery is to reduce the volume of the LV to a normal size. However, if the amount of necrotic tissue that must be removed is so large that the post-operative LV would become too small to function suitably, the surgeon may decide to insert a patch.
The patch is a piece of dacron material, which is placed across the surgical hole, beneath the endocardium. The edge of the hole is then stitched to the patch, rather than to the opposite edge of the hole. This enables the surgeon to close the hole but leave an LV with an optimal volume. It also gives the surgeon some extra control over the final shape.
In this work, when the patch option is selected, a patch is placed automatically in the hole. The precise shape and size are not important, so the patch is created with the same shape as the hole (triangle, spindle or ellipse) and slightly larger, so that the hole will be sealed. Unlike the automatic stitching in the previous section, the procedure of stitching to the patch requires manual input from the user, since the placement of stitches on the patch depends on how much closure is required to achieve the desired reduction in the ventricle volume.
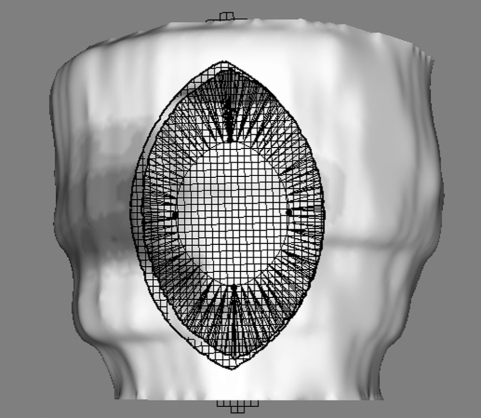
In the case of the spindle and ellipse, it would be possible to change the dimensions of the stitching line with two parameters corresponding to the percentage closure in the axial and normal-to-axis directions; however, it is extremely difficult to generalize this to the triangle case, or indeed, to any other shape that might implemented. A convenient and general solution to this is to re-use the cutting tool widget (see §4.2) as a stitch-to-patch tool. The tool is constrained to ‘stick’ to the patch and to remain within the hole. The stitches join the points on the edge of the endocardium hole to points on the patch, controlled by the widget. Each point on the hole is stitched to the patch point which is nearest to the nearest widget point. Figure 9 shows a patch and its associated stitching tool in a spindle-shaped hole.
Figure 9.
A spindle-shaped hole with a patch and the associated stitching tool.
It can be seen in figure 9 that the patch mesh is composed of quad cells, rather than triangles; this anticipates the elastic deformation in the following section, in which the low shear strength of the quads should be a closer match to properties of the dacron material than triangles.
4.5. Deformation
The final stage of the surgical simulation is to predict the final shape of the LV after the stitches have been pulled tight and the ventricle has deformed to its new shape. This requires an elastic model of the LV. A review of deformable modelling in surgical simulation can be found in Meir et al. [31]. Most elastic models used in surgical simulation are of two types: finite-element and spring-mass. Finite-element models divide the tissue into volumetric cells and are the model-of-choice when highly accurate simulation of mechanical properties is required; however, they have not proved popular because of the difficulty in creating a well-formed volumetric mesh and in simulating surgical cutting in real time. Spring-mass models represent a surface, or sometimes a volume, by a set of point masses joined by springs. As such, they are simpler and faster to solve than finite elements, and are the most common type of model used in surgical simulation. The disadvantages of spring-mass models are that they cannot simulate physical properties as accurately as finite elements (it is difficult to decouple the tension and shear constants), and additional components are required to simulate bending forces.
In this work, a spring-mass model of the LV is being developed. The components included in the model are the meshes corresponding to the endocardium and the patch, and the stitches. The epicardium is omitted, because it is no longer of any quantitative interest; all of the subsequent post-operative functional analysis is based on the endocardium alone. The model corresponds to the mesh in that the nodes of the mesh become point masses, and the edges of the cells become springs. However, the number of triangles in the endocardium mesh is too large for the deformation equations to be solved in a reasonable time, so the mesh is first decimated to produce a low-resolution version composed of approximately 6000 triangles. The springs are Hookian, so the force Fij on each point i due to spring j is given by
| 4.1 |
where Kij is the spring constant, Lij is the length, L0ij is the rest length and xj and xi are the positions of the end points. With a mass mi and a damping factor γi associated with each point, the equation of motion of point i is
| 4.2 |
In the simulation shown here, all the masses mi were set to 1.0, and all the damping factors γi were set to 1.4, corresponding to a critical damping ratio of 0.7. All of the spring constants Kij were set to 1.0. These were example values to demonstrate the deformation, but the model will ultimately include correct elastic constants, with bending and pressure forces. The rest lengths were set to the lengths of the springs in the starting configuration. The stitches were pulled tight by setting the rest lengths of the stitches to a small value, and the system was deformed to its new equilibrium state by symplectic Euler integration. The maximum stable timestep is limited by the highest frequency mode of the mesh, or approximately by the frequency of the stiffest spring. A detailed analysis of the stability of numerical integration methods has been given by Hauth et al. [32]. Figure 10 shows an endocardium before closure, and the post-operative shape after 1000 Euler iterations. The simulation required 50 s on a 2.3 GHz AMD processor.
Figure 10.
Deformation of the endocardium: (a) pre-operative shape, showing spindle-shaped cut with stitches; (b) predicted post-operative shape after 1000 Euler iterations of mass-spring model.
While the deformation works satisfactorily, a small amount of tuning is taking place to improve its performance. Anisotropy will be taken into account if the need is indicated during the validation phase. The pressure on the mesh consists of the internal intraventricular pressure, which varies with the cardiac cycle, and a smaller external pleural pressure, which varies with the respiratory cycle. It is not possible to directly measure the patient-specific intraventricular pressure without invasive catheterization; therefore the end-diastole value will be predicted from the known properties of the patient-specific heart, using the suite of functional assessment tools currently being developed in parallel within VPH2 (see §4.6).
As stated previously, a problem with Euler integration is that the maximum timestep is limited by the highest natural frequency in the mesh, so that a small number of ‘stiff’ springs can force the whole integration to run slowly. One solution to this is to balance the dynamics of the mesh by adjusting the masses of the points so that every spring has the same natural frequency. Thus, stiff springs will be attached to larger masses, so that they move more slowly. This is possible in this application because the distribution of masses affects only the dynamics of the mesh, not the final equilibrium position—the dynamics of the deformation are of interest only to the extent that the animation should remain stable from start to finish. This will allow the tissue, stitches and patch to be assigned different spring constants without having to reduce the speed of the integration.
Finally, it is noted that the simulated LV is under pressure, and therefore that the act of cutting should itself cause some elastic deformation, prior to stitching. This means that the equilibrium position of the mass-spring model is that of the mesh before the cut, not after. Further investigation is taking place to see if the effect is significant and, if so, to take the additional deformation into account.
4.6. Outputs and integration with the virtual pathological heart of the Virtual Physiological Human
This work described lies within the larger framework of VPH2, and forms a link between the pre-operative functional assessment of the patient and the post-operative functional predictive tools.
When the user has completed the simulated surgery, various quantitative measurements must be made on the predicted post-operative LV to integrate with the post-operative assessment tools. These measurements are to be added to the workflow in the immediate future.
The most important measurement is the volume between the top and bottom slices, which is used to calculate the total end-systolic volume of the ventricle. Another important shape parameter with an effect on the efficiency of the LV is sphericity, which is the ratio of the length to the radius.
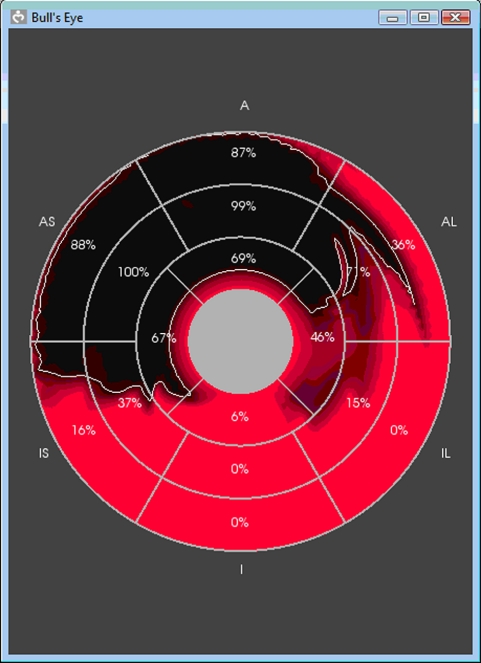
The functional assessment tools in VPH2 are based on a standard 18 or 16-sector model of the LV, the conventional display for which is the ‘bullseye diagram’. This shows the ventricle viewed from above and flattened, with the sectors from the top of the LV at the centre and the sectors from the bottom of the LV towards the periphery, as shown in figure 11.
Figure 11.
Bullseye diagram of an LV divided into 16 sectors, showing the distribution of necrotic areas (dark). The top sectors are at the centre and the bottom sectors are around the outside.
The input epicardium and endocardium are labelled at each point with the sector number. By this means, it is possible to calculate the fraction of each sector that was removed during surgery. This is essential for the post-operative tools that predict the motility of each sector of the ventricle. These tools are the subject of a separate paper currently in preparation.
4.7. Validation
The validation phase of the project will start shortly. MRI images of the pre-operative and post-operative states will be available against which to test the predicted outcome. VPH2 is currently running a study with 24 patients, from whom follow-up MRI will be captured two or six months after surgery. The delay between the operation and the follow-up MRI is not ideal for validation, as the shape of the heart could again change in the intervening period, but it does have the advantage of allowing the VPH2 predictions to be compared with the medium-term outcome, which is clinically more important than the immediate post-operative result.
The greatest difficulty in validating the system is not the availability of the before and after images, but in ensuring a true correspondence between the actual surgery and the virtual surgery performed in the simulation. It is not possible to require that a simulation should be exactly replicated in the operating theatre, or that the surgeon should replay the operation immediately afterwards on the computer. While the cardiac surgeons involved will provide as accurate a record of the actual surgery performed to support this process, the project also intends to film the surgery, to record as faithfully as possible the location, shape and size of the cut. This will allow a comparison between the predicted and actual shape of the post-operative LV, and the validation of the VPH2 functional predictive tools that are currently being developed in parallel (see §4.6).
5. Further work
As mentioned in the earlier sections, now that the main features of the system are in place, further work continues to enhance the available facilities and to improve the running of the system. In addition to the integration with the VPH2 assessment tools mentioned previously in §4.6, and the validation discussed in §4.7, further work will complete the surgical simulation tool described in §4, including the visualization of the septum and the vasculature on the epicardium and the pressurization of the mass-spring model.
6. Conclusions
Ischaemic HF remains a significant health and economic problem worldwide despite continued progress in treatment. The VPH2 project is currently developing an integrated system for patient-specific treatment planning in the case of LVD. In this paper, we have presented a user-friendly visualization system for surgical planning and simulation, which forms part of this.
The proposed system allows the user to visualize the dysfunctional LV and the degree of ischaemic damage interactively, and to simulate the surgical procedures of cutting, patching and stitching. A spring-mass model predicts how the ventricle will deform to its post-operative shape and further work will make available quantitative predictions of the post-operative shape and volume to other parts of the treatment planning pipeline in VPH2.
Acknowledgements
This work is partially supported by the European Commission, under the Information and Communication Technologies programme, within the VPH2 project (FP7-ICT-2-224635).
Footnotes
www.vph2.eu. VPH2 is ‘The Virtual Pathological Heart of the Virtual Physiological Human’; it should not be confused with the VPH programme, of which it forms a part.
One contribution of 17 to a Theme Issue ‘The virtual physiological human’.
References
- 1.Lloyd-Jones D., et al. 2010. AHA statistical update. Heart disease and stroke statistics—2010 update: a report from the American Heart Association. Circulation 121, e46–e215. 10.1161/CIRCULATIONAHA.109.192667 ( 10.1161/CIRCULATIONAHA.109.192667) [DOI] [PubMed] [Google Scholar]
- 2.Stewart S., Jenkins A., Buchan S., McGuire A., Capewell S., McMurray J. J. V. 2002. The current cost of heart failure to the National Health Service in the UK. Eur. J. Heart Fail. 4, 361–371. 10.1016/S1388-9842(01)00198-2 ( 10.1016/S1388-9842(01)00198-2) [DOI] [PubMed] [Google Scholar]
- 3.Remme W. J., Swedberg K. 2001. Guidelines for the diagnosis and treatment of chronic heart failure. Eur. Heart J. 22, 1527–1560. 10.1093/eurheartj/ehi204 ( 10.1093/eurheartj/ehi204) [DOI] [PubMed] [Google Scholar]
- 4.Wallen W. J., Rao V. 2010. Surgical remodeling of the left ventricle in heart failure. Ann. Thorac. Cardiovasc. Surg. 16, 72–77. [PubMed] [Google Scholar]
- 5.Tang D., Yang C., Geva T., del Nido P. J. 2007. Patient-specific virtual surgery for right ventricle volume reduction and patch design using MRI-based FSI RV/LV/Patch models. In Proc. IEEE/ICME Int. Conf. on Complex Medical Engineering, CME, 23–27 May 2007, Beijing, China pp. 157–162. [Google Scholar]
- 6.Sorensen T. S., Beerbaum P., Mosegaard J., Rasmusson A., Schaeffter T., Austin C., Razavi R., Greil G. F. 2008. Virtual cardiotomy based on 3-D MRI for preoperative planning in congenital heart disease. Pediatr. Radiol. 38, 1314–1322. 10.1007/s00247-008-1032-5 ( 10.1007/s00247-008-1032-5) [DOI] [PubMed] [Google Scholar]
- 7.Hartyanszky I., Toth A., Veres G., Berta B., Zima E., Szabolcs Z., Acsády G. Y., Merkely B., Horkay F. 2010. Successful surgical restoration of a giant immature left ventricular aneurysm with computer assisted ventricle engineering. Intervent. Med. Appl. Sci. 2, 66–69. 10.1556/IMAS.2.2010.2.4 ( 10.1556/IMAS.2.2010.2.4) [DOI] [Google Scholar]
- 8.Ionasec R., et al. 2010. Patient-specific modeling of the heart: applications to cardiovascular disease management. Lecture Notes in Computer Science: Statistical Atlases and Computational Models of the Heart. 6364, 14–24. 10.1007/978-3-642-15835-3_2 ( 10.1007/978-3-642-15835-3_2) [DOI] [Google Scholar]
- 9.Foley P. W. X., Leyva F., Frenneaux M. P. 2009. What is treatment success in cardiac resynchronization therapy? Europace 11, v58–v65. 10.1093/europace/eup308 ( 10.1093/europace/eup308) [DOI] [PMC free article] [PubMed] [Google Scholar]
- 10.Aranda J. M., Conti J. B., Johnson J. W., Petersens-Stejskal S., Curtis A. B. 2004. Cardiac resynchronization therapy in patients with heart failure and conduction abnormalities other than left bundle-branch block: Analysis of the multicenter insync randomized clinical evaluation (MIRACLE). Clin. Cardiol. 27, 678–682. 10.1002/clc.4960271204 ( 10.1002/clc.4960271204) [DOI] [PMC free article] [PubMed] [Google Scholar]
- 11.Auger D., van Bommel R. J., Bertini M. 2010. Prevalence and characteristics of patients with clinical improvement but not significant left ventricular reverse remodeling after cardiac resynchronization therapy. Am. Heart J. 160, 738–743. 10.1016/j.ahj.2010.07.016 ( 10.1016/j.ahj.2010.07.016) [DOI] [PubMed] [Google Scholar]
- 12.Neal M. L., Kerckhoffs R. 2009. Current progress in patient-specific modeling. Brief. Bioinform. 11, 111–126. 10.1093/bib/bbp049 ( 10.1093/bib/bbp049) [DOI] [PMC free article] [PubMed] [Google Scholar]
- 13.Marshall P., Payandeh S., Dill J. 2005. Suturing for surface meshes. In Proc. 2005 IEEE Conf. on Control Applications, Toronto, Canada, 28–31 Aug, pp. 31–36. Piscataway, NJ: IEEE (doi:10.1109/CCA.2005.1507096) [Google Scholar]
- 14.Mosegaard J. 2006. Cardiac surgery simulation. PhD thesis, dept. of Computer Science, University of Aarhus, Denmark [Google Scholar]
- 15.Lin X., McFarlane N. J. B., Zhao Y., Clapworthy G. J., Dong F., Redaelli A. 2010. Visualisation of left ventricular dysfunction in the Virtual Pathological Heart. In Proc. IEEE 7th Int. Conf. on Biomedical Visualization, Medivis10, and 14th IEEE Int. Conf. on Information Visualisation, IV10, London, UK, 27–29 July, pp. 635–640. Piscataway, NJ: IEEE (doi:10.1109/IV.2010.92) [Google Scholar]
- 16.Sethian A. 1999. Level set methods and fast marching methods. Cambridge, UK: Cambridge University Press. [Google Scholar]
- 17.Chan T. F., Vese L. 2001. Active contours without edges. IEEE Trans. Image Process. 10, 266–277. 10.1109/83.902291 ( 10.1109/83.902291) [DOI] [PubMed] [Google Scholar]
- 18.Positano V., Pingitore A., Giorgetti A., Favilli B., Santarelli M. F., Landini L., Marzullo P., Lombardi M. 2005. A fast and effective method to assess myocardial necrosis by means of contrast magnetic resonance imaging. J. Cardiovasc. Magn. Reson. 7, 487–494. 10.1081/JCMR-53630 ( 10.1081/JCMR-53630) [DOI] [PubMed] [Google Scholar]
- 19.Caiani E. G., et al. 2010. Development and validation of automated endocardial and epicardial contour detection for MRI volumetric and wall motion analysis. In Proc. Computing in Cardiology, Cinc 2010, Belfast, UK, 26–29 September, vol. 37, pp. 1083–1086. Missouri, MO: Computers in Cardiology. [Google Scholar]
- 20.Hoppe H., DeRose T., Duchamp T., McDonald J., Stuetzle W. 1992. Surface reconstruction from unorganized points. Proc. ACM SIGGRAPH 92 26, 71–78. 10.1145/133994.134011 ( 10.1145/133994.134011) [DOI] [Google Scholar]
- 21.Amenta N., Choi S., Kolluri R. 2001. The power crust, unions of balls, and the medial axis transform. Comput. Geom. Theor. Appl. 19, 127–153. [Google Scholar]
- 22.Ohtake Y., Belyaev A., Alexa M., Turk G., Seidel P. 2003. Multi-level partition of unity implicits. Proc. ACM SIGGRAPH 03 22, 463–470. 10.1145/1201775.882293 ( 10.1145/1201775.882293) [DOI] [Google Scholar]
- 23.Barequet G., Goodrich M. T., Levi-Steiner A., Steiner D. 2003. Straight-skeleton based contour interpolation. In Proc. 14th Annual ACM-SIAM Symp. on Discrete Algorithms, Baltimore, MD, USA, 12–14 January, pp. 119–127. Philadelphia, PA: SIAM. [Google Scholar]
- 24.Cohen-Or D., Levin D. 1996. Guided multi-dimensional reconstruction from cross sections. In Advanced Topics in Multivariate Approximation: Proc. of the Int. Workshop, Montecatini Terme, Italy, 27 September–3 October, pp. 47–56. Singapore: World Scientific Publishing. [Google Scholar]
- 25.Raya S., Udupa J. 1990. Shape-based interpolation of multidimensional objects. IEEE Trans. Med. Imag. 9, 32–42. 10.1109/42.52980 ( 10.1109/42.52980) [DOI] [PubMed] [Google Scholar]
- 26.Besl P. J., McKay N. D. 1992. A method for registration of 3-D shapes. IEEE Trans. Pattern Anal. Mach. Intell. 14, 239–255. 10.1109/34.121791 ( 10.1109/34.121791) [DOI] [Google Scholar]
- 27.Viceconti M., Zannoni C., Testi D., Petrone M., Perticoni S., Quadrani P., Taddei F., Imboden S., Clapworthy G. J. 2007. The Multimod application framework: a rapid application development tool for computer aided medicine. Comput. Methods Programs Biomed. 85, 138–151. 10.1016/j.cmpb.2006.09.010 ( 10.1016/j.cmpb.2006.09.010) [DOI] [PubMed] [Google Scholar]
- 28.Schroeder W., Martin K., Lorensen B. 2002. The Visualization Toolkit. USA: Kitware inc. [Google Scholar]
- 29.Kim R. J., et al. 2000. The use of contrast-enhanced magnetic resonance imaging to identify reversible myocardial dysfunction. New England J. Med. 343, 1445–1453. 10.1056/NEJM200011163432003 ( 10.1056/NEJM200011163432003) [DOI] [PubMed] [Google Scholar]
- 30.Schvartzman P. R., Srichai M. B., Grimm R. A., Obuchowski N. A., Hammer D. F., McCarthy P. M., Kasper J. M., White R. D. 2003. Nonstress delayed-enhancement magnetic resonance imaging of the myocardium predicts improvement of function after revascularisation for chronic ischemic heart disease with left ventricular dysfunction. Am. Heart J. 146, 535–541. 10.1016/S0002-8703(03)00318-1 ( 10.1016/S0002-8703(03)00318-1) [DOI] [PubMed] [Google Scholar]
- 31.Meir U., Lopez O., Monserrat C., Juan M. C., Alcaniz M. 2005. Real-time deformable models for surgery simulation: a survey. Comput. Methods Programs Biomed. 77, 183–197. 10.1016/j.cmpb.2004.11.002 ( 10.1016/j.cmpb.2004.11.002) [DOI] [PubMed] [Google Scholar]
- 32.Hauth M., Etzmuss O., Strasser W. 2003. Analysis of numerical methods for the simulation of deformable models. Visual Comput. 19, 581–600. 10.1007/s00371-003-0206-2 ( 10.1007/s00371-003-0206-2) [DOI] [Google Scholar]


