Abstract
Background
People with type 1 diabetes mellitus (T1DM) are at risk for exercise-induced hypoglycemia. Prevention of such hypoglycemia in a closed-loop setting is a major challenge. Markers for automated detection of physical activity could be heart rate (HR) and body acceleration counts (AC). Correlations between HR, AC, and glucose concentrations before and after moderate intensity exercise were examined in T1DM patients during open- loop control.
Method
Eleven T1DM subjects treated with an insulin pump performed moderate intensity exercise of 30 min. Glucose profiles, insulin concentrations, HR, and acceleration were measured.
Results
Mean (range) glucose decrease during exercise was 1.4 (0 to 3.3) mmol/liter. The mean increase in HR was 45.2 beats per minutes (15 to 106 bpm). Mean increase in AC was 18,000 (3,000 to 25,000). No correlations were seen between the glucose drop and HR or AC. A trend was observed between the increase in HR and increase in AC.
Conclusion
Moderate intensity exercise resulted in increased HR and body AC while it decreased glucose concentrations but, in this real-time setting, no association could be demonstrated between the glucose decrease and increase in HR or AC.
Keywords: acceleration, closed loop, exercise, heart rate
Introduction
One of the obstacles in the development of the artificial pancreas is glucose regulation during and after physical activity. The effect of exercise on glucose homeo-stasis is complex; acute and late effects as well as the intensity of the exercise are relevant.
During physical activity, the glucose transporter protein 4 (GLUT-4) is recruited to the cell membrane and glucose uptake takes place in the skeletal muscle. This glucose lowering effect will take off during exercise and persist after exercise for about 90 min.1 This time interval is variable; in an athlete’s muscle, GLUT-4 is upregulated and therefore the glucose lowering effect persists longer.2
The enhanced muscle insulin sensitivity for glucose uptake in the post-exercise state is responsible for the ongoing effect of exercise on glucose homeostasis for several hours. This effect is regulated by a combination of serum factors, autocrine/paracrine mechanisms, and muscle glycogen concentrations.3 People with type 1 diabetes mellitus (T1DM) are prone to develop hypo-glycemia because of these acute and delayed effects of exercise. Intensity of exercise influences the risk of post-exercise hypoglycemia. Continuous moderate-intensity physical activity with intermittent high-intensity exercise protect athletes against nocturnal hypoglycemia compared with continuous moderate-intensity exercise.4 Intense exercise for a short duration with a maximal aerobic capacity of more than 80% will often cause an increase in glucose concentrations.5
The challenge for the closed loop is to prevent exercise-induced hypoglycemia or hyperglycemia. Depending on the type of algorithm, glucose excursions are controlled reactively (proportional integral derivative) or by prediction (model predictive control). Most algorithms have glucose measured by continuous glucose monitoring (CGM) as input. The accuracy of CGM is lower during fast changes in glucose concentrations, increasing the risk for hypoglycemia during closed-loop control.6
A marker to detect physical activity could improve the performance of both types of algorithms. Heart rate (HR) and acceleration counts (AC) are good candidates and are easy-to-measure markers of physical activity. Therefore, we examined the relation of HR and AC on glucose concentrations before and after 30 min of moderate intensity exercise in T1DM patients during open-loop control.
Methods
Subjects
Subjects with T1DM treated with continuous sub-cutaneous insulin infusion (CSII) for more than 6 months and aged between 18–70 years were included. All subjects gave written informed consent. The ethics committee of the Academic Medical Center at the University of Amsterdam approved the studies.
Study Procedures
Two studies were performed that both included moderate intensity physical activity. A total of 11 subjects were included, 9 in the first study and 2 in the second. Physical activity consisted of 30 min cycling on a home trainer. The exercise intensity was set at 80% of the HR reserve. Heart rate reserve is defined as 220 minus age minus HR at rest. The choice to adapt insulin adminis-tration by CSII during exercise was left to the patient, according to what the patient would do in daily life.
Study 1
Nine subjects performed 30 min exercise 3 h after a non-standardized meal. Mean (minimum and maximum) carbohydrates count was 42 (15–85) g. Venous glucose and venous insulin concentrations were measured every 5 min. Heart rate and AC were measured using a portable data logger (Porti, Twente Medical System International, Oldenzaal, The Netherlands). Three self-adhesive electrodes on the thorax measured HR. These were connected via cables to the data logger.
Acceleration counts were measured with a triaxial accelerometer (ACM): in anteroposterior (Z), mediolateral (X) and vertical direction (Y). The ACM was connected to the data logger and located close to the body between the waist and the hip. The memory card of the data logger was read out and the signals were stored on a personal computer. These signals were converted with help of corresponding software. In two subjects, HR and AC were not reported because of imperfections in skin contact that led to measurement noise.
Study 2
Two subjects performed 30 minutes exercise 2 h after a standardized breakfast of 40 g carbohydrates. Venous glucose concentrations were measured every 10 min. Electrodes of the home trainer measured HR. Insulin concentrations and AC were not measured in this study.
Analytical Methods
Insulin assay
Insulin was assayed with an Immulite system (Siemens Healthcare Diagnostics B.V., Breda, The Netherlands). The inter-assay coefficient of variation was 7% at 60 pmol/liter and 4.5% at 120 pmol/liter and had a detection limit of 15 pmol/liter.
The assay was not able to detect insulin concentrations when the basal insulin delivery rate was below 1.1 IU/h.
Glucose assay
Glucose was measured with a hexokinase method on a Hitachi Modular P800 system (Roche Diagnostics, Almere, The Netherlands).
Statistics
To study the effect of exercise on glucose profiles, venous glucose concentrations before exercise (at time zero) and immediately after exercise (at time 30 min) were analyzed with the paired Student’s t-test. The effect of insulin administration interruption or non-interruption during exercise was analyzed with the independent Student’s t-test. All data are given as mean with standard deviation (SD) or minimum and maximum, or as median with a range of minimum and maximum. P values < 0.05 were considered statistically significant.
Possible associations between change in venous glucose (before vs after exercise) and change in HR during exercise (rate after exercise minus rate before exercise) or glucose and acceleration (rate after exercise minus rate before exercise) were analyzed with linear regression analysis.
Results
Three out of 11 subjects included were female. Mean (SD) age was 46.8 (13.2) years, mean HbA1c 7.8 (1.0) %, mean duration of diabetes 30.2 (11.8) years and mean duration of pump use 12.7 (9.1) years. Four subjects had peripheral polyneuropathy, one of whom also used a beta-blocker.
Glucose Profiles during Exercise
Mean (range) venous glucose concentration before exercise was 9.8 (3.8–16.8) mmol/liter compared to mean glucose after exercise 8.4 (2.8-14.9) mmol/liter, p = 0.02. Mean glucose decrease during exercise was 1.4 (0 to 3.3) mmol/liter.
Insulin Pump Handling during Exercise
Before starting to exercise, seven subjects did not change the infusion rate of the insulin pump. Mean (range) basal insulin administration rate during exercise in these seven subjects was 0.62 (0.2-1.35) IU. The other four subjects stopped CSII administration during and after exercise, for 40, 49, 60 and 69 min, respectively. This corresponded to a reduction of 4.4, 5.6, 3.8 and 6.2% of their total daily insulin dose. The glucose drop in the group that did not interrupt CSII administration was 1.4 (0.1 to 3.2) mmol/liter. The glucose decrease in the four subjects that did interrupt CSII administration was 1.4 (0 to 3.3) mmol/liter. Thus, interruption of insulin administration did not influence the glucose profiles during exercise, p = 0.94.
Insulin Profiles during Exercise
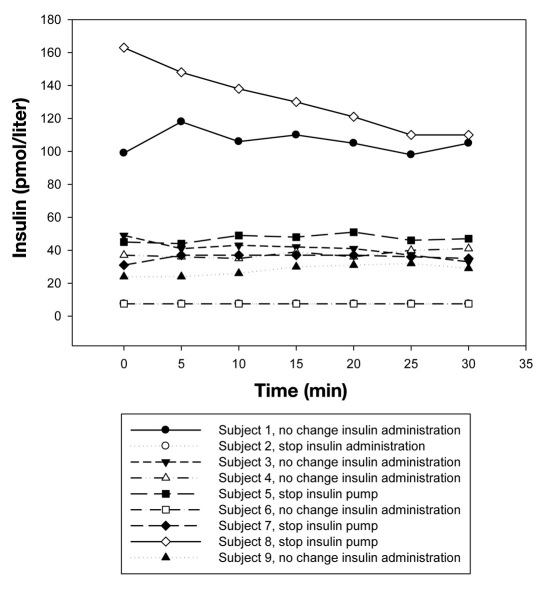
Insulin profiles were measured in nine subjects. Venous insulin concentrations were plotted against the duration of exercise. In general, no changes in insulin concentrations were seen except for subject 8 who stopped insulin administration for 69 min (Figure 1). In subject 2 and subject 6, insulin levels were below 7.5 pmol/liter and therefore, the lines overlap.
Figure 1.
Venous insulin concentrations during exercise.
Heart Rate
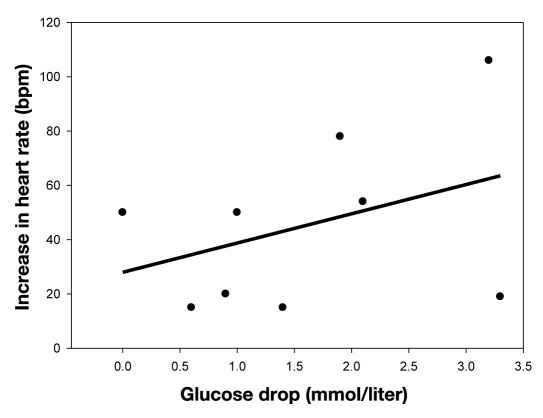
During exercise, HR increased in all patients. Mean increase in HR was 45.2 beats per minutes (bpm; range 15– 106 bpm). No associations were found between increase in HR and the decrease in venous glucose concentrations, r = 0.35, R2 = 0.12; p = 0.35, n = 9 (Figure 2).
Figure 2.
Correlation between the increase in heart rate and decrease in venous glucose concentrations.
Acceleration Counts
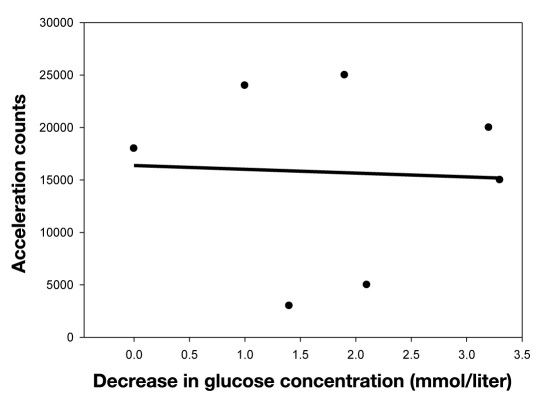
During exercise, AC increased. Mean increase was 18,000 (range 3000–25,000). No associations were found between AC and decrease in venous glucose concentrations, r = 0.14, R2 = 0.02, p = 0.76, n = 7, (Figure 3).
Figure 3.
Correlation between the increase of acceleration counts and decrease in venous glucose concentrations.
Correlation Heart Rate and Acceleration Counts
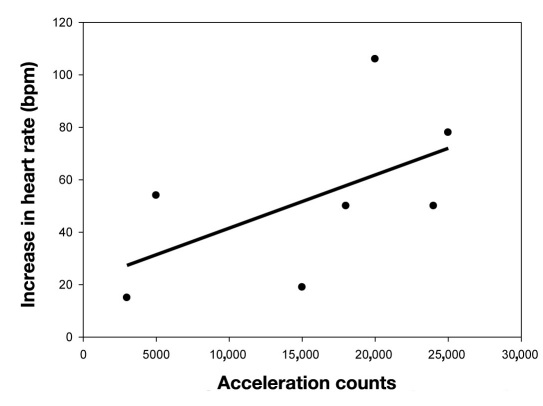
A trend was demonstrated between the increase in HR and increase in AC: r = 0.61, R2 = 0.38, p = 0.14, n = 7 (Figure 4).
Figure 4.
Correlation between increase in heart rate and acceleration counts.
Discussion
In this small study, moderate intensity exercise in T1DM patients treated with CSII resulted in an increased HR and body acceleration while it decreased glucose concentrations. No association could be demonstrated between the decrease in glucose concentrations and increase in HR (n = 11) or AC (n = 7).
An increase in HR and AC was seen in all patients. Thus, both variables are indicators of physical activity and are candidate parameters for a glucose control model. Heart rate is probably preferable, because most accelerometers have been tested in laboratory conditions only and not in real-world activity.7
Breton8 presented mathematical models of glucose homeo-stasis during exercise that incorporated HR as a marker for exercise. The minimal model was adapted and was fitted successfully to data derived from exercise performed by 21 T1DM patients during a hyperinsulinemic clamp. The lack of association in our study between glucose decrease and increase in HR could be due to the real-time setting versus the clamp setting. In other words, the insulin levels were different per subject in our study. The limited number of patients in our studies could be an alternative explanation, however, it is unlikely that a subject pool two or three times larger would substantially alter the lack of association between increase in HR and glucose decrease following exercise. Four of our nine participants showed a decrease in glucose with a minimal increase in HR (less than 20 bpm), indicating a high level of physical fitness, where exercise-induced glucose uptake is high due to upregulation of GLUT4 but increase in HR is low. Alternatively, the lack of change in HR could have been due to autonomic neuropathy in these subjects. Two of the four patients with a minimal increase in HR were known to have peripheral neuropathy. However, the lack of an association between AC and decrease in glucose cannot be confounded by autonomic neuropathy. The one subject using beta-blockade did show an increase in HR. Because ACM cannot differentiate between the workload of the exercise, AC did not predict the energy expenditure very well, but ACM was able to detect physical activity.9 This could explain why no correlation was found between glucose concentration and AC.
The next challenge before HR can be included in a glucose control model is differentiation between a transient or substantial HR increase. Substantial physical activity can be defined as any physical activity that influences glucose metabolism. So transient HR increases due to short-term physical activity or other causes need to be excluded. Therefore, a threshold in time might be used for the HR acceleration. Beyond this time threshold, for example, 10 min, the administration rate of insulin would be changed. The rate could be diminished or stopped after 10 min of increased HR until the HR normalizes or even thereafter.
Most subjects did not adjust the insulin rate during exercise probably because they underestimated the effect of insulin on exercise. A change in basal rate of CSII will influence the glucose levels after 30–60 min, much longer than generally anticipated.10 Education on this topic in subjects treated with CSII may be improved to lower insulin levels substantially during exercise. In a closed-loop setting, exercise announcement several hours before the exercise is most likely needed to enable a timely decrease in insulin rate before the actual start of physical activity.
In conclusion, exercise in closed loop is a major challenge as moderate intensity exercise resulted in increased HR and body AC while it decreased glucose concentrations, but no association could be demonstrated between the glucose decrease and increase in HR or AC.
Glossary
Abbreviations
- (AC)
acceleration counts
- (ACM)
accelerometer
- (bpm)
beats per minute
- (CGM)
continuous glucose monitoring
- (CSII)
continuous subcutaneous insulin infusion
- (GLUT-4)
glucose transporter type 4
- (HR)
heart rate
- (T1DM)
type 1 diabetes mellitus
References
- 1.Thorell A, Hirshman MF, Nygren J, Jorfeldt L, Wojtaszewski JF, Dufresne SD, Horton ES, Ljungqvist O, Goodyear LJ. Exercise and insulin cause GLUT-4 translocation in human skeletal muscle. Am J Physiol. 1999;277(4) Pt 1:E733–41. doi: 10.1152/ajpendo.1999.277.4.E733. [DOI] [PubMed] [Google Scholar]
- 2.Dohm GL. Invited review: Regulation of skeletal muscle GLUT-4 expression by exercise. J Appl Physiol. 2002;93(2):782–787. doi: 10.1152/japplphysiol.01266.2001. [DOI] [PubMed] [Google Scholar]
- 3.Goodyear LJ, Kahn BB. Exercise, glucose transport, and insulin sensitivity. Annu Rev Med. 1998;49:235–261. doi: 10.1146/annurev.med.49.1.235. [DOI] [PubMed] [Google Scholar]
- 4.Iscoe KE, Riddell MC. Continuous moderate-intensity exercise with or without intermittent high-intensity work: effects on acute and late glycaemia in athletes with Type 1 diabetes mellitus. Diabet Med. 2011;28(7):824–832. doi: 10.1111/j.1464-5491.2011.03274.x. [DOI] [PubMed] [Google Scholar]
- 5.Marliss EB, Vranic M. Intense exercise has unique aspects on both insulin release and its role in glucoregulation: implications for diabetes. Diabetes. 2002;51(Suppl 1):S271–83. doi: 10.2337/diabetes.51.2007.s271. [DOI] [PubMed] [Google Scholar]
- 6.Wolpert HA. The nuts and bolts of achieving end points with real-time continuous glucose monitoring. Diabetes Care. 2008;31(Suppl 2):S146–9. doi: 10.2337/dc08-s238. [DOI] [PubMed] [Google Scholar]
- 7.Plasqui G, Westerterp KR. Physical activity assessment with accelerometers: an evaluation against doubly labeled water. Obesity (Silver Spring) 2007;15(10):2371–2379. doi: 10.1038/oby.2007.281. [DOI] [PubMed] [Google Scholar]
- 8.Breton MD. Physical activity-the major unaccounted impediment to closed loop control. J Diabetes Sci Technol. 2008;2(1):169–174. doi: 10.1177/193229680800200127. [DOI] [PMC free article] [PubMed] [Google Scholar]
- 9.Jakicic JM, Winters C, Lagally K, Ho J, Robertson RJ, Wing RR. The accuracy of the TriTrac-R3D accelerometer to estimate energy expenditure. Med Sci Sports Exerc. 1999;31(5):747–754. doi: 10.1097/00005768-199905000-00020. [DOI] [PubMed] [Google Scholar]
- 10.Heinemann L, Nosek L, Kapitza C, Schweitzer MA, Krinelke L. Changes in basal insulin infusion rates with subcutaneous insulin infusion: time until a change in metabolic effect is induced in patients with type 1 diabetes. Diabetes Care. 2009;32(8):1437–1439. doi: 10.2337/dc09-0595. [DOI] [PMC free article] [PubMed] [Google Scholar]


