

Abstract
Background
TC-71 Ewing’s sarcoma cells overexpress vascular endothelial growth factor (VEGF) with a shift from the 189 to the 165 isoform.
Methods
The effect of CAPER-α on the expression of the VEGF isoforms, tumor growth, and vessel density was analyzed following transfection of TC-71 cells with CAPER-α cDNA or siRNA.
Results
CAPER-α correlated inversely with the VEGF165/VEGF189 mRNA ratio. Upregulation of CAPER-α resulted in decreased tumor growth, tumor vessel density and chemotactic activity of the cell’s supernatant. CAPER-α expression was regulated by EWS-FLI-1 through a protein-protein interaction.
Conclusions
Increased VEGF165 expression is secondary to the downregulation of CAPER-α by EWS–FLI-1. CAPER-α mediates alternative splicing and controls the shift from VEGF189 to VEGF165.
Keywords: Ewing’s Sarcoma, VEGF, CAPER-α, EWS-FLI-1, Alternative Splicing
Introduction
Vascular endothelial growth factor A (VEGFA) plays a pivotal role in tumor angiogenesis. VEGF isoforms are produced by alternative splicing. The 121, 165, and 189 isoforms predominant in cancer cells (1, 2) and differ in solubility, receptor affinity, and mitogenic potency. VEGF189 is membrane bound, with the highest affinity to heparin and heparan sulfates. It has less angiogenic activity in vivo than VEGF121 and VEGF165 (3, 4). VEGF121 is freely diffusible with no binding to heparin. VEGF165 is also secreted but, unlike VEGF121,has heparin-binding ability and binds to neuropilin resulting in increasedmitogenic effects (5). VEGF165 expression correlates with increased tumor vascularity and a poorer prognosis in osteosarcoma patients (6).
We demonstrated that Ewing’s sarcoma cells overexpress VEGF with a shift in isoform expression from the 189 to the 165 isoform (7, 8). VEGF165 was critical for Ewing’s sarcoma tumor vessel development and growth in vivo and could not be replaced by VEGF189 (8, 9). Molecular cloning of the cDNA for VEGF revealed that VEGF isoform expression was controlled by alternative splicing of different exons (1), which in turn selectively joined different protein coding elements (10). The regulation and expression of the 3 isoforms and what causes a shift from the 189 to 165 isoform have not been defined.
CAPER-α, a transcriptional coactivator ofAP-1, ERα, and ERβ (11), alters the ratio of VEGF121 and VEGF189 in breast cancer cells (12). We now demonstrate that CAPER-α mediates alternative splicing and controls the shift from VEGF189 to VEGF165 in Ewing's cells. Down-regulation of CAPER-α resulted in an increase in the ratio of VEGF165 to VEGF189 (VEGF165/VEGF189). Transfection of CAPER-α into TC-71 cells lowered the VEGF165/ VEGF189 ratio and led to decreased tumor vessel density and growth in vivo. We also demonstrate that EWS- FLI-1inhibits CAPER-α expression mediated by protein-protein interaction.
Materials and Methods
Plasmids
pSilencer2.1-U6 hygro plasmid (Ambion, Austin, TX) was used to construct vector-expressing hairpin small interfering RNA (siRNA) to suppress CAPER-α expression (9,12). CAPER-α cDNAs were isolated and amplified from TC-71 cells by RT-PCR (11). PCR primers were 5’-CTCGGATCCGGAATGGCAGACG-3’ (forward) and 5’-CCTCTAGATCATCGTCTACTTGGAAC-3’ (reverse), with BamHI and XbaI recognition sites (underlined) on the ends. The CAPER-α–GFP vector, with GFP attached to the COOH terminus, was constructed by subcloning the full-length CAPER-α cDNA fragments into the pEGFP-C1 plasmid (Clontech, Mountain View, CA). The plasmid expressing c-Myc peptide epitope-tagged CAPER-α was constructed by subcloning of the full-length CAPER-α cDNA fragments into the pcDNA 3.1 vector (Invitrogen).
CAPER-α–pLV was constructed by inserting CMV promoter-driven CAPER-α cDNA into the 3’ long terminal repeat of pWPXL, a lentivirus vector that contains the internal ribosome entry site driving GFP expression, as described previously (13). pLV vector was the control. EWS FLI-1 siRNAs were described previously (14). All the constructs were confirmed by DNA sequencing. Plasmids expressing M2-Flag–tagged EWS–FLI-1, EWS, or FLI-1 were provided by Dr. Liu Yang (the University of Washington School of Medicine, Seattle, WA).
Cell lines, Transfection, and transduction
293T human embryonic kidney cells (American Type Culture Collection, ATCC); human Ewing’s sarcoma cells TC-71 (14), A4573 (14), RD-ES (ATCC), and SK-ES (ATCC); mouse lung vessel endothelial cells (MLVECs) (Dr. Robert Langley, M. D. Anderson Cancer Center, Houston, TX); murine bone marrow-derived mesenchymal stem cells (MSCs) were cultured as previously (14,15). Normal human osteoblasts (NHOst; Clonetics, Inc. San Diego, CA) were cultured in osteoblast growthmedium (Clonetics) containing 10% FBS and 100 μg/mL ascorbic acid. All cells were tested for mycoplasma by RT-PCR and verified to be free of pathogenic murine viruses (NCI–Frederick Cancer Research & Development Center, Frederick, MD).
Transient transfection was performed for 48 h with LipofectAMINE 2000 (Invitrogen). Stablesingle-cell colonies of TC-71 cells were selected following incubation in 400 μg/mL hygromycin B. Recombinant lentiviruses, CAPER-α–pLV or pLV, were produced by transient transfection of 293T cells (13) and harvested 24 h after transfection. For transduction, TC-71 cells were plated on 6-well plates (5 × 10⁵cells/well) and then incubated overnight in medium containing recombinant lentivirus vectors. GFP-positive cells were sorted and cultured for in vivo experiments.
RNA and protein analysis
Total RNA was isolated and purified from cultured cells or homogenized tumor tissues using Trizol Reagent (Invitrogen). Reverse transcription was performed with oligo-dT primer (Promega Corp., Madison WI), followed by PCR using an iTaq DNA polymerase kit (Bio-Rad Laboratories, Hercules, CA) with specific PCR primers for VEGF isoforms (16), VEGF165b (17), EWS–FLI-1( forward, 5’-GCCTCCTATGCAGCTCAGTC-3’; reverse, 5’-GGTTGTAACCCCCTGTGCTA-3’), and VEGF receptor-2 (VEGFR-2; forward, 5′-GTGACCAACATGGAGTCGTG-3′; reverse, 5′-TGCTTCACAGAAGACCATGC-3′). The glyceraldehyde-3-phosphate dehydrogenase mRNA level was the internal control. Quantification of PCR results was performed using Scion image software (Scion Corporation, Washington, DC).
VEGF mRNA isoforms were quantified by real-time PCR using an iQ SYBR Green Supermix (Bio-Rad) and previously described PCR primers (18). Each DNA sample was analyzed by three replicate assays. β-actin mRNA was quantified for normalization.
Nuclear protein was extracted from cultured cells at 80% confluence or 48 h after transfection. Cells were lysated in Buffer A (10 mM HEPES [pH 7.9], 2.5 mM MgCl2, 100 mM NaCl, 0.5 mM DTT, and 1× protease inhibitor(Calbiochem)) at 4oC until >90% cells were trypan blue (Sigma-Aldrich) positive. After centrifugation (12,000 × g at 4oC), the nuclear pellets were resuspended in Buffer C (20 mM HEPES [pH 7.9], 25% glycerol, 1.5 mM MgCl2, 450 mM NaCl, 0.2 mM EDTA, 0.5 mM DTT, and 1× protease inhibitor) and then incubated for 30 min at 4oC, followed by centrifugation. Supernatants were collected as nuclear proteins. Tumor tissue lysates were homogenized in lysis buffer (20 mmol/L HEPES [pH 7.4], 1% Triton X-100, 10% glycerol, and 1× protease inhibitor) and then centrifuged (12,000× g at 4oC). The protein was denatured, loaded ontoa 10% SDS-polyacrylamide gel and then transferred to a nitrocellulosemembrane (Amersham, Piscataway, NJ). Western blot analysis using anti-human HCC1 (CAPER-α) antibody (Abcam Inc., Cambridge, MA, or Bethyl Laboratories, Inc., Montgomery, TX), anti-TATA box binding protein antibody (Abcam Inc.), anti-human FLI-1 polyclonal antibody (Santa Cruz Biotechnology, Santa Cruz, CA) and β-actin antibody (Sigma Chemical) was performed using the enhanced chemiluminescence (Amersham Biosciences, Piscataway, NJ). EWS–FLI-1 protein (~68 kD) was detected by the anti–FLI-1 antibody and was distinguished from FLI-1 protein (~54 kD) by its molecular weight (19). Quantification of results was performed using Scion image software (Scion Corporation, Washington, DC).
For coimmunoprecipitation, after precleaning with mouse IgG, 0.2 mL of nuclear proteins were incubated with anti–c-Myc monoclonal antibody (Theroma Fisher Scientific, Fremont, CA) overnight. A/G plus agarose (Santa Cruz Biotechnology) was then added and incubated for an additional 3 h at 4°C. After three washes with NP-40 buffer (50 mM Tris [pH 7.5], 150 mM NaCl, and 0.05% NP-40), the immunoprecipitates were blotted with mouse anti–Flag M2 monoclonal antibody (Sigma-Aldrich) for Western blot analysis.
Migration assay
MLVECs (1 × 10⁵) in transwells were inserted into 24-well plates containing 600 μLof cultured supernatants and incubated at 37°C for 8 h. Migrated cells were fixed, stained with H&E, and quantified in five random high-power fields.
In vivo model
Four- to 5-week-old specific pathogen-free athymic nude mice (Charles River Breeding Laboratories, Wilmington, MA) were maintained in an animal facility approved by the American Association for Accreditation of Laboratory. Animal Care Animal protocols wereapproved by the Institutional Animal Care and Use Committee. TC-71 cells transduced with lentiviruses CAPER-α–pLV (TC–CAPER-α–pLV cells) or pLV (TC–pLV cells) were injected subcutaneously (7). Expression of CD31 and VEGF isoforms in tumor tissues was analyzed by immunohistochemistry and real-time PCR.
Immunohistochemistry and Microscopy
TC-71 cells were fixed in cold acetone and blocked with 4% fish gelatin in PBS. Immunohistochemical staining was performed using primary anti-human HCC1 (CAPER-α) and anti-EWS antibodies. Cells were incubated with primary antibodies overnight, washed in PBS, and incubated with 4% fish gel before the addition of secondary fluorescent antibodies. Cy5-labeled anti-mouse secondary antibodies (Jackson Immunoresearch, West Grove, PA), Alexa488-labeled anti-rabbit secondary antibodies (Molecular Probes, Carlsbad, CA) were used. Nuclei were labeled with Sytox Green (Jackson Immunoresearch). Confocal microscopy images were captured using a Zeiss Laser Confocal Microscope (Carl Zeiss MicroImaging, Inc., Thornwood, NY) and LSM software.
Statistical analysis
Analysis was done usingANOVA and the two-tailed Student’s t test; P < 0.05was considered statistically significant.
Results
CAPER-α expression is inversely correlated with VEGF165
TC-71 cells express higher levels of VEGF165 and minimal or no VEGF189 compared with normal human osteoblast cells (NHOst, 7). To determine whether CAPER-α expression contributes to this isoform shift, we analyzed the expression of CAPER-α in TC-71 cells. NHOst and mesenchymal stem cells (MSCs) were the controls. CAPER-α expression was significantly decreased in TC-71 cells (Fig. 1A) and was inversely correlated with the level of VEGF165 (Fig. 1B). TC-71 cells showed lower levels of VEGF189 and a higher VEGF165/VEGF189 ratio than NHOst cells as calculated by RT-PCR (Fig. 1C). Three other Ewing’s sarcoma cell lines were also analyzed. The level of CAPER-α expression was lowest in TC-71 cells and highest in RD-ES cells (Fig. 1D). As anticipated, RD-ES cells showed higher levels of VEGF189 and lower levels of VEGF165, yielding a lower VEGF165/VEGF189 ratio than that in TC-71 cells (Fig. 1E, 1F). SK-ES and A4573 cells also had higher levels of CAPER-α and lower VEGF165/VEGF189 ratios than TC-71 confirming an inverse correlation between CAPER-α and VEGF165. Thus CAPER-α expression may play a critical role in controlling the expression of VEGF165 and the ratio of VEGF165 to VEGF189.
Figure 1. Expression of CAPER-α and the VEGF isoforms in various cell lines.

Nuclear protein and total RNA were extracted from various cell lines. CAPER-α was detected by Western blot analysis (A and D). TBP was the internal nuclear protein control. The CAPER-α ratio was calculated by comparing the expression level (density) of CAPER-α to that of TBP. Expression of VEGF isoforms was determined by RT-PCR (B and E). The VEGF165/VEGF189 ratio was calculated by comparing the expression level (density) of VEGF165 to that of VEGF189. Real time PCR was also used to calculate the VEGF165/189 ratio (C and F). Bars represent the SD.
CAPER-α alters VEGF165/VEGF189 mRNA ratio
To determine whether the inhibition of CAPER-α affected the expression of VEGF isoforms, a pSilencer plasmid producing CAPER-α siRNA was transfected into TC-71 cells. As measured by Western blot analysis (Fig. 2A), CAPER-α expression in 2 of the stable clones was decreased (TC–siCAPER-α–5 and–11), but not in the TC-siCAPER-α–2 clone. The decreased CAPER-α expression in TC–siCAPER-α–5 cells correlated with an increase in VEGF165 mRNA (Fig. 2B) and an increase in the VEGF165/VEGF189 ratio (Fig. 2C), compared with those in parental TC-71 and TC-si Control cells. Similarly, CAPER-α expression in A4573 cells was decreased following transient transfection with CAPER-α siRNA, resulting in an increase in the VEGF165/VEGF189 ratio (Fig. 2D). Cultured supernatants harvested from TC–siCAPER-α–5 cells induced an increase in the migration of mouse-derived endothelial cells (MLVECs) that express VEGFR-2, compared with supernatants harvested from parental and TC-siControl cells (Fig. 2E). Similar results were seen with the TC–siCAPER-α–11 cells and A4573 cells transfected with Caper-α siRNA (data not shown).
Figure 2. Suppression of CAPER-α increases VEGF165 and the VEGF165/189 ratio.

(A) TC-71 cells were transfected with CAPER-α siRNA. Suppression of CAPER-α in the stable colonies (TC– siCAPER-α –2, –5, and –11) was confirmed by Western blot analyses. (B) VEGF isoforms were quantified by RT-PCR. The VEGF165/VEGF189 ratio was calculated by comparing the expression level of VEGF165 to that of VEGF189. (C) VEGF165/VEGF189 ratio was also calculated using real time PCR. (D) A4573 cells were transfected with CAPER-α siRNA for 48h. CAPER-α expression was confirmed by Western blot analyses. Real time PCR was used to determine the VEGF165/VEGF189 ratio. (E) The cultured supernatants were collected from the different cells and assayed for chemotactic activity using a migration assay for mouse lung vessel endothelial cells (MLVEC). Results are expressed as the average number of migrated cells in 5 random high power fields ± the SD.
Transfection of TC-71 cells with CAPER-α–GFP (TC–CAPER-α–GFP) resulted in expression of GFP and overexpression of CAPER-α. Control GFP-transfected cells (TC–GFP) expressed GFP but no CAPER-α (Fig. 3A). GFP expression in the TC–CAPER-α–GFP cells was localized to the nuclei, whereas TC–GFP control cells showed GFP expression in both nucleus and cytoplasm (Fig. 3B). Upregulation of CAPER-α resulted in a decrease in VEGF165 expression, an increase in VEGF189 expression (Fig. 3C), a decrease in the VEGF165/VEGF189 mRNA ratio (Fig. 3C,D), and a decrease in the chemotactic activity of the cultured supernatant (Fig. 3E), compared to TC-GFP control cells. As detected by ELISA, there was a 25% reduction in secreted VEGFprotein levels in the supernatant from TC–CAPER-α–GFP cells as compared with that in control TC-GFP cells (P<0.001). This is consistent with the decrease in VEGF165 expression as VEGF189 is primarily membrane bound. These results indicate that upregulation of CAPER-α decreased both VEGF165 expression and protein production as well as the chemotactic activity of the cultured supernatant for endothelial cells.
Figure 3. Up-regulation of CAPER-α decreases VEGF165 and the VEGF165/VEGF189 ratio.
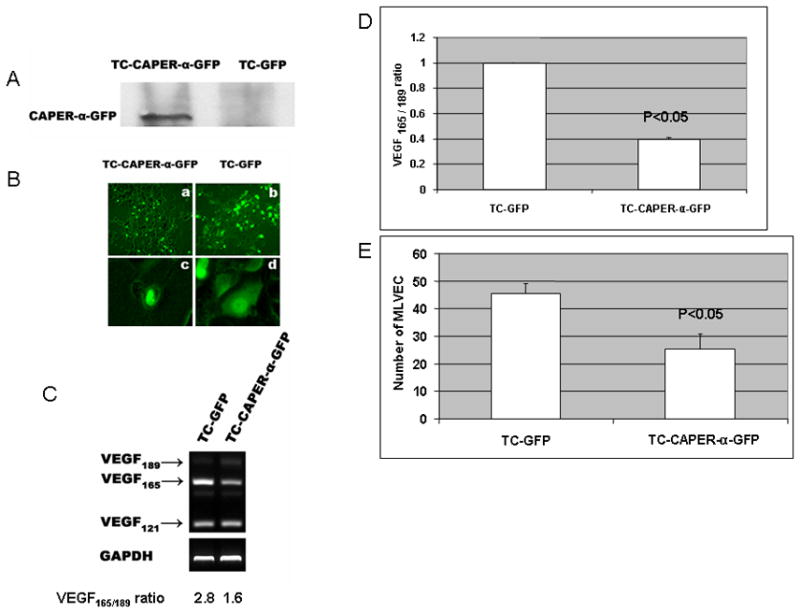
TC-71 cells were transiently transfected with pEGFP–CAPER-α (TC–CAPER-α–GFP) or control pEGFP (TC-GFP) cDNA. (A) Expression of CAPER-α was confirmed by Western blot. (B) Expression of GFP was assessed by microscopy. In TC–CAPER-α–GFP cells, GFP expression was localized in the nuclei (a, magnification ×40 and c, magnification ×200). GFP was expressed in both cytoplasm and nuclei in the control transfected TC-GFP cells (b, magnification ×40 and d, magnification ×200). (C) Expression of VEGF isoforms was analyzed by RT-PCR. (D) Real time PCR was used to determine the VEGF165/VEGF189 ratio. (E) Supernatants were collected separately from the different cultured cells and analyzed for chemotactic activity using MLVEC cells. Results are expressed as in Fig 2E.
Upregulation of CAPER-α expression inhibits TC-71 tumor formation in vivo
VEGF165 is critical for TC-71 growth in vivo (7–9). Selective inhibition of VEGF165 resulted in the suppression of tumor growth which could not be rescued by VEGF189 (8). We investigated the effect of up-regulation of CAPER-α expression on TC-71 tumor growth in vivo. TC-71 cells were transfected with CAPER-α–pLV or pLV control vector. Increased CAPER-α expression was seen in cells after transfection with CAPER-α-pLV (Fig. 4A). TC–CAPER-α–pLV or TC–pLV cells were injected subcutaneously. Tumor formation (Fig. 4B) and tumor vessel density (Fig. 4C, D) following the subcutaneous injection of TC-CAPER-α–pLV cells were significantly inhibited compared with the TC-pLV control cells. RNA was extracted from the excised tumors at the time of sacrifice and then analyzed by RT-PCR for VEGF165 expression. As expected, TC–CAPER-α–pLV tumors showed decreased VEGF165 compared with control TC-pLV tumors (Fig. 4E).
Figure 4. Effects of CAPER-α on tumor growth and tumor vessel density in vivo.

TC-71 cells were transduced with CAPER-α–pLV or pLV alone. (A) Increased CAPER-α expression was confirmed by Western blot analyses. (B) Tumor growth was monitored after subcutaneous injection of TC–CAPER-α–pLV or TC-pLV cells. (C) Representative CD31 staining (red), Hoechst staining (blue) and GFP expression in tumor tissue sections. (D) Mean tumor vessel density was calculated by counting the number of CD31-positive blood vessels in five random microscopic fields + SD. (E) Expression of VEGF165 in the TC–CAPER-α-pLV or TC–pLV tumors was assayed by RT-PCR. GAPDH was used as the loading control. (F) VEGFR-2 and VEGF165b was assayed by RT-PCR following transduction of TC-71 cells with pLV control or CAPER-α-pLV.
The suppression in tumor formation could not be explained by a change in the doubling time of the TC-CAPER-α cells (29.6 h) versus the TC-pLV cells (26.1 h, p=0.36), to a decrease in VEGFR-2 (Fig. 4F) or to the increased expression of VEGF165b (Fig. 4F), an anti-angiogenic isoform of VEGF165 (17). These data indicate that the effect of CAPER-α on tumor growth was secondary to the alteration of VEGF165.
Effect of EWS-FLI-1 on CAPER-α expression
EWS–FLI-1 regulates several downstream genes including VEGF (20, 21). Because of the link between EWS–FLI-1 and VEGF (20, 21) and our findings that the expression of CAPER-α inversely correlates with the expression of VEGF165, we investigated whether EWS–FLI-1 regulated CAPER-α expression. TC-71 cells were transfected with EWS FLI-1 siRNA. TC-siEWS–FLI-1 cells showed decreased expression of EWS–FLI-1 and increased CAPER-α expression (Fig. 5A). Similarly, A4573 cells were transiently transfected with EWS-FLI-1 siRNA to decrease expression of EWS–FLI-1, resulting in increased expression of CAPER-α (Fig. 5B). By contrast, transfection of EWS–FLI-1 into mesenchymal stem cells (MSC) using cDNA transfection led to decreased CAPER-α expression (Fig. 5B). We found evidence of a protein-protein interaction between CAPER-α and EWS–FLI-1 in TC-71 cells as determined by immunoprecipitation (Fig. 5C). These results suggest that EWS–FLI-1 down-regulated CAPER-α expression. To confirm this interaction, a co-immunoprecipitation assay was performed. HEK293 cells were co-transfected with a plasmid expressing c-Myc–tagged CAPER-α and another plasmid expressing Flag-tagged EWS–FLI-1, EWS alone, FLI-1 alone or a neo control. HEK293 cells were also transfected with a plasmid expressing Flag-tagged EWS–FLI-1, EWS, FLI-1 alone, or a neo control. After immunoprecipitation with anti–c-Myc antibody, immunoblotting with anti-Flag antibody demonstrated that only EWS–FLI-1 and EWS proteins were detected in HEK293 cells co-transfected with c-Myc–tagged CAPER-α and Flag-tagged EWS–FLI-1 or EWS, but not in the cells only transfected with Flag-tagged EWS–FLI-1 or EWS , indicating that CAPER-α interacted with EWS–FLI-1 and EWS, but not with FLI-1(Fig. 5D) in HEK293 cells. This interaction was further confirmed by the colocalization of the EWS and CAPER-α in TC-71 cells (Fig. 5E). Furthermore, transfection of EWS–FLI-1 into MSC led to increased VEGF165 expression as assessed by RT-PCR (Fig. 5F). These results suggest that EWS–FLI-1 decreased CAPER-α expression by a mechanism that involves a protein-protein interaction in TC-71 cells. This down- regulation of CAPER-α may in turn result in increased VEGF165 expression and an increased VEGF165/VEGF189 ratio.
Figure 5. EWS–FLI-1 interacts with CAPER-α.
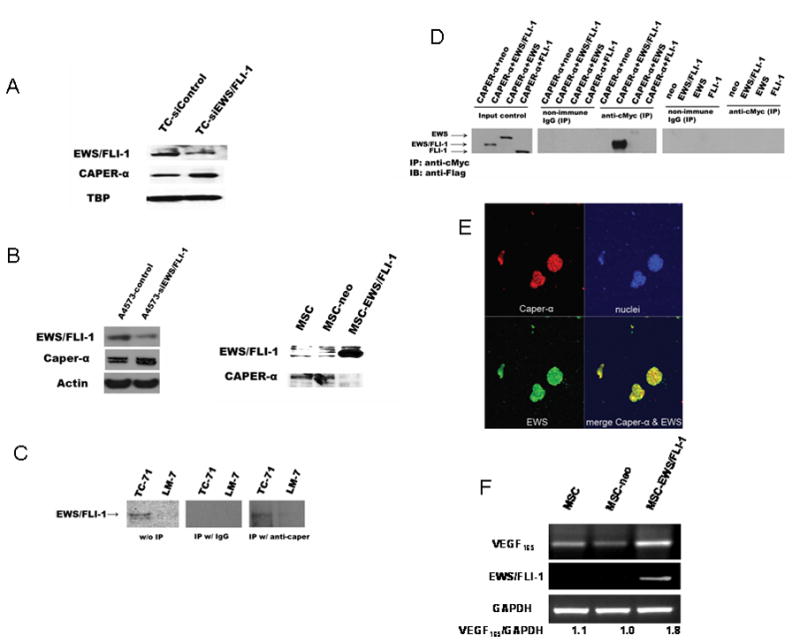
(A) TC-71 cells were transiently transfected twice, 48 h apart, with EWS–FLI-1 siRNA. CAPER-α and EWS-FLI-1 expression were quantified by western blot analysis. (B) A4573 cells were transiently transfected for 48h with EWS–FLI-1 siRNA. EWS–FLI-1 and CAPER-α expression were quantified by western blot analysis. Mesenchymal stem cells (MSCs) were transfected with EWS–FLI-1 (MSC EWS FLI-1) or vector only (MSC-neo). CAPER-α and EWS FLI-1 expression were determined by western blot analysis. (C) Cell lysates prepared from TC-71 were immunoprecipitated with either anti CAPER-α antibody or IgG control. The immunoprecipitates as well as cell lysates without immunoprecipitation as inputs were then blotted with the anti FLI-1 antibody. Cell lysates of LM-7 osteosarcoma cells were used as the negative control because these cells do not express EWS FLI-1. (D) HEK-293T cells were cotransfected with plasmids expressing the c-Myc peptide epitope tagged CAPER-α and plasmids expressing Flag-tagged EWS FLI-1, EWS, FLI-1, or neo vector control, or were only transfected with plasmids expressing Flag-tagged EWS FLI-1, EWS, FLI-1, or neo vector control. The cell lysates were first incubated with anti c-Myc antibody to immunoprecipitate c-Myc tagged CAPER-α or incubated with non-immune IgG as a control. The immunoprecipitates were then blotted with anti Flag M2 monoclonal antibody to detect Flag-tagged proteins. Total cell lysates, without immunoprecipitation, were also blotted with anti Flag M2 monoclonal antibody as an input control. IP immunoprecipitates; IB immunoblots. (E) TC-71 cells were analyzed by IHC using anti-CAPER-α (red) and anti-EWS (green) antibodies. Yellow staining depicts colocalization between EWS and CAPER-α. Nuclei staining (blue). (F) MSCs were transfected with EWS–FLI-1 (MSC EWS FLI-1) or vector only (MSC-neo). VEGFand EWS-FLI-1 expression was determined by RT-PCR. The ratio of VEGF165 to GAPDH was quantified.
Discussion
Expression of CAPER-α, a transcriptional co-activator for steroid receptors, was inversely correlated to the expression of VEGF165 and the VEGF165/VEGF189 ratio in 3 different Ewing’s sarcoma cell lines. Increasing or decreasing CAPER-α expression resulted in a change in VEGF165 expression and in the chemotactic activity of cultured tumor cell supernatants for endothelial cells. The antibody used in the commercial ELISA kit to quantify VEGF165 may also bind to the 121 isoform. Although we did not detect a change in VEGF121 expression some of the decreased chemotactic activity of the cultured supernatants from the TC-CAPER-α-GFP cells may be due to a reduction in VEGF121 in addition to VEGF165. Changing CAPER-α expression affected the phenotypic behavior of TC-71 cells in vivo. CAPER-α- transfected TC-71 cells had decreased VEGF165, tumor formation and tumor vessel density. This decrease in endothelial migration, tumor formation and tumor vessel density was not secondary to a decrease in cell doubling time, reduced expression of VEGFR-2 or to the induction of elevated levels of VEGF165b, an anti-angiogenic isoform of VEGF165 (17). The cell doubling time of control and CAPER-α-transfected cells was not statistically different. Transfection of CAPER-α had no effect on either VEGFR-2 or VEGF165b expression.
These findings identify a mechanism by which Ewing’s sarcoma cells can alter the microenvironment to optimize the formation of the new vasculature required for tumor growth and metastasis. Solid tumors must have an extensive vasculature network to bring in needed oxygen and nutrients. Without vasculature expansion, tumors remain small. Tumor cells that can stimulate the microenvironment to form vessels clearly have an advantage. Therefore, understanding the molecular pathways that control this process can lead to identifying and designing specific targeted therapy to interfere with this tumor-microenvironment interaction.
VEGF is a key protein involved in tumor vessel expansion. Elevated VEGF has been shown in several different tumors, including Ewing’s sarcoma, and is associated with increased tumor vessel density and poor patient outcomes (22–25). The VEGF gene is alternatively spliced, yielding different isoforms, including VEGF165 and VEGF189 (1). VEGF189 is tightly bound to proteoglycans in the extracellular matrix or on the cell surface, whereas VEGF165 is soluble and secreted. The 165 isoform is a major chemoattractant for bone marrow progenitor endothelial cells. By contrast, the 189 isoform has little or no chemotactic activity for BM cells. We have previously demonstrated that bone marrow (BM) stem cells, which include endothelial precursors, play an important role in the formation of new Ewing’s sarcoma vessels and that VEGF165 is responsible for both the directed migration and differentiation of these BM stem cells into endothelial cells that make up the tumor vessels (7, 8, 26–28). The selective inhibition of VEGF165 resulted in decreased BM cell migration into the tumor and small tumors with significantly fewer vessels (8, 9). VEGF189 could not compensate for the loss of VEGF165 (8). These data indicate that there is a selective advantage for tumor cells to produce VEGF165 as opposed to VEGF189. Varying the expression of these different isoforms can therefore affect the speed and efficiency of vascular expansion.
VEGF mRNA is transcribed from 8 exons and then alternately spliced to generate the different isoforms. The 165 and 189 isoforms differ in their incorporation of exons 6 and 7 of the full-length gene. These exons encode a cationic domain that confers heparin-binding activity. VEGF189 contains both exons 6 and 7, whereas VEGF165 contains only exon 7. Inclusion of both exons 6 and 7 gives VEGF189 an increased charge, resulting in greater extracellular matrix association (relative to VEGF165) and its membrane-bound form. Because it is membrane bound and not secreted, VEGF189 has little impact on stimulating the migration of BM and endothelial precursors to the neovascular area, a function that is critical to the formation of the Ewing’s sarcoma vascular network (7, 8, 27, 28). Thus, there is an advantage to tumor cells producing VEGF165.
These data suggest that CAPER-α regulates the alternative splicing of VEGF in favor of the 189 isoform and that its downregulation results in increased VEGF165. Manipulation of this gene alone affected tumor vascular formation as assessed by tumor vessel density and tumor growth. Given that VEGF189 (as opposed to VEGF165) includes the protein fragment coded by exon 6, we hypothesize that CAPER-α may target exon 6 for mRNA expression during the alternative splicing process (Fig. 6). Increasing exon 6 inclusion in turn favors VEGF189 expression and alters or lowers the VEGF165/VEGF189 ratio.
Figure 6. Proposed regulation of VEGF alternative splicing by CAPER-α.

The precursor mRNA of VEGF includes 8 exons (box, E1 E8) interspersed by noncoding introns (solid line). CAPER-α induces alternative splicing and inclusion of exon 6 (dotted line indicates joining of exons) by the splicesome, resulting in the expression of VEGF189. EWS FLI-1 prevents this action, resulting in the selective exclusion of exon 6.
In addition to being membrane bound, there is a difference in the biological function of the 189 and 165 isoforms (29–31). Overexpression of VEGF165 in human melanoma cells, which were initially VEGF negative, resulted in aggressive tumor growth in vivo, whereas parental cells and those transfected with VEGF189 were nontumorigenic and dormant when injected into nude mice (30). These VEGF165-transfected cells had a dense vascular network with effective tumor perfusion. Another study showed that only VEGF165 (not VEGF189 or VEGF121) was able to rescue VEGF-inhibited tumors. Tumors expressing VEGF189 showed small, convoluted, and inadequately perfused vessels compared with those in tumors expressing only VEGF165. These studies and our previous results showing the importance of BM cell migration to the formation of the Ewing’s tumor vasculature, support our contention that there is a selective advantage in terms of vascular development afforded to tumors that express greater amounts of the 165 isoform.
Our data also indicate a possible mechanism for how CAPER-α is regulated in Ewing’s cells. Ewing’s sarcoma tumors are characterized by a unique chromosomal translocation between chromosomes 11 and 22 that leads to the formation of fusion genes encoding proteins composed of the transcriptional domain of EWS and the binding domain of 1 of 5 ETS transcription factors. The most common translocation is between the EWS and FLI genes resulting in production of the EWS–FLI-1 fusion protein, which functions as an aberrant transcription factor (32). Several EWS–FLI-1 target genes have been identified and implicated in the initiation and progression of Ewing’s sarcoma (33–35). The EWS–FLI-1 protein has been shown to be a transcription factor for VEGF (21). We show here that, in addition to regulating expression and production of VEGF, EWS–FLI-1 may also control the alternative splicing process for VEGF in favor of VEGF165 by regulating the expression of CAPER-α.
EWS–FLI-1 interacts with SF1, U1C and hyperphosphorylated RNA polymerase II contributing to cellular transformation by affecting RNA splicing (19, 36, 37). Here we have demonstrated that inhibiting EWS–FLI-1 in TC-71 or A4573 cells led to increased CAPER-α. By contrast, transfecting EWS–FLI-1 into MSC cells resulted in decreased expression of CAPER-α. Furthermore, we demonstrated that EWS–FLI-1 has a protein-protein interaction with CAPER-α . These data support the hypothesis that EWS–FLI-1 is involved in the alternative splicing process of VEGF through the regulation of CAPER-α.
The difference in CAPER-α expression among the 3 different Ewing’s cell lines may be explained by the finding of 3 different subtypes of EWS–FLI-1 fusion proteins which result from different fusions between the N terminal of EWS and the C terminal of FLI (38). TC-71 cells express the type 1 fusion, whereas RD-ES cells express the type 2 fusion (38). Differences in the fusion proteins may in turn affect their ability to regulate CAPER-α. We anticipate that the type 1 fusion protein found in TC-71 cells would be more effective at downregulating CAPER-α than the type 2 fusion protein.
VEGF165 plays a central role in the growth of Ewing’s sarcoma and the expansion of its vascular network. The overexpression of VEGF165 in some Ewing’s tumors may be mediated by a switch from the 189 isoform to the 165 isoform which is secondary to the downregulation of CAPER-α. Exon 6 is part of the VEGF189 mRNA but is not included in the VEGF165 mRNA. Therefore, the shift from the 189 to the 165 isoform may be mediated by the exclusion of exon 6 from the VEGF precursor mRNA due to the downregulation of CAPER-α. EWS–FLI-1 may control the transcription of CAPER-α resulting in its downregulation in Ewing’s sarcoma cells.
Acknowledgments
Funding Source: NCI CA103986 (ESK) and CA 16672 Cancer Center Support Core Grant.
References
- 1.Houck KA, Ferrara N, Winer J, Cachianes G, Li B, Leung DW. The vascular endothelial growth factor family: identification of a fourth molecular species and characterization of alternative splicing of RNA. Mol Endocrinol. 1991;5:1806–14. doi: 10.1210/mend-5-12-1806. [DOI] [PubMed] [Google Scholar]
- 2.Nakamura M, Abe Y, Tokunaga T. Pathological significance of vascular endothelial growth factor A isoform expression in human cancer. Pathol Int. 2002;52:331–9. doi: 10.1046/j.1440-1827.2002.01367.x. [DOI] [PubMed] [Google Scholar]
- 3.Cohen T, Gitay-Goren H, Sharon R, et al. VEGF121, a vascular endothelial growth factor (VEGF) isoform lacking heparin binding ability, requires cell-surface heparan sulfates for efficient binding to the VEGF receptors of human melanoma cells. J Biol Chem. 1995;270:11322–6. doi: 10.1074/jbc.270.19.11322. [DOI] [PubMed] [Google Scholar]
- 4.Cheng SY, Nagane M, Huang HS, Cavenee WK. Intracerebral tumor-associated hemorrhage caused by overexpression of the vascular endothelial growth factor isoforms VEGF121 and VEGF165 but not VEGF189. Proc Natl Acad Sci USA. 1997;94:12081–7. doi: 10.1073/pnas.94.22.12081. [DOI] [PMC free article] [PubMed] [Google Scholar]
- 5.Soker S, Takashima S, Miao HQ, Neufeld G, Klagsbrun M. Neuropilin-1 is expressed by endothelial and tumor cells as an isoform-specific receptor for vascular endothelial growth factor. Cell. 1998;92:735–45. doi: 10.1016/s0092-8674(00)81402-6. [DOI] [PubMed] [Google Scholar]
- 6.Lee YH, Tokunaga T, Oshika Y, et al. Cell-retained isoforms of vascular endothelial growth factor (VEGF) are correlated with poor prognosis in osteosarcoma. Eur J Cancer. 1999;35:1089–93. doi: 10.1016/s0959-8049(99)00073-8. [DOI] [PubMed] [Google Scholar]
- 7.Lee TH, Bolontrade MF, Worth LL, Guan H, Ellis LM, Kleinerman ES. Production of VEGF165 by Ewing’s sarcoma cells induces vasculogenesis and the incorporation of CD34+ stem cells into the expanding tumor vasculature. Int J Cancer. 2006;119:839–46. doi: 10.1002/ijc.21916. [DOI] [PubMed] [Google Scholar]
- 8.Zhou Z, Reddy K, Guan H, Kleinerman ES. VEGF(165), but not VEGF(189), stimulates vasculogenesis and bone marrow cell migration into Ewing's sarcoma tumors in vivo. Mol Cancer Res. 2007;5:1125–32. doi: 10.1158/1541-7786.MCR-07-0174. [DOI] [PubMed] [Google Scholar]
- 9.Guan H, Zhou Z, Wang H, Jia SF, Liu W, Kleinerman ES. A small interfering RNA targeting vascular endothelial growth factor inhibits Ewing’s sarcoma growth in a xenograft mouse model. Clin Cancer Res. 2005;11:2662–9. doi: 10.1158/1078-0432.CCR-04-1206. [DOI] [PubMed] [Google Scholar]
- 10.Maniatis T, Tasic B. Alternative pre-mRNA splicing and proteome expansion in metazoans. Nature. 2002;418:236–43. doi: 10.1038/418236a. [DOI] [PubMed] [Google Scholar]
- 11.Jung DJ, Na SY, Na DS, Lee JW. Molecular cloning and characterization of CAPER, a novel coactivator of activating protein-1 and estrogen receptors. J Biol Chem. 2002;277:1229–34. doi: 10.1074/jbc.M110417200. [DOI] [PubMed] [Google Scholar]
- 12.Dowhan DH, Hong EP, Auboeuf D, et al. Steroid hormone receptor coactivation and alternative RNA splicing by U2AF65-related proteins CAPERalpha and CAPERbeta. Mol Cell. 2005;17:429–39. doi: 10.1016/j.molcel.2004.12.025. [DOI] [PubMed] [Google Scholar]
- 13.Wiznerowicz M, Trono D. Conditional suppression of cellular genes: lentivirus vector-mediated drug-inducible RNA interference. J Virol. 2003;77:8957–61. doi: 10.1128/JVI.77.16.8957-8961.2003. [DOI] [PMC free article] [PubMed] [Google Scholar]
- 14.Guan H, Zhou Z, Gallick GE, et al. Targeting Lyn inhibits tumor growth and metastasis in Ewing's sarcoma. Mol Cancer Ther. 2008;7:1807–16. doi: 10.1158/1535-7163.MCT-08-0058. [DOI] [PMC free article] [PubMed] [Google Scholar]
- 15.Duan X, Guan H, Cao Y, Kleinerman ES. Murine bone marrow-derived mesenchymal stem cells as vehicles for interleukin-12 gene delivery into Ewing sarcoma tumors. Cancer. 2009;115:13–22. doi: 10.1002/cncr.24013. [DOI] [PMC free article] [PubMed] [Google Scholar]
- 16.Krüssel JS, Behr B, Milki AA, Hirchenhain J, Wen Y, Bielfeld P. Vascular endothelial growth factor (VEGF) mRNA splice variants are differentially expressed in human blastocysts. Mol Hum Reprod. 2001;7:57–63. doi: 10.1093/molehr/7.1.57. [DOI] [PubMed] [Google Scholar]
- 17.Rennel E, Waine E, Guan H, et al. The endogenous anti-angiogenic VEGF isoform, VEGF165b inhibits human tumour growth in mice. Br J Cancer. 2008;98(7):1250–1257. doi: 10.1038/sj.bjc.6604309. [DOI] [PMC free article] [PubMed] [Google Scholar]
- 18.Zygalaki E, Stathopoulou A, Kroupis C, et al. Real-time reverse transcription-PCR quantification of vascular endothelial growth factor splice variants. Clin Chem. 2005;51(8):1518–20. doi: 10.1373/clinchem.2004.046987. [DOI] [PubMed] [Google Scholar]
- 19.Yang L, Chansky HA, Hickstein DD. EWS FlI-1 fusion protein interacts with hyperphosphorylated RNA polymerase II and interferes with serine-arginine protein-mediated RNA splicing. J Biol Chem. 2000;275:37612–8. doi: 10.1074/jbc.M005739200. [DOI] [PubMed] [Google Scholar]
- 20.Nagano A, Ohno T, Shimizu K, et al. EWS/FLI-1 chimeric fusion gene up-regulates vascular endothelial growth factor-A. Int J Cancer. 2010;15:2790–8. doi: 10.1002/ijc.24781. [DOI] [PubMed] [Google Scholar]
- 21.Fuchs B, Inwards CY, Janknecht R. Vascular endothelial growth factor expression is up-regulated by EWS-ETS oncoproteins and Sp1 and may represent an independent predictor of survival in Ewing's sarcoma. Clin Cancer Res. 2004;10:1344–53. doi: 10.1158/1078-0432.ccr-03-0038. [DOI] [PubMed] [Google Scholar]
- 22.Hazelton D, Nicosia RF, Nicosia SV. Vascular Endotelial Growth Factor Levels in Ovariann Cyst Fluid Correlate with Malignancy. Clin Cancer Res. 1999;5:823–9. [PubMed] [Google Scholar]
- 23.Adams J, Carder PJ, Downey S, et al. Vascular endothelial growth factor (VEGF) in breast cancer: comparison of plasma, serum, and tissue VEGF and microvessel density and effects of tamoxifen. Cancer Res. 2000;60:2898–905. [PubMed] [Google Scholar]
- 24.Dvorak HF, Sioussat TM, Brown LF, et al. Distribution of vascular permeability factor (vascular endothelial growth factor) in tumors: concentration in tumor blood vessels. J Exp Med. 1991;174:1275–8. doi: 10.1084/jem.174.5.1275. [DOI] [PMC free article] [PubMed] [Google Scholar]
- 25.Senger DR, Van de Water L, Brown LF, et al. Vascular permeability factor (VPF, VEGF) in tumor biology. Cancer Met Rev. 1993;12:303–24. doi: 10.1007/BF00665960. [DOI] [PubMed] [Google Scholar]
- 26.Reddy K, Zhou Z, Jia SF, et al. Stromal cell-derived factor-1 stimulates vasculogenesis and enhances Ewing's sarcoma tumor growth in the absence of vascular endothelial growth factor. Int J Cancer. 2008;123:831–7. doi: 10.1002/ijc.23582. [DOI] [PMC free article] [PubMed] [Google Scholar]
- 27.Reddy K, Zhou Z, Jia S-F, Kleinerman ES. Specific bone marrow subsets differentiate into endothelial cells and pericytes and contribute to tumor vessel formation in Ewing’s sarcoma. Mol Cancer Res. 2008;6:929–36. doi: 10.1158/1541-7786.MCR-07-2189. [DOI] [PMC free article] [PubMed] [Google Scholar]
- 28.Reddy K, Cao Y, Zhou Z, Yu L, Jia S-F, Kleinerman ES. VEGF165 expression in the tumor microenvironment influences the differentiationof bone marrow-derived pericytes that contribute to the Ewing’s sarcoma vasculature. Angiogenesis. 2008;11:257–67. doi: 10.1007/s10456-008-9109-1. [DOI] [PMC free article] [PubMed] [Google Scholar]
- 29.Grunstein J, Masbad JJ, Hickey R, Giordano F, Johnson RS. Isoforms of vascular endothelial growth factor act in a coordinate fashion to recruit and expand tumor vasculature. Mol Cell Biol. 2000;20:7282–91. doi: 10.1128/mcb.20.19.7282-7291.2000. [DOI] [PMC free article] [PubMed] [Google Scholar]
- 30.Yu JL, Rak JW, Klement G, Kerbel RS. Vascular endothelial growth factor isoform expression as a determinant of blood vessel patterning in human melanoma xenografts. Cancer Res. 2002;62:1838–46. [PubMed] [Google Scholar]
- 31.Tozer GM, Akerman S, Cross NA, et al. Blood vessel maturation and response to vascular-disrupting therapy in single vascular endothelial growth factor-A isoform-producing tumors. Cancer Res. 2008;68:2301–11. doi: 10.1158/0008-5472.CAN-07-2011. [DOI] [PubMed] [Google Scholar]
- 32.Uren A, Toretsky JA. Ewing's sarcoma oncoprotein EWS-FLI1: the perfect target without a therapeutic agent. Future Oncol. 2005;1:521–8. doi: 10.2217/14796694.1.4.521. [DOI] [PubMed] [Google Scholar]
- 33.Riggi N, Stamenkovic I. The biology of Ewing sarcoma. Cancer Lett. 2007;254:1–10. doi: 10.1016/j.canlet.2006.12.009. [DOI] [PubMed] [Google Scholar]
- 34.Smith R, Owen LA, Trem DJ, et al. Expression profiling of EWS/FLI identifies NKX2. 2 as a critical target gene in Ewing’s sarcoma. Cancer Cell. 2006;9:405–16. doi: 10.1016/j.ccr.2006.04.004. [DOI] [PubMed] [Google Scholar]
- 35.Prieur A, Tirode F, Cohen P, Delattre O. EWS/FLI-1 silencing and gene profiling of Ewing cells reveal downstream oncogenic pathways and a crucial role for repression of insulin-like growth factor binding protein 3. Mol Cell Biol. 2004;24:7275–83. doi: 10.1128/MCB.24.16.7275-7283.2004. [DOI] [PMC free article] [PubMed] [Google Scholar]
- 36.Zhang D, Paley AJ, Childs G. The transcriptional repressor ZFM1 interacts with and modulates the ability of EWS to activate transcription. J Biol Chem. 1998;273:18086–91. doi: 10.1074/jbc.273.29.18086. [DOI] [PubMed] [Google Scholar]
- 37.Knoop LL, Baker SJ. The splicing factor U1C represses EWS/FLI-mediated transactivation. J Biol Chem. 2000;275:24865–71. doi: 10.1074/jbc.M001661200. [DOI] [PubMed] [Google Scholar]
- 38.Zhang J, Hu S, Schofield DE, Sorensen PH, Triche TJ. Selective usage of D-type cyclins by Ewing's tumors and rhabdomyosarcomas. Cancer Res. 2004;64:6026–34. doi: 10.1158/0008-5472.CAN-03-2594. [DOI] [PubMed] [Google Scholar]