

Abstract
Little is known about the quality of life and survival in the patients on maintenance hemodialysis (HD) in India. Poor nutrition and dialysis noncompliance is common. This study investigates the factors that affect the quality of life (QoL) in HD patients in India. This cross-sectional study included 78 patients on HD for ≥ two months. Demographic, nutritional, functional subjective global assessment and Kidney Disease Quality of Life (KDQOL-36) assessments were done. Predictors of QoL were assessed by regression analysis. The mean calorie and protein intake were 1245 ± 116.9 kcal and 0.86 ± 0.19 g/kg/day respectively. Male gender (OR = 9.68), serum parathyroid hormone PTH <150 pg/ml (OR = 0.03), age ≤65 years (OR = 1.25), no catheter use (OR = 1.9) and hospitalizations (OR = 0.11), were independent predictors of total score ≥50. Independent predictors of physical component summary (PCS) >25 were male gender (OR = 5.06) and urine output at start of dialysis (OR = 1.05). Independent predictors of mental component summary (MCS) ≥25 were male gender (OR = 11.02), serum PTH > 150 pg/ml (OR = 0.15), daily protein intake of >0.8 g/kg and caloric intake >20 K.cal/kg (OR = 10.8). Patients with urine output >1 liter per day had more hypotensive episodes during dialysis (r = 0.56, P = 0.045), more headaches (r = 0.63, P = 0.006) but that did not affect the PCS significantly. Low PTH (<150 pg/ml) (OR = 1.29), multiple access failures (OR = 3.36) and total score ≤50 (OR = 0.09) were independently associated with increased hospitalization. Males, patients with serum PTH >150 pg/ml and those not on catheter had better total score. Though patients with higher urine output had better PCS, those with output >1 liter had higher incidence of hypotension and dialysis-related headache. Protein-energy malnutrition affected the MCS significantly. Dialysis noncompliance seen in one-fourth of the population did not affect the scores significantly.
Keywords: Hemodialysis, kidney disease quality of life-36, malnutrition, noncompliance, quality of life
Introduction
The average incidence of chronic kidney disease Stage 5 (CKD5) in developing countries is 150 per million population, an incidence lower compared to the developed nations.[1] In India, an estimated 100-220 per million population reach CKD5 and approximately 10% of these patients receive renal replacement therapy mainly due to socioeconomic limitations.[2] The existing Chronic Kidney Disease Registry of India has 154 contributing centers as of 2008 and less than 50% of them contribute data regularly. It does not collect the morbidity, mortality and quality of life (QoL) data. Little is known about the QoL and survival in the patients on maintenance hemodialysis (HD).[3] Poor nutrition[4] and dialysis noncompliance is common. This study investigates the factors that affect the quality of life in HD patients.
Materials and Methods
This was a cross-sectional study involving all the patients on HD for more than two months from a tertiary care hospital in Bengaluru. We excluded patients with recent history of severe sepsis requiring hospitalization, severe trauma, recent fracture and malignancy. Demographic information, co-morbidity index,[5] phosphate binder, vitamin D use; and calorie-protein intake was assessed by recall method and protein nitrogen appearance (PNA) respectively. The serum calcium (Sr. Ca), phosphorus (Sr. Pi), albumin (Sr. Alb) and PTH (Sr. PTH) were measured once pre-dialysis after either a long or short inter-dialytic interval. The PTH samples were handled with the standard precautions. Intact PTH was analyzed pre-dialysis using an immunology analyzer (Immulite 2000, Diagnostic Products Corporation, Los Angeles, CA, USA). The reference range was 12-65 pg/ml and interassay and intra-assay variation was 2.5% and 2.35% respectively. All patients were dialyzed with Fresenius F6 polysulfone dialyzer. The functional assessment and QoL assessment were done using subjective global assessment[6] (SGA) and Kidney Disease Quality of Life (KDQOL)-36[7] respectively.
The KDQOL-36 is a 36-item health-related quality outcome life survey with five subscales. The first 12 questions measure ‘physical and mental functioning’ with items about general health, activity limits, ability to accomplish desired tasks, depression and anxiety, energy level, and social activities; questions 13-16 measure the ‘burden of kidney disease’ with items about how much kidney disease interferes with daily life, takes up time, causes frustration, or makes the respondent feel like a burden; questions 17-28b measure the ‘symptoms and problems’ with items about how bothered a respondent feels by sore muscles, chest pain, cramps, itchy or dry skin, shortness of breath, faintness/dizziness, lack of appetite, feeling washed out or drained, numbness in the hands or feet, nausea, or problems with dialysis access; and items 29-36 measure the ‘effects of kidney disease on daily life’ with items about how bothered the respondent feels by fluid limits, diet restrictions, ability to work around the house or travel, feeling dependent on doctors and other medical staff, stress or worries, sex life, and personal appearance. Two patients completed the questionnaire themselves and the rest were helped to complete the questionnaire by the first two authors. Conscious effort was made to translate as such and not to make suggestions. The five subscales and total score were scored from 0-100 with higher the score better is the QoL using excel templates available free for download online (http://gim.med.ucla.edu/kdqol/).
Statistical methods
Data are presented as mean ± SD. The independent-samples T-test, Mann–Whitney U-test and analysis of variance were used as appropriate. Bonferroni correction was used to address the problem of multiple comparisons. Univariate regression analyses were used to identify predictors with P value <0.2 and those factors were included in logistic regression models. The dependent variables chosen were - total score > 50; physical component summary (PCS)≤25; and mental component summary (MCS) ≤25. P value of <0.05 was considered significant.
Results
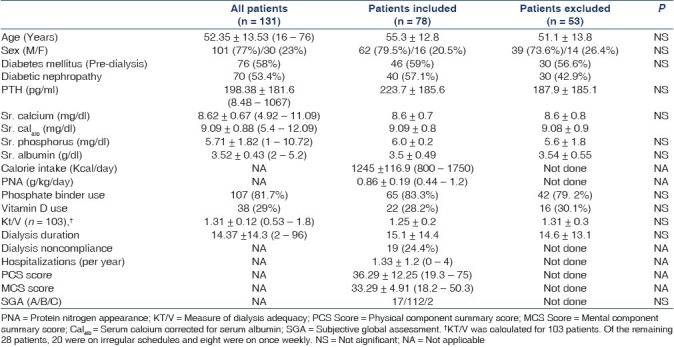
Of the 131 patients studied [Figure 1], the mean age was 52.35 ± 13.53 years and 77% were males [Table 1] and the mean duration of dialysis was 14.3 ± 14.3 (median = 12, range 2-60) months. The commonest cause of CKD was diabetic nephropathy (53.4%). Final analysis included 91 patients as 24 did not give consent for the study and 16 patients were excluded after applying the exclusion criteria. The baseline parameters were comparable in the patient population that was studied and those that were excluded [Table 1]. For the QoL analysis 78 patients were eligible. Twenty four refused consent, 16 had atleast on exclusion criteria, two patients had severe dementia, five patients did not have a qualified medical translator and six patients did not complete the KDQOL-36 questionnaire [Figure 1].
Figure 1.
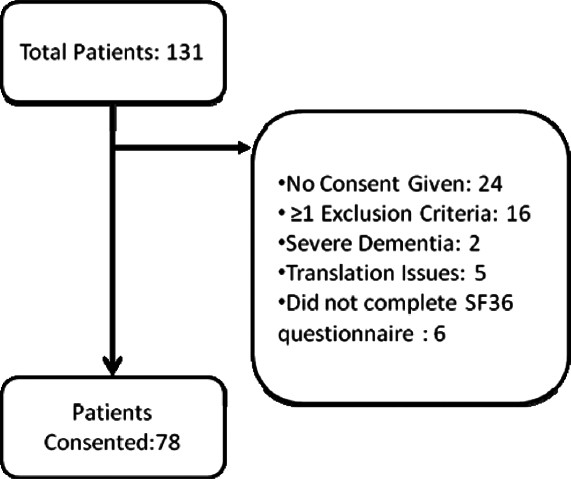
Patients included and excluded from analysis
Table 1.
Demographics of all the patients
The dialysis prescription was empiric and the frequency of dialysis varied between less than once weekly to thrice weekly (once weekly or less – eight, twice weekly – 80 and thrice weekly – 43 patients). Nineteen patients (24.4%) were noncompliant with regard to frequency or duration of dialysis. We defined noncompliance as skipping one or more HD sessions in a month or shortening by 10 or more min one or more HD sessions in a month. Over the period of three months six patients died, four left for another center and four had live related renal transplantation.
The mean calorie intake on a non-dialysis day was 1245 ± 116.9 kcal calculated by recall technique. The estimated daily protein intake was 0.86 ± 0.19 g/kg/ day as calculated by PNA. The mean serum albumin was 3.52 ± 0.43 g/dl and 24.4% had serum albumin less than 3.5 g/dl [Table 1].
The mean serum calcium, corrected serum calcium (Sr. Calalb), phosphate and parathormone levels were 8.62 ± 0.67 mg/dl, 9.09 ± 0.88 mg/dl, 5.7 ± 1.82 mg/dl and 198.38 ± 185.2 pg/ml respectively [Table 1]. There were 15.3% patients with Sr. Calalb less than 8.4 mg/dl and seven patients (5.3%) had levels more than 10.4 mg/ dl. There were 47.3% patients with Sr. Pi ≥5.5 mg/dl. The phosphate binder and calcitriol were prescribed empirically—81.68% patients were on phosphate binder (calcium carbonate or caclium acetate) and 29% were on calcitriol. None of the patients included in the final analysis were on calcium-sparing phosphate binder.
The post-dialysis sample was taken from the arterial port after slowing the pump speed to 100 ml/min for 15-20 sec to minimize recirculation. Some of our patients had significant residual renal function as we included patients who were on dialysis for two months or more and hence their dialysis adequacy as measured by Kt/V was adjusted for residual renal function by urine collection if their urine output was more than 500 ml/day to avoid over-calculation of the delivered dose of dialysis, during the entire inter-dialytic period. For the eight patients who were on less than twice weekly dialysis the calculated weekly standard KT/V (stdKt/V) adjusted for residual renal function was 1.25 ±0.35. The mean Kt/V for the remaining 123 patients was 1.31 ± 0.12.
The mean annual hospitalization rate was 1.33 ± 1.2 and the average co-morbidty index was 0.83 ± 1.67. Of the six patients who died over the study period, two were in the group that was compliant with dialysis and four were from the dialysis noncompliance group.
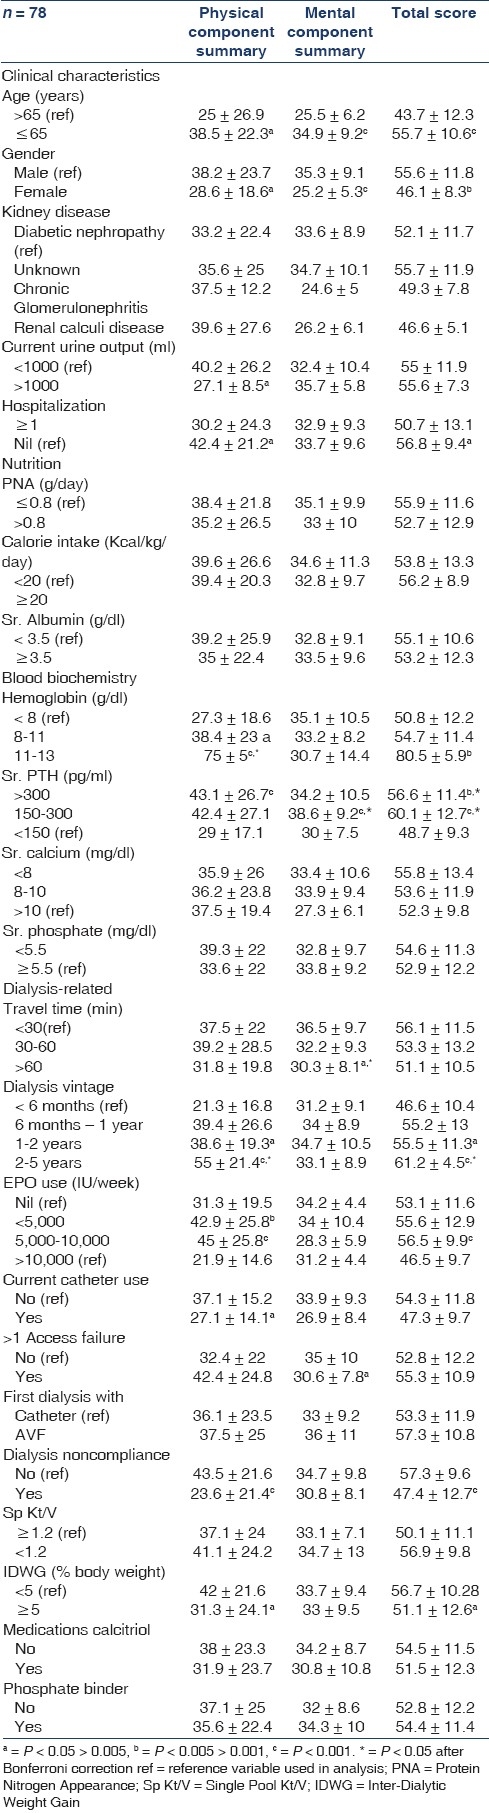
The SGA score was A in 17, B in 112 and C in two patients. As per the KDQOL-36, the mean total score, PCS and MCS, were 53.73 ± 11.75, 36.29 ± 12.25 and 33.29 ± 4.91 respectively [Figure 2]. When the summary scores (PCS and MCS) and total scores were evaluated for different variables we observed that the following factors were associated with lower PCS and or MCS and or total score – female gender, age ≤65 years, urine output >1000 ml/ day, any hospitalization, lower hemoglobin, serum PTH <150 pg/ml, travel time <60 min, extremes of erythropoietin dose, catheter use, dialysis noncompliance and Inter-dialytic weight gain (IDWG) >5% [Table 2].
Figure 2.
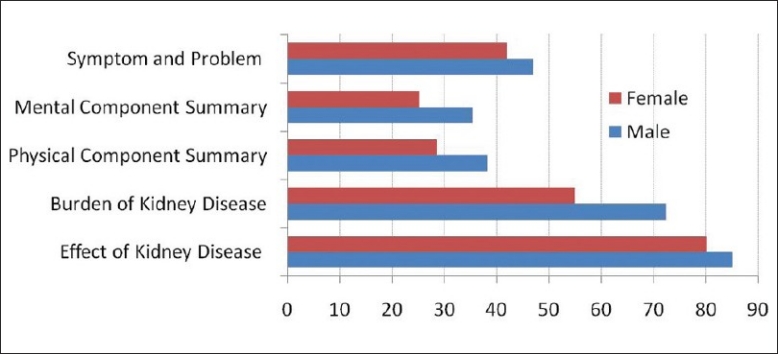
Gender difference in health-related quality of life scores (KDQOL-36)
Table 2.
Scores of the summary measures and total score of health-related quality of life by selected patient characteristics
For total score, dialysis vintage, serum calcium corrected for serum albumin, urine output at initiation of HD, male gender, serum PTH >150 ng/ml, age ≤65 years, current catheter use, absence of hospital admissions, dialysis noncompliance, IDWG, serum albumin > 3.5g/dl, travel time to dialysis unit, blood transfusion in the last six months, presence of access failures and body weight identified by univariate regression analysis with P value <0.2 were included in multivariate regression analysis. By logistic regression male gender, PTH >150 ng/ml, age ≤65 years, current catheter use and absence of hospital admissions were identified as independent predictors of KDQOL SF-36 total score more than 50 [Table 3].
Table 3.
Predictors of total score – KDQOL-36
For PCS, dialysis vintage, serum calcium corrected for serum albumin, serum PTH >150 pg/ml, activated vitamin D use, nutrition intake with >20 Kcal/kg of calories and > 0.8 g/kg/day of protein, urine output at initiation of dialysis, absence of hospitalization, male gender, dialysis noncompliance, IDWG were identified by univariate analysis with P value <0.2 and were included in regression analysis. By logistic regression the independent predictors were male gender and higher urine output at initiation of dialysis [Table 4].
Table 4.
Predictors of physical component summary
For MCS, serum albumin >3.5 g/dl, serum PTH >150 pg/ ml, age <65 years, calorie intake, nutrition intake with >20 Kcal/kg of calories and >0.8 g/kg/day of protein, male gender, travel cost, urine output at initiation of dialysis, absence of hospitalization, dialysis noncompliance, IDWG were identified by univariate analysis with P value <0.2 and were included in regression analysis. By logistic regression analysis the independent predictors were male gender, serum PTH >150 pg/ml, nutrition intake with >20 Kcal/kg of calories and >0.8 g/kg/day of protein [Table 5].
Table 5.
Predictors of mental component summary
Age >65, current urine output, body weight, IDWG, percentage of body weight, serum PTH < 150 pg/ ml, multiple access failure and total score >50 were found to be significantly associated with hospitalization by univariate regression analysis. In binary logistic regression, total score ≤50 (OR = 0.09), multiple access failures (OR = 3.36) and serum PTH <150 pg/ ml (OR = 1.29) were found to independently predict hospitalization [Table 6].
Table 6.
Predictors of hospitalization
Discussion
There is limited information available on the QoL in Indian dialysis patients. QoL can predict hospitalization and mortality[8] and identifying modifiable factors in patients can improve their QoL and survival. Males had better TS, PCS and MCS consistent with other studies.[8] Age ≤65 yr, absence of catheter use, hospitalization and PTH >150 predicted better TS. Catheter use was associated with lower total score in our study consistent with DOPPS data.[9] Low PTH (<150 pg/ml) was a predictor of poor total score and PCS consistent with prior observations.[10] Data on association between low PTH and hospitalization is unclear with studies showing increased[11,12] and no association.[13] We observed no correlation of low PTH with nutritional parameters and the co-morbidity index. Earlier reports had shown that low PTH was associated with poor nutrition, higher co-morbidity index[14] and inflammation.[15] Only three patients in our study had a combination of calorie intake >25 Kcal/kg/day and protein >1.0 g/kg/day and this near universal malnutrition may explain why we observed no effect of nutrition on PTH.
Apart from male gender, only urine output at start of dialysis independently predicted better PCS. The patients with urine output >1L/day had more hypotension and headache during dialysis and were associated with poor PCS. However it was not an independent predictor of PCS. Hypotension is one of the common causes of dialysis headache.[22] Similarly, the CHOICE study has recently shown that though statistically not significant, ‘physical functioning’, ‘role physical’ and ‘bodily pain’ scores were poor in patients with urine output >250 ml/day at the end of one year.[17] Avoiding hypotension and cramps in these patients will increase the QoL and decrease the long-term complications of intradialytic hypotension in them.
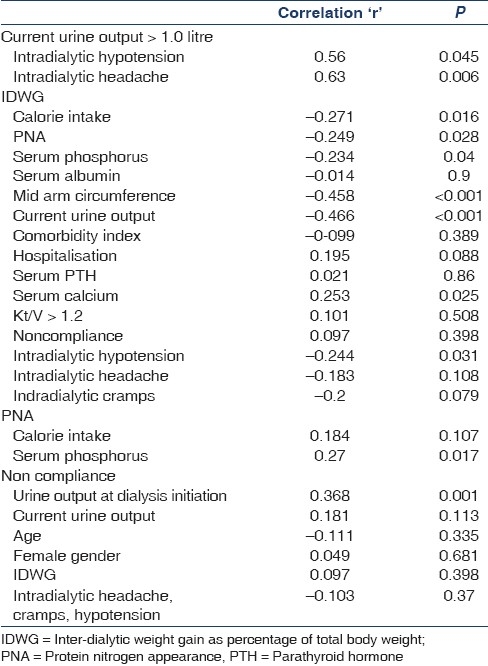
Increasing IDWG was associated with poor PCS and total score and had no effect on the MCS. It has been reported that increased IDWG[18] is a risk factor for low QoL scores. Increased IDWG predisposes the patient to rapid and large-volume ultrafiltration with its associated intradialytic hypotension, cramps, dialysis-related headache,[19,20] interdialytic hypertension[21] and left ventricular hypertrophy.[22] Higher IDWG has been reported to be associated with better nutritional parameters and both improved[9] and decreased[23] survival. We found that IDWG had significant inverse correlation with calorie intake and , PNA, serum phosphorus, mid-arm circumference and had no significant correlation with serum albumin [Table 7]. This is contrary to other observations[32,30] where IDWG correlated directly with nutrition indices. There was no correlation of IDWG with age, co-morbidity index, hospitalization, serum albumin, serum PTH, serum calcium, Kt/V, noncompliance, intradialytic hypotension and cramps.
Table 7.
Correlation between current urine output, IDMW, PNA, dialysis non compliance and intradialytic complications and related clinical and laboratory factors
Increasing hemoglobin improved the PCS in each of the groups examined. None of our patient had hemoglobin >13 g/dl. Our findings are consistent with the Normal Hematocrit Study that showed a similar significant improvement on the physical-functioning scale.[25] However the CHOIR study[26] and DOPPS[14] data showed no improvement in the QoL score between groups with <11 g/dl and >11 g/dl hemoglobin targets.
Male gender, serum PTH >150 pg/ml and nutrition intake with >20 Kcal/kg and >0.8 g/kg/day of protein intake were independently associated with higher MCS as has been reported in prior studies.[14] The mean protein intake by our cohort was 0.86 ± 0.19 g/kg per day evaluated by PNA and none of them had the recommended protein intake of 1.2 g/kg/day or higher. Our patients’ protein intake was comparable to a study done on Indian CKD and hemodialysis patients by Tapiawala et al.[28] The correlation between protein intake and total calorie intake was poor and can be due various factors that include the fact that PNA reflects the nitrogen balance that is affected by factors like protein intake, protein anabolism and catabolism, biological value of the protein consumed and the percentage of protein in the diet. The typical Indian diet has low protein intake and most patients do not increase their protein intake after dialysis initiation.[8]
Dialysis noncompliance was not a predictor of a poor total score, PCS or MCS or increased hospitalizations. When we analyzed the possible factors (age, gender, co-morbidity index, serum albumin, urine output at dialysis initiation, current urine output, intradialytic hypotension/ cramps, angina, IDWG) associated with noncompliance, we found that only the ‘urine output at initiation of dialysis’ was significantly associated with noncompliance. The need to be compliant especially before their residual renal functions have declined significantly has to be emphasized in these patients to improve their QoL. The mortality increases by 30% and 11% with skipping one session of dialysis and shortening the dialysis session by 10 min or more per month respectively.[16] Though large observational studies have shown that the dialysis dose delivered is related to mortality, it is, however, controversial.[17] It is possible that dialysis noncompliance is associated with some unmeasured factors that influence mortality. Likewise, noncompliance was not a predictor of increased hospitalisations. Only multiple access failures, serum PTH <150 pg/ml and age >65 years were independently associated with hospitalization.
The mean age of our cohort was comparable to the Bengaluru,[27] and Chennai[29] studies and older to the Vellore[30] study. The low mean duration of dialysis in our study and other studies[27,29,30] from India is due to high attrition rate largely due to financial reasons. The dialysis prescription was empiric and not based on measures of dialysis adequacy and is a common practice in most centers in our country[27,31] and varied between less than twice weekly to thrice weekly. Renal replacement therapy remains unaffordable for the majority with only 10% of the patients continuing long-term renal replacement therapy.[32]
The mean serum calcium, phosphorus and PTH were comparable to previous study from India but significantly lower compared to the western population.[29] Lower dietary calcium[33,34] intake couple with a diet with high phytate content and higher vitamin D deficiency[35] atleast partly explains the low serum calcium. However, calcium balance studies in patients living in these conditions are not yet available.[36] Our cohort also had lower supplemental activated vitamin D intake (29% vs. 59.1% in DOPPS3).[37] All but 24 (18.3%) of the patients were on phosphate binders comparable to the use in the DOPPS. The use of phosphate binders and vitamin D analogues are also empirical in most patients and not based on serum PTH and calcium, phosphorus levels.
Conclusion
All the five subscales of KDQOL SF-36 were worse in females. Patients with serum PTH >150 pg/ml and not on catheter had a better total score. Though patients with higher urine output had better PCS, those with output >1 liter had higher incidence of hypotension and dialysis-related headache. Protein-energy malnutrition is rampant is our cohort and it affected the MCS significantly. Dialysis noncompliance seen in one-fourth of the population did not affect the scores significantly.
Footnotes
Source of Support: Nil
Conflict of Interest: None declared.
References
- 1.Hamer RA, El Nahas AM. The burden of chronic kidney disease. BMJ. 2006;332:563–4. doi: 10.1136/bmj.332.7541.563. [DOI] [PMC free article] [PubMed] [Google Scholar]
- 2.Modi GK, Jha V. The incidence of end-stage renal disease in India: a population-based study. Kidney Int. 2006;70:2131–3. doi: 10.1038/sj.ki.5001958. [DOI] [PubMed] [Google Scholar]
- 3.3 year cumulative annual report, CKD registry of India: Indian Society of Nephrology Online Resources. [Last accessed on 2010 Dec 04]. Available from: http://www.ckdri.org .
- 4.Tapiawala S, Vora H, Patel Z, Badve S, Shah B. Subjective global assessment of nutritional status of patients with chronic renal insufficiency and end stage renal disease on dialysis. J Assoc Physicians India. 2006;54:923–6. [PubMed] [Google Scholar]
- 5.Liu J, Huang Z, Gilbertson DT, Foley RN, Collins AJ. An improved comorbidity index for outcome analyses among dialysis patients. Kidney Int. 2010;77:141–51. doi: 10.1038/ki.2009.413. [DOI] [PubMed] [Google Scholar]
- 6.Detsky AS, McLaughlin JR, Baker JP, Johnston N, Whittaker S, Mendelson RA, et al. What is subjective global assessment of nutritional status? JPEN J Parenter Enteral Nutr. 1987;11:8–13. doi: 10.1177/014860718701100108. [DOI] [PubMed] [Google Scholar]
- 7.Hays RD, Kallich JD, Mapes DL, Coons SJ, Carter WB. Development of the kidney disease quality of life (KDQOL) instrument. Qual Life Res. 1994;3:329–38. doi: 10.1007/BF00451725. [DOI] [PubMed] [Google Scholar]
- 8.DeOreo PB. Hemodialysis patient-assessed functional health status predicts continued survival, hospitalization, and dialysis-attendance compliance. Am J Kidney Dis. 1997;30:204–12. doi: 10.1016/s0272-6386(97)90053-6. [DOI] [PubMed] [Google Scholar]
- 9.Akman B, Uyar M, Afsar B, Sezer S, Ozdemir FN, Haberal M. Adherence, depression and quality of life in patients on a renal transplantation waiting list. Transpl Int. 2007;20:682–7. doi: 10.1111/j.1432-2277.2007.00495.x. [DOI] [PubMed] [Google Scholar]
- 10.Coco M, Rush H. Increased incidence of hip fractures in dialysis patients with low serum parathyroid hormone. Am J Kidney Dis. 2000;36:1115–21. doi: 10.1053/ajkd.2000.19812. [DOI] [PubMed] [Google Scholar]
- 11.Naves-Díaz M, Passlick-Deetjen J, Guinsburg A, Marelli C, Fernández-Martín JL, Rodríguez-Puyol D, et al. Calcium, phosphorus, PTH and death rates in a large sample of dialysis patients from Latin America.The CORES Study. Nephrol Dial Transplant. 2010 doi: 10.1093/ndt/gfq304. [In press] [DOI] [PubMed] [Google Scholar]
- 12.2007. [Last assessed on 2010 April 26]. Available from: http://www.dopps.org/annualreport/html/pb_any_c_mostrec2009.htm. DOPPS 3 .
- 13.Morrone LF, Mazzaferro S, Russo D, Aucella F, Cozzolino M, Facchini MG, et al. Interaction between parathyroid hormone and the Charlson comorbidity index on survival of incident haemodialysis patients. Nephrol Dial Transplant. 2009;24:2859–65. doi: 10.1093/ndt/gfp170. [DOI] [PubMed] [Google Scholar]
- 14.Lopes AA, Bragg-Gresham JL, Goodkin DA, Fukuhara S, Mapes DL, Young EW, et al. Factors associated with health-related quality of life among hemodialysis patients in the DOPPS. Qual Life Res. 2007;16:545–57. doi: 10.1007/s11136-006-9143-7. [DOI] [PubMed] [Google Scholar]
- 15.Dukkipati R, Kovesdy CP, Colman S, Budoff MJ, Nissenson AR, Sprague SM, et al. Association of relatively low serum parathyroid hormone with malnutrition-inflammation complex and survival in maintenance hemodialysis patients. J Ren Nutr. 2010;20:243–54. doi: 10.1053/j.jrn.2009.10.006. [DOI] [PMC free article] [PubMed] [Google Scholar]
- 16.Shafi T, Jaar BG, Plantinga LC, Fink NE, Sadler JH, Parekh RS, et al. Association of residual urine output with mortality, quality of life, and inflammation in incident hemodialysis patients: The choices for healthy outcomes in Caring for end-stage renal disease (CHOICE) study. Am J Kidney Dis. 2010;56:348–58. doi: 10.1053/j.ajkd.2010.03.020. [DOI] [PMC free article] [PubMed] [Google Scholar]
- 17.Saran R, Bragg-Gresham JL, Rayner HC, Goodkin DA, Keen ML, Van Dijk PC, et al. Nonadherence in hemodialysis: Associations with mortality, hospitalization, and practice patterns in the DOPPS. Kidney Int. 2003;64:254–62. doi: 10.1046/j.1523-1755.2003.00064.x. [DOI] [PubMed] [Google Scholar]
- 18.Dimitrijevic Z, Cvetkovic T, Stojanovic M, Paunovic K, Djordjevic V. Prevalence and risk factors of myocardial remodeling in hemodialysis patients. Ren Fail. 2009;31:662–7. doi: 10.3109/08860220903100705. [DOI] [PubMed] [Google Scholar]
- 19.Greene T, Beck GJ, Gassman JJ, Gotch FA, Kusek JW, Levey AS. Design and statistical issues of the hemodialysis (HEMO) study. Control Clin Trials. 2000;21:502–25. doi: 10.1016/s0197-2456(00)00062-3. [DOI] [PubMed] [Google Scholar]
- 20.Skroeder NR, Jacobson SH, Lins LE, Kjellstrand CM. Acute symptoms during and between hemodialysis: The relative role of speed, duration, and biocompatibility of dialysis. Artif Organs. 1994;18:880–7. doi: 10.1111/j.1525-1594.1994.tb03339.x. [DOI] [PubMed] [Google Scholar]
- 21.Antoniazzi AL, Bigal ME, Bordini CA, Speciali JG. Headache and hemodialysis: Evaluation of the possible triggering factors and of the treatment. Arq Neuropsiquiatr. 2002;60:614–8. [PubMed] [Google Scholar]
- 22.Rahman M, Fu P, Sehgal AR, Smith MC. Interdialytic weight gain, compliance with dialysis regimen, and age are independent predictors of blood pressure in hemodialysis patients. Am J Kidney Dis. 2000;35:257–65. doi: 10.1016/s0272-6386(00)70335-0. [DOI] [PubMed] [Google Scholar]
- 23.López-Gómez JM, Villaverde M, Jofre R, Rodriguez-Benítez P, Pérez-García R. Interdialytic weight gain as a marker of blood pressure, nutrition, and survival in hemodialysis patients. Kidney Int Suppl. 2005;93:S63–8. doi: 10.1111/j.1523-1755.2005.09314.x. [DOI] [PubMed] [Google Scholar]
- 24.Saran R, Bragg-Gresham JL, Rayner HC, Goodkin DA, Keen ML, Van Dijk PC, et al. Nonadherence in hemodialysis: Associations with mortality, hospitalization, and practice patterns in the DOPPS. Kidney Int. 2003;64:254–62. doi: 10.1046/j.1523-1755.2003.00064.x. [DOI] [PubMed] [Google Scholar]
- 25.Besarab A, Bolton WK, Browne JK, Egrie JC, Nissenson AR, Okamoto DM, et al. The effects of normal as compared with low hematocrit values in patients with cardiac disease who are receiving hemodialysis and epoetin. N Engl J Med. 1998;339:584–90. doi: 10.1056/NEJM199808273390903. [DOI] [PubMed] [Google Scholar]
- 26.Singh AK, Szczech L, Tang KL, Barnhart H, Sapp S, Wolfson M, et al. Correction of anemia with epoetin alfa in chronic kidney disease. N Engl J Med. 2006;355:2085–8. doi: 10.1056/NEJMoa065485. [DOI] [PubMed] [Google Scholar]
- 27.Ballal HS, Anandh U. Haemodialysis in India. Nephrol Dial Transplant. 1999;14:2779. doi: 10.1093/ndt/14.11.2779. [DOI] [PubMed] [Google Scholar]
- 28.Tapiawala S, Vora H, Patel Z, Badve S, Shah B. Subjective global assessment of nutritional status of patients with chronic renal insufficiency and end stage renal disease on dialysis. J Assoc Physicians India. 2006;54:923–6. [PubMed] [Google Scholar]
- 29.Sankarasubbaiyan S, Abraham G, Soundararajan P, Chandrasekaran V, Padma G. Parathyroid hormone and biochemical profile in chronic kidney disease patients in South India. Hemodial Int. 2005;9:63–7. doi: 10.1111/j.1492-7535.2005.01119.x. [DOI] [PubMed] [Google Scholar]
- 30.Rao M, Israel J, Krishnaswamy H, Shastry JC, Jacob CK. Renal osteodystrophy in patients with end stage renal disease. Indian J Nephrol. 1993;3:1–3. [Google Scholar]
- 31.Rao M, Juneja R, Shirly RB, Jacob CK. Haemodialysis for end-stage renal disease in Southern India-a perspective from a tertiary care centre. Nephrol Dial Transplant. 1998;13:2494–500. doi: 10.1093/ndt/13.10.2494. [DOI] [PubMed] [Google Scholar]
- 32.Kher V. End-stage renal disease in developing countries. Kidney Int. 2002;62:350–62. doi: 10.1046/j.1523-1755.2002.00426.x. [DOI] [PubMed] [Google Scholar]
- 33.Puri S, Marwaha RK, Agarwal N, Tandon N, Agarwal R, Grewal K, et al. Vitamin D status of apparently healthy schoolgirls from two different socioeconomic strata in Delhi: Relation to nutrition and lifestyle. Br J Nutr. 2008;99:876–82. doi: 10.1017/S0007114507831758. [DOI] [PubMed] [Google Scholar]
- 34.Harinarayan CV, Ramalakshm IT, Venkataprasad U. High prevalence of low dietary calcium and low vitamin D status in healthy south Indians. Asia Pac J Clin Nutr. 2004;13:359–64. [PubMed] [Google Scholar]
- 35.Jabbar Z, Aggarwal PK, Chandel N, Kohli HS, Gupta KL, Sakhuja V, et al. High prevalence of vitamin D deficiency in north Indian adults is exacerbated in those with chronic kidney disease. Nephrology (Carlton) 2009;14:345–9. doi: 10.1111/j.1440-1797.2008.01082.x. [DOI] [PubMed] [Google Scholar]
- 36.Nordin BEC. Calcium requirement is a sliding scale. Am J Clin Nutr. 2000;71:1381–3. doi: 10.1093/ajcn/71.6.1381. [DOI] [PubMed] [Google Scholar]
- 37.2007. [Last assessed on 2010 April 26]. Available from: http://www.dopps.org/annualreport/html/ca_alb_mostrec2009.htm. DOPPS 3 .