Abstract
The purpose of this investigation was to assess the correlation of two biomarkers with the occurrence of renal flares in systemic lupus erythematosus (SLE). Urine levels of monocyte chemotactic protein-1 (MCP-1) and transforming growth factor beta (TGF-β) were measured at baseline, and at two and four months in five groups of patients: 25 lupus nephritis patients with active disease (active LN), 10 lupus nephritis patients with SLE in remission (remission LN), 25 patients with clinical active SLE and without nephritis (active NLN), 10 patients without nephritis with SLE in remission (remission NLN) and 10 healthy controls. We used repeated measurement and ANOVA with Duncan's post hoc to analyze the data; the urine level of the two proteins could distinguish the groups based on the existence of lupus nephritis and/or activity of SLE disease. Furthermore we performed receiver operating curve analysis to identify a cutoff point with a good sensitivity and specificity to diagnose lupus nephritis with either one of the urine proteins. Finally the samples from active LN were grouped according to whether they were Class IV or other classes. Baseline urinary MCP-1, but not TGF-β, was significantly different between the classes. Further investigation into the use of these cytokines in a prospective study is needed to determine their capacity as diagnostic tools for renal flares.
Keywords: Lupus nephritis, monocyte chemotactic protein-1, systemic lupus erythematosus, transforming growth factor beta
Introduction
Systemic lupus erythematosus (SLE) is a chronic inflammatory disease of unknown cause. It has a reported prevalence of 20 to 150 cases per 100,000 in the US population.[1–3] Renal involvement as shown by abnormal urinalysis and/or renal function is present in as many as 75% cases at some point.[4] In some, the symptoms may not be evident early in the course of disease,[5–7] therefore clinical findings underestimate the true prevalence of renal involvement. Within the first one to two years after diagnosis of SLE, renal abnormalities appear with nephropathy occurring in 30% in the next decade.[1,8–12] A large portion of these patients will progress to end-stage renal disease.[13]
Renal biopsies have remained the “gold standard” of assessing lupus nephritis (LN) patients not only at diagnosis but also to assess the efficacy of treatment. But this may not always be feasible due to the invasive nature of the procedure. That is why replacements have been sought in the plasma and urine. The ability of these markers to predict the “gold standard”, such as renal biopsy scores or longer-term outcome, is imperative to make them reliable.[14]
Two promising candidates were taken into account for this study: monocyte chemotactic protein 1 (MCP-1), also known as chemokine CCL2, and transforming growth factor beta (TGF-β). They have been shown to correlate with disease activity in SLE and renal flare associated with the disease, and a role in its pathogenesis has been proposed.[14–26] We assessed the urine levels of these two proteins and compared them to findings on renal biopsies where available. The aim was to assess the levels of these two cytokines in these five different groups.
Materials and Methods
This study was done on five populations, composed of 25 LN patients with active disease (active LN), 10 LN patients with disease in remission (remission LN), 25 patients with clinical active disease but without nephritis (active NLN), 10 patients without nephritis with disease in remission (remission NLN) and 10 healthy controls. Patients with co-morbid conditions such as diabetes mellitus, hypertension, or those on antibiotic therapy at the time were excluded from the study groups. Lupus nephritis and/or active SLE received treatment.
Renal flare in LN was defined as ≥300 mg protein in a 24-h urine collection and/or a 25% increase in serum creatinine.[27,28] Patients without LN in the past two years were considered NLN.
Diagnosis of SLE was based on having four or more criteria according to the American College of Rheumatology criteria for SLE.[29] Active disease was based on having a score of 6 or more according to the systemic lupus erythematosus disease activity index (SLEDAI).[15] Those without manifestations of activity in the past six months were considered in remission.
Biopsy samples were placed in 10% formalin and were later dehydrated and embedded in paraffin in an automated machine (Autotechnicon Duo® MOD. 2A, Technicon Corporation, USA); 5-μm-thick sections were cut using a microtome (Leitz 1512 Microtome (WS-LEITZ1512), Ernst Leitz Wetzlar GmBH, Germany).
Twenty-two patients with LN and active disease and nine with LN in remission had biopsy specimens for this study. Classification was done according to the criteria from ISN/RPS.[17–19] The histological activity and chronicity index of each biopsy sample was calculated after preparation.[30] The histological activity index was the sum of semiquantitative manual scores (each ranging from 0-3) for the following parameters: endocapillary hypercellularity, leukocyte infiltration, subendothelial hyaline deposits, interstitial inflammation, necrosis, and cellular crescents. Scores of the last two parameters were counted double, therefore the activity index ranged from 0–24. The chronicity index was the sum of semiquantitative scores (each ranging 0-3) for the following parameters: Glomerular sclerosis, fibrous crescents, tubular atrophy, and interstitial fibrosis. The score ranged from 0–12. All biopsy specimens were scored and evaluated by one board-certified pathologist. Biopsies were performed as part of their standard clinical indications in patients suspected of having renal involvement related to SLE.
Patients were asked to provide freshly voided, whole-stream, early-morning urine samples three times, at baseline and later at two-month intervals on each visit. The urine samples were provided in the lab and were soon centrifuged to remove supernatants and frozen in small aliquots without further manipulation at –80°C for chemokine analysis at the end of the study. It has been shown that the freezing procedure protects the samples from deterioration and they can be used after thawing.[14,27] Urine samples were cultured to exclude the possibility of infection.
All patients with LN received pulse methylprednisolone 500- 1000 mg/day for three consecutive days followed by one dose of cyclophosphamide 500-1000 mg on the fourth day. From the fifth day onwards therapy was changed to prednisolone 1 mg/kg/day for two months and was gradually tapered throughout one month and later continued at 5-10 mg/day. Cyclophosphamide was administered 500-1000 mg IV once per month for six to eight months, which was later changed to every three months for at least one year.
Both groups with SLE activity regardless of their kidney involvement received maintenance steroid therapy, hydroxychlroquine sulfate and calcium D supplement.
Urine MCP-1 (uMCP-1) was measured using the human MCP-1 kit (BMS281, manufactured by Bender MedSystems GmbH®, Vienna, Austria, Europe). Limit of detection for the kit was 2.31 pg/ml. Urine TGF-β2 (uTGF-β2) protein was measured using human TGF-β2 Elisa kit (BMS254, manufactured by Bender MedSystems GmbH®, Vienna, Austria, Europe). Limit of detection for the kit was 6.6 pg/ml. Both cytokines were measured by specific enzyme-linked immunosorbent assay (ELISA) according to the manufacturer's instructions. This assay employed the quantitative sandwich enzyme immunoassay technique. Results were reported as pg/ml. According to the manufacturer's guide samples would remain stable when frozen at –20°C and then thawed for analysis.
Statistical analysis was performed using SPSS for Windows, version 15.0 (SPSS software for Windows, Chicago, IL, USA). The results are presented as mean ± standard deviation (SD) unless specified otherwise. Urine MCP-1 and uTGF-β2 were compared between groups and at different time intervals by repeated measurement. They were also compared between groups at baseline by one-way ANOVA and Duncan's post hoc to determine difference of means between groups. Pearson's correlation between activity index and uMCP-1 and uTGF-β2 was used. We used the receiver operating characteristic (ROC) curve to determine the best value of uMCP-1 and uTGF-β2 with the highest sensitivity and specificity to differentiate patients with LN from those without LN. P values less than 0.05 were considered significant. All probabilities were two-tailed.
Results
We studied 70 SLE patients in total. The baseline demographic and characteristics of these groups have been provided in Table 1. Among the two groups with LN (active LN and remission LN) 31 underwent kidney biopsy (22 and nine respectively). Groups did not differ regarding age (P = 0.585).
Table 1.
Demographics and characteristics of the study groups*
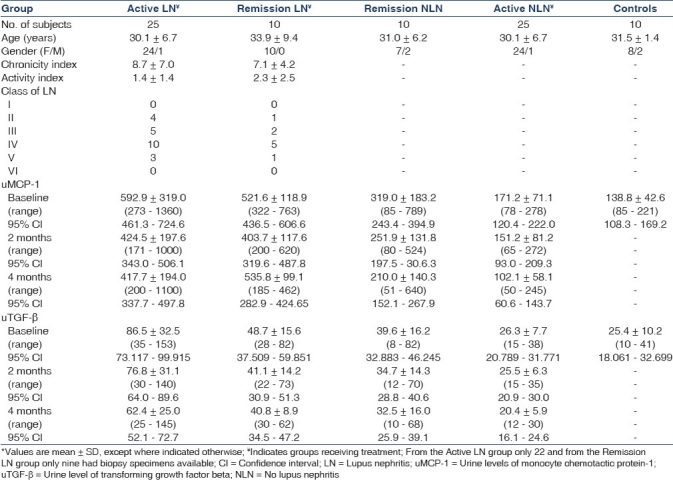
The maximum mean level of both uMCP-1 and uTGF-β2 was in the active LN group, while the minimum belonged to the control group. The mean levels of these substances in the urine at baseline were significantly different in the five groups [Table 1]. The five groups of patients were classified according to similarity in their mean uMCP-1 and uTGF-β2 [Table 2].
Table 2.
Mean urine levels of cytokines in each group compared at baseline

The groups were arranged into three subsets according to their uMCP-1 values. Subset 1 were those with LN regardless of their SLE activity; they had the highest amount of uMCP-1 in their urine compared to other groups, but they did not differ from each other. Subset 2 was those without nephritis regardless of disease activity. The mean value of uMCP-1 in the first subset (572.54 pg/ml) was more than twice that of the mean value of the second subset (276.76 pg/ml). The control group formed a third subset which showed a similar value to the Active NLN group. This caused an overlap between the last two subsets.
In assessing the uTGF-β2 level three subsets appeared again. The first subset was the Active LN group, which had the highest level of uTGF-β2. The second subset consisted of those with SLE in remission regardless of their nephritis. This group overlapped with the third subset which consisted of patients without nephritis regardless of the clinical activity of SLE and healthy controls. The mean value of uTGF-β2 in the first subset (86.52 pg/ml) was more than twice that of the combined mean value of the second subset (42.17 pg/ml).
We combined the groups Active LN and Remission LN into a group 35-strong and assessed the internal correlation between uMCP-1 and uTGF-β2. Urine MCP-1 at four months correlated positively with uTGF-β2 at all time intervals (baseline: r = 0.458, P = 0.006; 2 mo: r = 0.395, P = 0.019; 4 mo: r = 0.483, P = 0.003). Urine TGF-β2 at four months also correlated positively with uMCP-1 at all time intervals (baseline: r = 0.443, P = 0.008; 2 mo: r = 0.418, P = 0.12; 4mo: r = 0.483, P = 0.003). The only time when both correlated with each other in the same cross-sectional time interval was at four months after treatment. In the rest of time intervals there was no significant correlation between the two cytokine levels at corresponding months in the urine.
Using receptor operating curve analysis, we calculated a cutoff point with maximum sensitivity and specificity for urine levels of cytokines to discriminate between patients with LN and those without it regardless of the activity of SLE disease. Urine MCP-1 [Figure 1] had the higher sensitivity and uTGF-β2 [Figure 2] had the higher specificity. We recalculated these values excluding the control group, the results appeared similar (data not shown).
Figure 1.
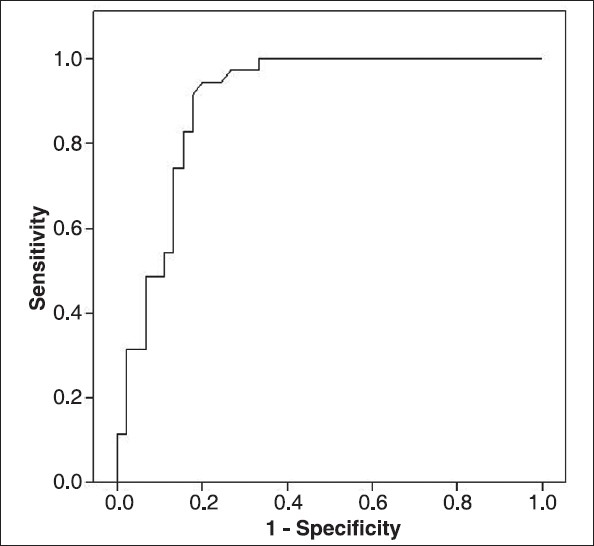
Receiver operating characteristic curve for baseline uMCP- 1. Cutoff point to diagnose LN regardless of SLE activity was 304.5 pg/ml with a sensitivity of 94.3 (95% CI 80.8%-99.1%), specificity of 80% (95% CI 65.4%-90.4%), and AUC = 0.900
Figure 2.
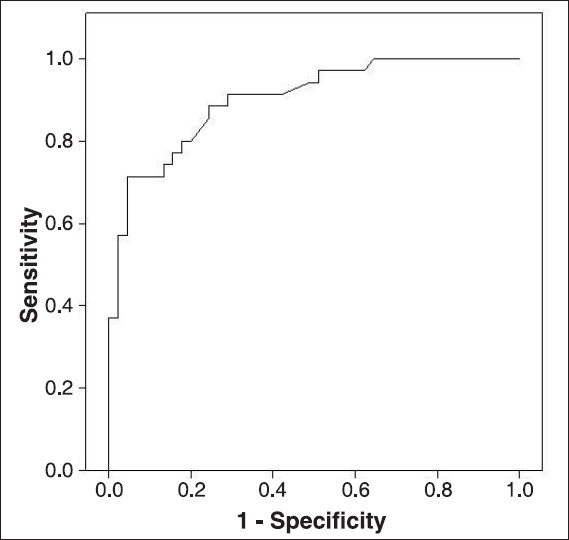
Receiver operating characteristic curve for baseline uTGF-β2. Cutoff point to diagnose LN regardless of SLE activity was 54.2 pg/ml with a sensitivity of 71.4% (95% CI 53.7%-85.3%), specificity 95.6% (95% CI 84.8%-99.3%), and AUC = 0.902
Both urine cytokines at baseline correlated positively with the class of LN (uMCP-1: r = 0.454, P = 0.010; uTGF-β2: r = 0.421, P = 0.018). They also correlated positively with the histological activity index (uMCP-1: r = 0.409, P = 0.022; uTGF-β2: r = 0.371, P = 0.040) at baseline. They did not, however, correlate with the chronicity index. Neither histological index correlated with the class of LN. The two indices also did not correlate with each other. Specimens with a histological activity score of >12 had a significantly higher level of uMCP-1 and uTGF-β2 at baseline than those ≤12 (uMCP-1: 795.100 ± 392.4 vs. 470.5 ± 148.6, respectively, P = 0.029; uTGF-β: 96.0 ± 27.4 vs. 64.2 ± 30.7, respectively, P = 0.009) [Figures 3 and 4]. Only 31 patients were included as only 22 patients from the active LN group and nine from the remission LN group had biopsies available for the aforementioned analyses and only baseline values of urine cytokines were used.
Figure 3.
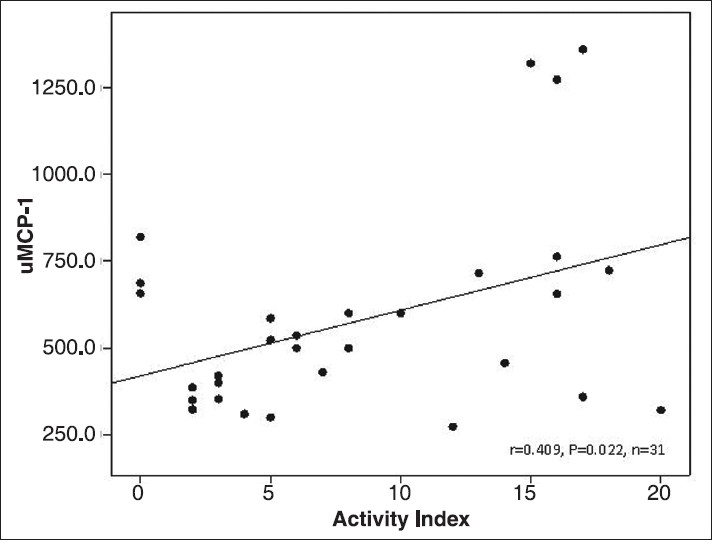
Correlation between baseline uMCP-1 (pg/ml) and histological activity index on the kidney biopsy specimens of patients with LN
Figure 4.
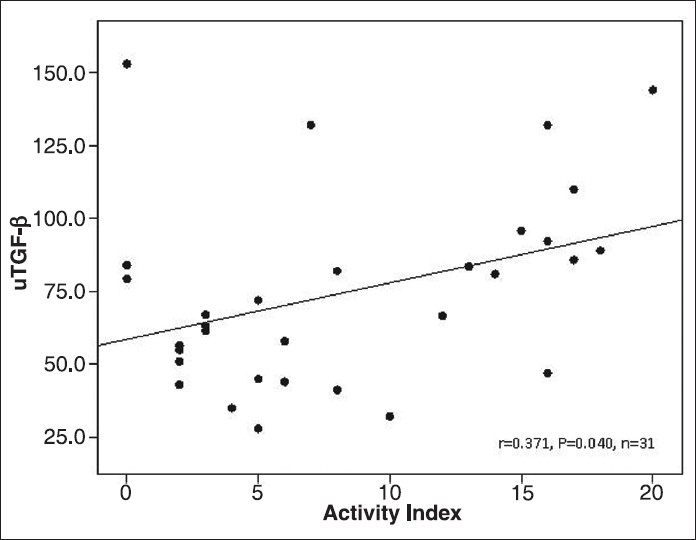
Correlation between baseline uTGF-β2 (pg/ml) and histological activity index on the kidney biopsy specimens of patients with LN
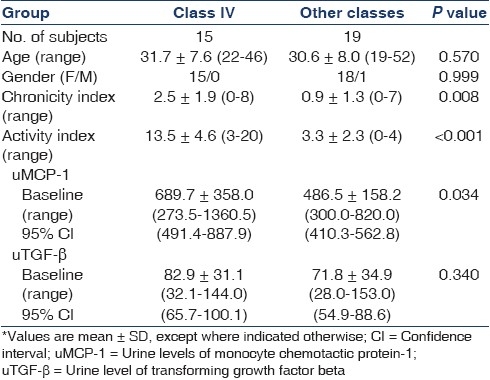
We categorized patients with LN in groups according to whether they were Class IV or not. Their characteristics have been outlined and compared in Table 3.
Table 3.
Patient characteristics according to their lupus class*
Figures 5 and 6 show the trend of decrease of uMCP-1 and uTGF-β2 in patients in the four groups, at two months’ intervals (healthy controls were not included in this analysis as only baseline values were available). When we took time and grouping into consideration simultaneously, the trend of decline in uMCP-1 amongst the four groups was similar (P = 0.111), but the trend of decline in uTGF-β2 in the groups was different (P = 0.001). This was because uTGF-β2 in the active NLN group from baseline to two months decreased only 0.2 ± 22.3% while the decline in the other three groups was 11.5 ± 7.8%, 15.6 ± 10% and 5.9 ± 34.0% respectively, for active LN, remission LN and Remission NLN. From two months to the end of the study the groups active LN and active NLN decreased 16.3 ± 19.3% and 18.0 ± 23.2% respectively; this was in contrast to the decline observed in remission NLN at only 6.3 ± 28.8% and the rise of uTGF-β2 by 5.4 ± 28.7% in the remission LN group.
Figure 5.
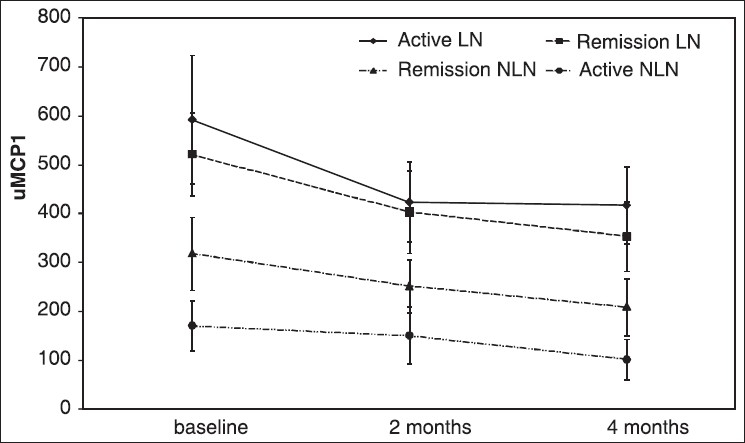
Trend of decrease in uMCP-1 levels from baseline to four months
Figure 6.
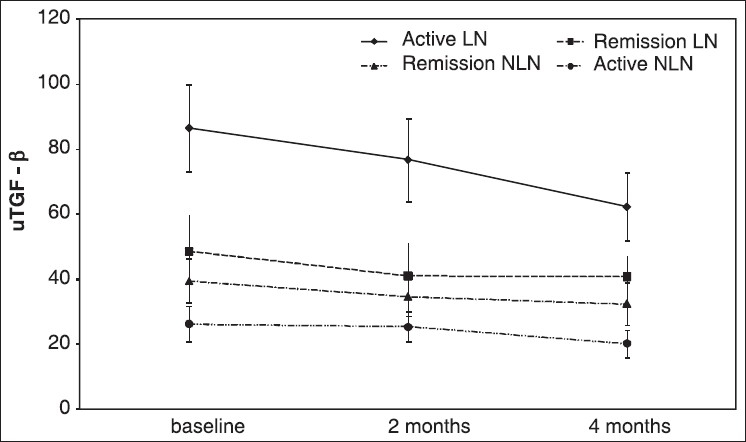
Trend of uTGF-β2 level from baseline to four months
When groups with LN were made into two groups according to their class (Class IV versus Other classes) and their response to treatment was assessed, the results showed that the trend of decline was not significantly different amongst them (data not shown).
Discussion
Both MCP-1 and TGF-β have been proposed as candidates in the pathogenesis of renal damage in inflammatory states such as SLE.[16] In a previous study, mRNA expression of MCP-1 and TGF-β in urinary sediments of patients with LN decreased with treatment, correlating with clinical activity of the disease and SLEDAI score and histological activity index. The protein product level of MCP-1, but not TGF-β, correlated with the SLEDAI score but neither correlates with the histological activity index.[23]
Transforming growth factor beta (TGF-β) levels in the plasma and urine correlate with SLEDAI[14] in children. Decreased plasma levels and increased urinary excretion of TGF-β has been shown in children with active LN.[21] The glomerular or tubular gene expression of TGF-β has no correlation with serological markers of lupus activity in the kidney; however, its tubulointerstitial expression may be indicative of chronic renal damage as it correlates with the chronicity index.[20]
Monocyte chemotactic protein-1 (MCP-1) has been shown to increase in gene expression and urine excretion in patients with LN and those with LN flare. It has proven to be sensitive and specific for renal flare in contrast to other renal diseases. It remains a valid biomarker even for patients on maintenance immunosuppression. The amount found in urine does not correlate with the plasma level, leading to the conclusion that it is local production in the kidney, not simply filtration, that increases the urine levels in SLE flare. It is thought to be involved in the pathogenesis of LN by mediating leukocyte infiltration.[16,22,26,27] Glomerular expression of MCP-1 correlates with serological markers of lupus activity such as C3, C4 as well as with the activity index on histological examination[17–19] while the tubular expression correlates with the chronicity index and the percentage of cortical fibrosis.[20] Urine MCP-1 was associated with LN in an experimental model.[31]
By dividing the groups according to their urine cytokine levels we attempted to see if these could discriminate between the different groups. Interestingly uMCP-1 values could discriminate between groups according to whether they had LN or not regardless of their SLE activity, while uTGF-β2 values only usefully discriminated between groups with LN according to their SLE activity [Table 2]. Just as intrarenal gene expressions of these cytokines are indicative of the disease involving the kidneys and not systemic activity,[20] urine protein levels seem to have the same discriminating ability.
We also tried a cutoff point for both cytokines which had a very good sensitivity, specificity and area under curve (AUC) for uMCP-1 level to separate patients with and without LN. For uTGF-β2 the test was very specific but lacked a satisfactory sensitivity. This is important in achieving the goal of excluding renal biopsies for select patients while being able to identify those who are highly likely to have renal involvement in flare episodes.
Both cytokines correlated positively and significantly with the class of LN and the histological activity index. This also shows that they are indicative of how advanced the disease is and since they did not correlate with the histological chronicity index it can be assumed that they are indicators of acute involvement rather than long-term damage as seen on the renal biopsy specimens. There is a significant correlation between the glomerular expression of MCP-1 and histological activity and its tubulointerstitial expression and the chronicity index.[20] Our findings are in line with the current notion that MCP-1 and TGF-β are involved in the pathogenesis of renal involvement in SLE.[20,32,33] A previous study had observed a similar trend for urine levels of mRNA of these cytokines but urine protein levels did not correlate with either histological index.[23] Their limit of detection for uMCP-1 and uTGF-β was ×2 and ×2.3 times less sensitive than that of ours respectively. This could also explain why they could not detect uTGF-β in some samples. Our results show that the urine level of these cytokines can be a useful marker and does correlate with indices related to LN. Also, the method utilized is less expensive and laborious in comparison to real-time polymerase chain reaction (PCR). In another study uMCP-1 was shown to be significantly associated with manifestations of severe renal injury[34] and it was also shown that if patients develop active SLE while on immunosuppressive therapy, rise of this marker can be used as an indicator of LN as it correlates with local kidney involvement and not systemic increase in SLE activity. It was also a sensitive and specific biomarker of renal flare and the severity of renal injury in SLE. More interestingly this rise was observed a few months in advance suggesting a pathogenic and predictive role.
We also observed a correlation between the cytokine levels themselves. Only at the end of the study did both correlate positively at the same cross-section. We could not find an explanation for the observed significant correlations of uMCP-1 levels at four months with uTGF-β2 levels observed at baseline and two months, and vice versa. Whether this shows that these cytokine expressions affect the production and subsequent rise in urine of the other can only be speculated. Another study, which had included the mRNA levels in the urine of both cytokines, had however found a significant internal correlation between the two.[20]
Urine levels of both cytokines decreased in response to treatment. Urine TGF-β2 levels steadily declined over the course of four months and were substantially different from other groups at all time intervals. Urine MCP-1 levels had a sharper decrease in the first two months and could differentiate the two groups with LN (Active LN and Remission LN) from the rest, but not from each other.
Finally, Class IV of LN showed a distinctively higher chronicity and activity as well as baseline uMCP- 1, but not uTGF-β. As Class IV is known to have a worse prognosis, the difference in the histological indices was not a surprise. Activity index differed more prominently indicating that Class IV cases experience more inflammation during flares. As to why uTGF-β at baseline did not differ, an explanation could not be offered.
A number of other biomarkers have been studied with regard to renal SLE flares. Increased plasma and urine levels of adiponectin have been detected in patients with SLE, particularly in those with renal flare. Interestingly, urinary levels of adiponectin, particularly the high molecular weight isoform, rise in renal SLE flare and not nonrenal SLE flare.[35,36] Within a four-month period before and after renal flare, urine concentrations of hepcidin 20 and 25 correlated with the occurrence of a flare.[37] Neutrophil gelatinase-associated lipocalin also increases in urine and plasma, and can predict the worsening of renal childhood-onset SLE up to three months prior to the exacerbation.[38]
Our study had a number of shortcomings. Firstly, we used a spot urine sample for determining the protein levels; ideally we should have included urine creatinine to create a protein-to-creatinine ratio to adjust the values for fluctuating levels of urine cytokines. Secondly, a more populous study should be done to be able to focus on different aspects, such as different classes of LN and to increase the certainty of cutoff points mentioned in this study. Lastly, we lacked a follow-up on our control group at two and four months which could have provided a better comparison with the trend of decline in the other groups.
Conclusion
This study shows that MCP-1 and TGF-β increase in renal flare of SLE. Their capacity to be used as a diagnostic tool to identify a renal flare in patients should be assessed in a prospective longitudinal follow-up starting from a few months before the occurrence of flare.
Acknowledgments
Fariborz Azad, DVM from the immunology lab, Pathology Department, Shiraz University of Medical Sciences performed the cytokine measurements. This thesis was supported by a grant from the Shiraz Nephrology Urology Research Center, Shiraz University of Medical Sciences. Grant number 86-3408.
Footnotes
Source of Support: Shiraz Nephrology Urology Research Center, Shiraz University of Medical Sciences
Conflict of Interest: None declared.
References
- 1.Chakravarty EF, Bush TM, Manzi S, Clarke AE, Ward MM. Prevalence of adult systemic lupus erythematosus in California and Pennsylvania in 2000: Estimates obtained using hospitalization data. Arthritis Rheum. 2007;56:2092–4. doi: 10.1002/art.22641. [DOI] [PMC free article] [PubMed] [Google Scholar]
- 2.Pons-Estel GJ, Alarcón GS, Scofield L, Reinlib L, Cooper GS. Understanding the epidemiology and progression of systemic lupus erythematosus. Semin Arthritis Rheum. 2010;39:257–68. doi: 10.1016/j.semarthrit.2008.10.007. [DOI] [PMC free article] [PubMed] [Google Scholar]
- 3.Lawrence RC, Helmick CG, Arnett FC, Deyo RA, Felson DT, Giannini EH, et al. Estimates of the prevalence of arthritis and selected musculoskeletal disorders in the United States. Arthritis Rheum. 1998;41:778–99. doi: 10.1002/1529-0131(199805)41:5<778::AID-ART4>3.0.CO;2-V. [DOI] [PubMed] [Google Scholar]
- 4.Firestein GS. Philadelphia: Elsevier WB Saunders; 2008. Kelley's Textbook of Rheumatology; p. 1270. [Google Scholar]
- 5.Zabaleta-Lanz ME, Muñoz LE, Tapanes FJ, Vargas-Arenas RE, Daboin I, Barrios Y, et al. Further description of early clinically silent lupus nephritis. Lupus. 2006;15:845–51. doi: 10.1177/0961203306070002. [DOI] [PubMed] [Google Scholar]
- 6.Leehey DJ, Katz AI, Azaran AH, Aronson AJ, Spargo BH. Silent diffuse lupus nephritis: Long-term follow-up. Am J Kidney Dis. 1982;2:188–96. [PubMed] [Google Scholar]
- 7.Wada Y, Ito S, Ueno M, Nakano M, Arakawa M, Gejyo F. Renal outcome and predictors of clinical renal involvement in patients with silent lupus nephritis. Nephron Clin Pract. 2004;98:c105–11. doi: 10.1159/000081551. [DOI] [PubMed] [Google Scholar]
- 8.Cervera R, Khamashta MA, Font J, Sebastiani GD, Gil A, Lavilla P, et al. Systemic lupus erythematosus: Clinical and immunologic patterns of disease expression in a cohort of 1,000 patients.The European Working Party on Systemic Lupus Erythematosus. Medicine (Baltimore) 1993;72:113–24. [PubMed] [Google Scholar]
- 9.Cervera R, Khamashta MA, Font J, Sebastiani GD, Gil A, Lavilla P, et al. Morbidity and mortality in systemic lupus erythematosus during a 10-year period: A comparison of early and late manifestations in a cohort of 1,000 patients. Medicine (Baltimore) 2003;82:299–308. doi: 10.1097/01.md.0000091181.93122.55. [DOI] [PubMed] [Google Scholar]
- 10.Kasitanon N, Magder LS, Petri M. Predictors of survival in systemic lupus erythematosus. Medicine (Baltimore) 2006;85:147–56. doi: 10.1097/01.md.0000224709.70133.f7. [DOI] [PubMed] [Google Scholar]
- 11.Alarcón GS, McGwin G, Jr, Petri M, Reveille JD, Ramsey-Goldman R, Kimberly RP, et al. Baseline characteristics of a multiethnic lupus cohort: PROFILE. Lupus. 2002;11:95–101. doi: 10.1191/0961203302lu155oa. [DOI] [PubMed] [Google Scholar]
- 12.To CH, Petri M. Is antibody clustering predictive of clinical subsets and damage in systemic lupus erythematosus? Arthritis Rheum. 2005;52:4003–10. doi: 10.1002/art.21414. [DOI] [PubMed] [Google Scholar]
- 13.Ward MM. Changes in the incidence of endstage renal disease due to lupus nephritis in the United States, 1996-2004. J Rheumatol. 2009;36:63–7. doi: 10.3899/jrheum.080625. [DOI] [PMC free article] [PubMed] [Google Scholar]
- 14.Li Y, Tucci M, Narain S, Barnes EV, Sobel ES, Segal MS, et al. Urinary biomarkers in lupus nephritis. Autoimmun Rev. 2006;5:383–8. doi: 10.1016/j.autrev.2005.10.006. [DOI] [PubMed] [Google Scholar]
- 15.Bombardier C, Gladman DD, Urowitz MB, Caron D, Chang CH. Derivation of the SLEDAI.A disease activity index for lupus patients: The Committee on Prognosis Studies in SLE. Arthritis Rheum. 1992;35:630–40. doi: 10.1002/art.1780350606. [DOI] [PubMed] [Google Scholar]
- 16.Segerer S, Nelson PJ, Schlöndorff D. Chemokines, chemokine receptors, and renal disease: From basic science to pathophysiologic and therapeutic studies. J Am Soc Nephrol. 2000;11:152–76. doi: 10.1681/ASN.V111152. [DOI] [PubMed] [Google Scholar]
- 17.Weening JJ, D’Agati VD, Schwartz MM, Seshan SV, Alpers CE, Appel GB, et al. The classification of glomerulonephritis in systemic lupus erythematosus revisited. Kidney Int. 2004;65:521–30. doi: 10.1111/j.1523-1755.2004.00443.x. [DOI] [PubMed] [Google Scholar]
- 18.Weening JJ, D’Agati VD, Schwartz MM, Seshan SV, Alpers CE, Appel GB, et al. The classification of glomerulonephritis in systemic lupus erythematosus revisited. J Am Soc Nephrol. 2004;15:241–50. doi: 10.1097/01.asn.0000108969.21691.5d. [DOI] [PubMed] [Google Scholar]
- 19.Furness PN, Taub N. Interobserver reproducibility and application of the ISN/RPS classification of lupus nephritis-a UK-wide study. Am J Surg Pathol. 2006;30:1030–5. doi: 10.1097/00000478-200608000-00015. [DOI] [PubMed] [Google Scholar]
- 20.Chan RW, Lai FM, Li EK, Tam LS, Chow KM, Lai KB, et al. Intrarenal cytokine gene expression in lupus nephritis. Ann Rheum Dis. 2007;66:886–92. doi: 10.1136/ard.2006.063123. [DOI] [PMC free article] [PubMed] [Google Scholar]
- 21.Hammad AM, Youssef HM, El-Arman MM. Transforming growth factor beta 1 in children with systemic lupus erythematosus: A possible relation with clinical presentation of lupus nephritis. Lupus. 2006;15:608–12. doi: 10.1177/0961203306071873. [DOI] [PubMed] [Google Scholar]
- 22.Rovin BH, Birmingham DJ, Nagaraja HN, Yu CY, Hebert LA. Biomarker discovery in human SLE nephritis. Bull NYU Hosp Jt Dis. 2007;65:187–93. [PubMed] [Google Scholar]
- 23.Chan RW, Lai FM, Li EK, Tam LS, Wong TY, Szeto CY, et al. Expression of chemokine and fibrosing factor messenger RNA in the urinary sediment of patients with lupus nephritis. Arthritis Rheum. 2004;50:2882–90. doi: 10.1002/art.20471. [DOI] [PubMed] [Google Scholar]
- 24.Chan RW, Lai FM, Li EK, Tam LS, Chow KM, Li PK, et al. The effect of immunosuppressive therapy on the messenger RNA expression of target genes in the urinary sediment of patients with active lupus nephritis. Nephrol Dial Transplant. 2006;21:1534–40. doi: 10.1093/ndt/gfk102. [DOI] [PubMed] [Google Scholar]
- 25.Wada T, Yokoyama H, Su SB, Mukaida N, Iwano M, Dohi K, et al. Monitoring urinary levels of monocyte chemotactic and activating factor reflects disease activity of lupus nephritis. Kidney Int. 1996;49:761–7. doi: 10.1038/ki.1996.105. [DOI] [PubMed] [Google Scholar]
- 26.Noris M, Bernasconi S, Casiraghi F, Sozzani S, Gotti E, Remuzzi G, et al. Monocyte chemoattractant protein-1 is excreted in excessive amounts in the urine of patients with lupus nephritis. Lab Invest. 1995;73:804–9. [PubMed] [Google Scholar]
- 27.Illei GG, Takada K, Parkin D, Austin HA, Crane M, Yarboro CH, et al. Renal flares are common in patients with severe proliferative lupus nephritis treated with pulse immunosuppressive therapy: Long-term followup of a cohort of 145 patients participating in randomized controlled studies. Arthritis Rheum. 2002;46:995–1002. doi: 10.1002/art.10142. [DOI] [PubMed] [Google Scholar]
- 28.Moroni G, Quaglini S, Maccario M, Banfi G, Ponticelli C. “Nephritic flares” are predictors of bad long-term renal outcome in lupus nephritis. Kidney Int. 1996;50:2047–53. doi: 10.1038/ki.1996.528. [DOI] [PubMed] [Google Scholar]
- 29.Tan EM, Cohen AS, Fries JF, Masi AT, McShane DJ, Rothfield NF, et al. The 1982 revised criteria for the classification of systemic lupus erythematosus. Arthritis Rheum. 1982;25:1271–7. doi: 10.1002/art.1780251101. [DOI] [PubMed] [Google Scholar]
- 30.Grande JP, Balow JE. Renal biopsy in lupus nephritis. Lupus. 1998;7:611–7. doi: 10.1191/096120398678920730. [DOI] [PubMed] [Google Scholar]
- 31.Tucci M, Calvani N, Richards HB, Quatraro C, Silvestris F. The interplay of chemokines and dendritic cells in the pathogenesis of lupus nephritis. Ann N Y Acad Sci. 2005;1051:421–32. doi: 10.1196/annals.1361.084. [DOI] [PubMed] [Google Scholar]
- 32.Grande JP. Mechanisms of progression of renal damage in lupus nephritis: pathogenesis of renal scarring. Lupus. 1998;7:604–10. doi: 10.1191/096120398678920721. [DOI] [PubMed] [Google Scholar]
- 33.Ferraccioli G, Romano GG. Renal interstitial cells, proteinuria and progression of lupus nephritis: New frontiers for old factors. Lupus. 2008;17:533–40. doi: 10.1177/0961203307088002. [DOI] [PubMed] [Google Scholar]
- 34.Rovin BH, Song H, Birmingham DJ, Hebert LA, Yu CY, Nagaraja HN. Urine chemokines as biomarkers of human systemic lupus erythematosus activity. J Am Soc Nephrol. 2005;16:467–73. doi: 10.1681/ASN.2004080658. [DOI] [PubMed] [Google Scholar]
- 35.Rovin BH, Song H, Hebert LA, Nadasdy T, Nadasdy G, Birmingham DJ, et al. Plasma, urine, and renal expression of adiponectin in human systemic lupus erythematosus. Kidney Int. 2005;68:1825–33. doi: 10.1111/j.1523-1755.2005.00601.x. [DOI] [PubMed] [Google Scholar]
- 36.Song H, Chan J, Rovin BH. Induction of chemokine expression by adiponectin in vitro is isoform dependent. Transl Res. 2009;154:18–26. doi: 10.1016/j.trsl.2009.04.003. [DOI] [PMC free article] [PubMed] [Google Scholar]
- 37.Zhang X, Jin M, Wu H, Nadasdy T, Nadasdy G, Harris N, et al. Biomarkers of lupus nephritis determined by serial urine proteomics. Kidney Int. 2008;74:799–807. doi: 10.1038/ki.2008.316. [DOI] [PMC free article] [PubMed] [Google Scholar]
- 38.Hinze CH, Suzuki M, Klein-Gitelman M, Passo MH, Olson J, Singer NG, et al. Neutrophil gelatinase-associated lipocalin is a predictor of the course of global and renal childhood-onset systemic lupus erythematosus disease activity. Arthritis Rheum. 2009;60:2772–81. doi: 10.1002/art.24751. [DOI] [PMC free article] [PubMed] [Google Scholar]


