Abstract
Aim of the Study:
To establish the normative database for multifocal electroretinogram (mfERG) parameters in a normal emmetropic population. To correlate the data so obtained with the central macular thickness obtained using the optical coherence tomography (OCT) scan.
Materials and Methods:
mfERG data were obtained from 222 eyes of 111 emmetropic subjects. The amplitude (nv/deg2) and implicit times (ms) of the first-order kernel mfERG responses (N1, P1, and N2 waves) were obtained and grouped into five rings (Ring 1: Central 2°, Ring 2: 2–5°, Ring 3: 5–10°, Ring 4: 10–15°, Ring 5: >15°). The central macular thickness (CMT) was obtained using the macular thickness scan protocol of the OCT.
Results:
The mfERG data obtained were used to create a normative database. The amplitudes of the mfERG waves were maximum in the fovea and progressively decreased with increasing eccentricity (P = 0.0001). The latencies of the P1 and N2 waves were longest in the central ring and progressively shortened with eccentricity (P = 0.0001). No statistically significant correlations were observed between central ring 1 parameters and the CMT.
Conclusion:
This study establishes normative database for mfERG parameters in an emmetropic population. No statistically significant correlation was noted between CMT and mfERG parameters.
Keywords: Central macular thickness, multifocal electroretinogram, normative database, optical coherence tomography
The multifocal electroretinogram (mfERG) introduced by Sutter and Tran uses a pseudorandom binary m-sequence to stimulate multiple retinal areas to give a topographic array of retinal responses.[1] It contains different order response components of which the first-order kernel (K1) is derived from the average retinal response to a focal flash and represents activity from the outer to middle retinal layers especially the bipolar cells. Actual values obtained from normal retina are necessary to be able to study the mfERG recordings from pathological retina. This study aims to establish the largest such normative database by recording the mfERG responses in an emmetropic normal population. It also aims to correlate the electrophysiological assessment of the retina with the mfERG and the anatomical evaluation of the retina performed by the optical coherence tomography (OCT).
Materials and Methods
MfERGs and OCT scans were recorded in 222 eyes of 111 emmetropic subjects. Informed consent was obtained from each subject after full explanation of the procedure. The study was approved by the institutional review board and the research procedures used in this study followed the tenets of the Declaration of Helsinki. Subjects between 25 and 50 years of age, with best corrected visual acuity (BCVA) of 20/20 within a refractive error range of ± 0.5 D, and willing to give informed consent were included in the study. Subjects with any adnexal or ocular surface pathology precluding placement of the corneal electrode, any retinal pathology diagnosed on fundus examination, glaucoma or any spinal pathology preventing the patient from maintaining appropriate posture during the examination were excluded from participation. Investigations performed included cycloplegic refraction using 1% tropicamide, applanation tonometry, slit lamp examination, dilated fundus examination, mfERG, and central macular thickness measurement using optical coherence tomography (Stratus OCT 3, Carl Zeiss Meditec, Inc., Dublin, CA).
MfERG of both eyes was performed using the Metrovision vision monitor with scaled hexagons stimulating 61 zones. International Society for Clinical Electrophysiology in Vision (ICSEV) guidelines for recording the mfERG were followed.[2] Disposable monopolar scleral lenses (ERG jet electrode) and skin electrodes were used. At the default viewing distance, the stimulated field was ± 30° horizontally and ±24° vertically centered on the fovea. The central hexagon subtended an angle of 3.4° at a viewing distance of 30 cm, with increasing areas subtended by peripheral hexagons. The luminance of stimulation was 100 cd/m2, the stimulus screen being surrounded by a uniformly illuminated background cover with the luminance set at 30 cd/m2 to eliminate the rod responses. Stimuli were provided by a television monitor placed 30 cm before the test eye. The stimulus frequency was set at 17 Hz. Video monitoring based on a near infra red sensor that records the image of the eye was used for monitoring of fixation based on the Hirschberg principle. Five thousand responses were acquired over a period of 5 min for each eye.
The first-order kernel mfERG responses were measured. The amplitude (nv/deg2) and the implicit times (milliseconds) of the first negative wave (N1a and N1i, respectively), the first positive wave (P1a and P1i, respectively), and the second negative wave (N2a and N2i, respectively) were recorded. The amplitudes and implicit times were grouped into five rings [Fig. 1]: Ring 1 (R1): Central 2°, Ring 2 (R2): 2–5°, Ring 3 (R3): 5–10°, Ring 4 (R4): 10–15°, and Ring 5 (R5): > 15°.
Figure 1.
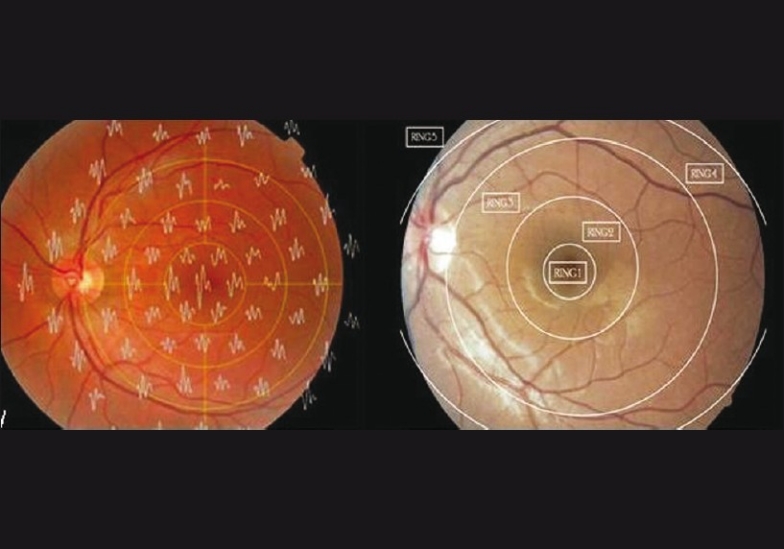
Superimposition of the trace array on the fundus photograph with diagrammatic representation of rings 1–5
The data obtained were exported to excel sheet. Statistical analysis was carried out using the SPSS software (v. 11.0). Pearson's coefficient was used to correlate the density-scaled responses obtained from the central ring with the central macular thickness (CMT). Analysis of variance (ANOVA) was used to correlate the change in mfERG responses with increasing eccentricity from the fovea. P < 0.05 was considered statistically significant.
Results
The normative values for mfERG N1, P1, and N2 amplitudes and implicit times for each ring are presented in Table 1. When the topographic responses obtained were correlated with the eccentricity from the fovea, statistically significant reduction in the amplitude and implicit time of the responses were observed for all parameters except for N1i [Figs. 2–7]. The mean CMT in the study group was 180.59 μ (range: 103–243; SD = 18.12). There was no statistically significant correlation between the central ring 1 mfERG parameters and CMT [Table 2].
Table 1.
Distribution of mfERG responses in emmetropia
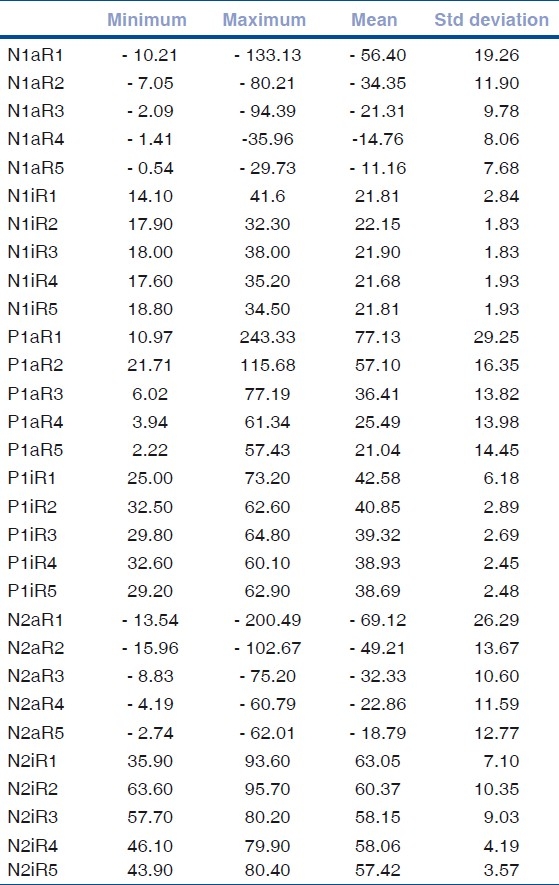
Figure 2.
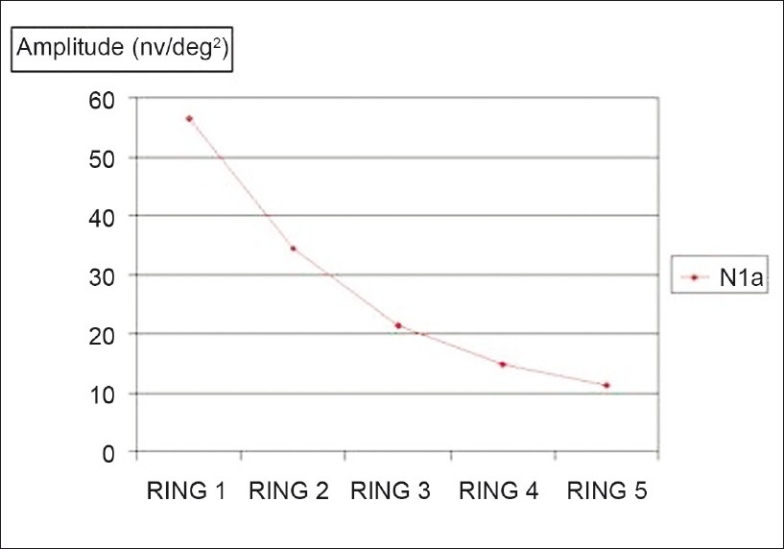
Comparison between fovea and the outer portions: Mean of the N1 amplitudes in the five rings; P < 0.0001
Figure 7.
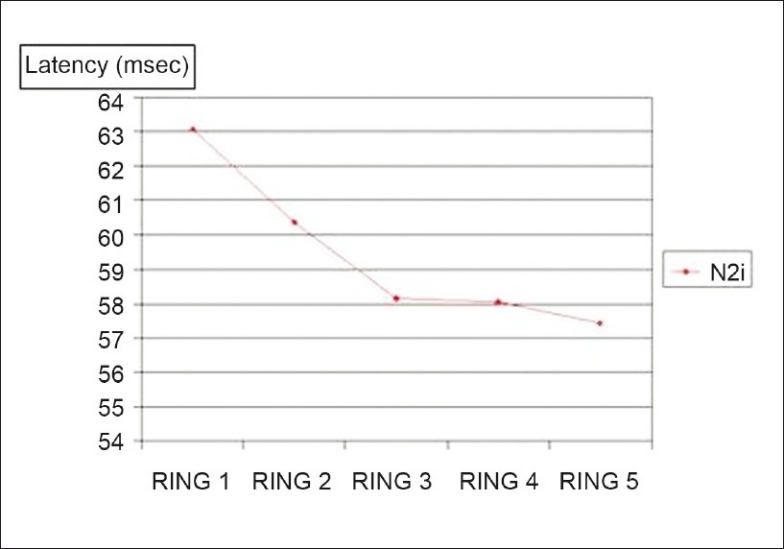
Comparison between fovea and the outer portions: Mean of the N2 latencies in the five rings; P < 0.0001
Table 2.
Correlation of the CMT with the R1 mfERG parameters in emmetropia
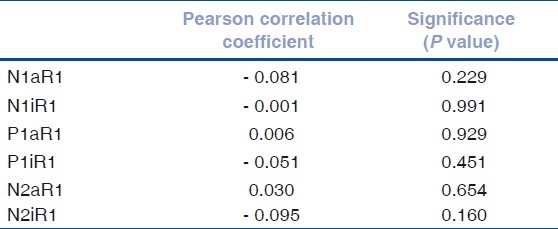
Figure 3.
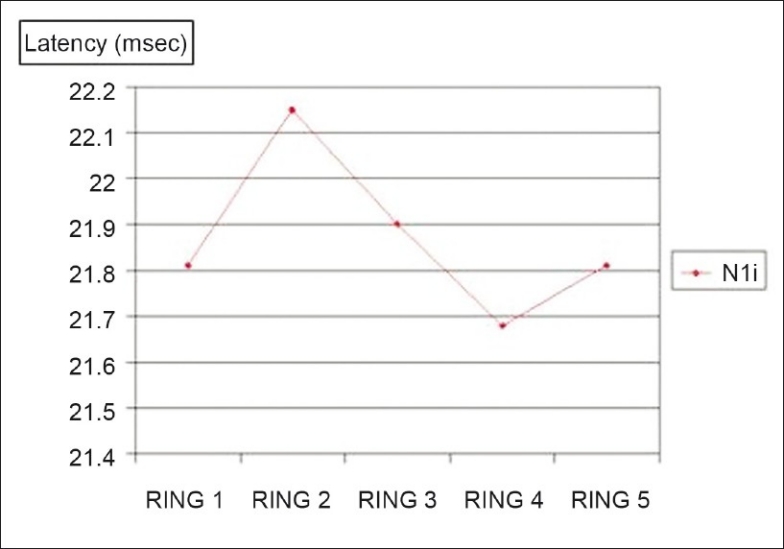
Comparison between fovea and the outer portions: Mean of the N1 latencies in the five rings; P = 0.199
Figure 4.
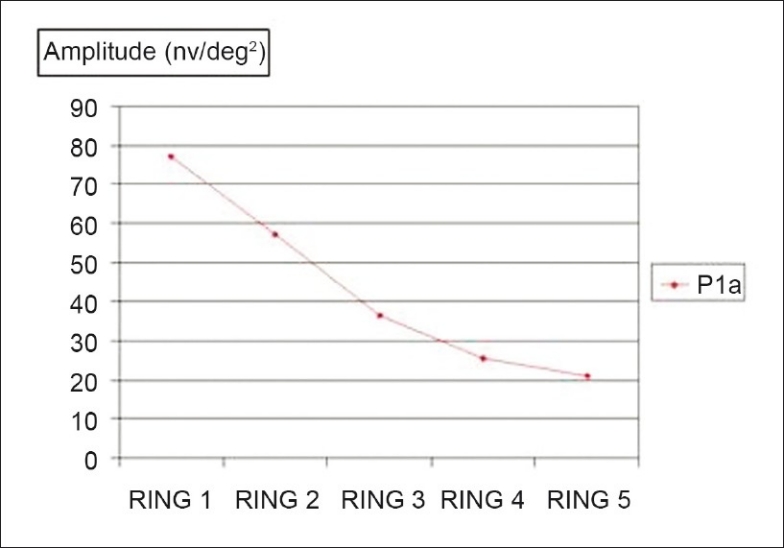
Comparison between fovea and the outer portions: Mean of the P1 amplitudes in the five rings; P < 0.0001
Figure 5.
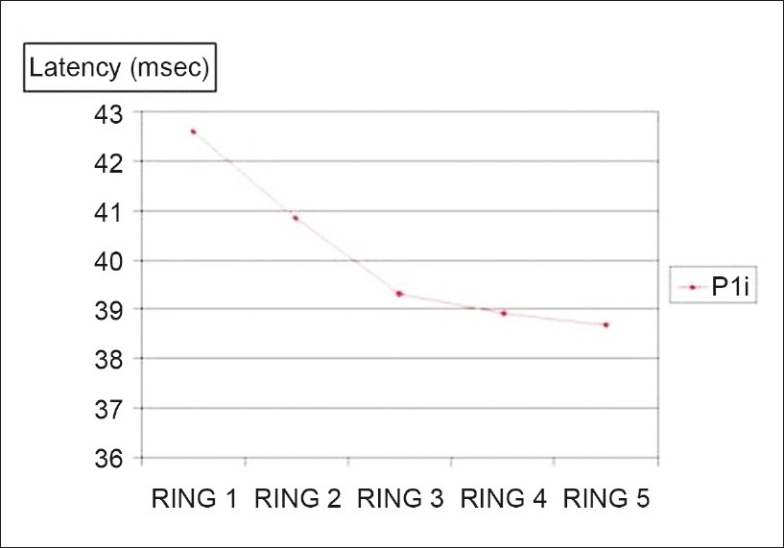
Comparison between fovea and the outer portions: Mean of the P1 latencies in the five rings; P < 0.0001
Figure 6.
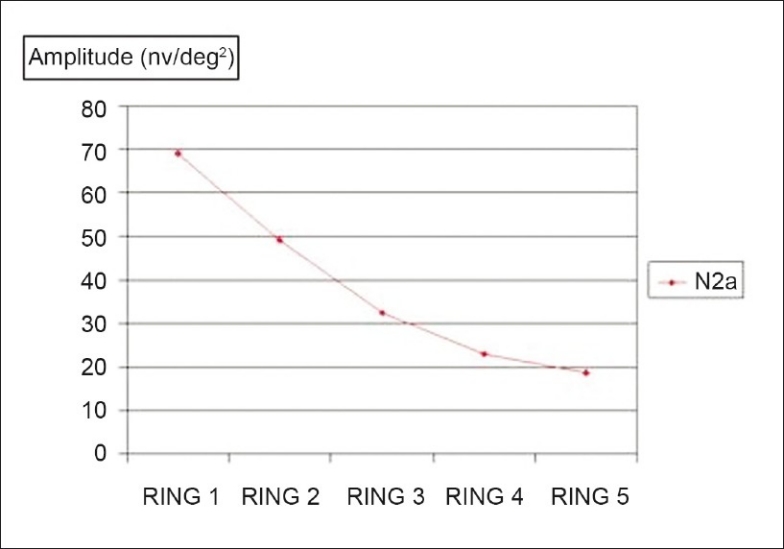
Comparison between fovea and the outer portions: Mean of the N2 amplitudes in the five rings; P < 0.0001
Discussion
Following the initial description of mfERG technique by Sutter and Tran in 1992, several applications in diverse retinal disorders have appeared in the literature.[1] The mfERG responses have been studied in various pathological states including age-related macular degeneration, diabetic retinopathy, macular hole, retinal vascular occlusions, retinal drug toxicity, hereditary and congenital retinal disorders, such as Stargardt's macular dystrophy and retinitis pigmentosa, and various acquired retinopathies such as multifocal choroiditis, Vogt Koyanagi Harada syndrome, and multiple evanescent white dot syndrome.[3] A recent Pubmed search reveals 252 references to the mfERG technique in human-based research. However, available normative data for mfERG is not conclusive.
In a pilot study by Lakshmi et al.,[4] mfERGs were recorded from 20 normal subjects with mean age of 35.05 years (range 18–60 years). Subjects with refractive error more than either +3.00 spheric diopters or -5.00 D spheric diopters were excluded. In the ring analysis, the mean amplitudes in microvolts of the N1 (-37.15 ± 17.51), P1 (86.56 ± 15.71), and N2 (-74.29 ±17.01) were largest in foveal area and decreased with eccentricity.
The difficulty in comparing these values with those obtained in our study is that the amplitudes are expressed in microvolts, whereas we have used a display of scaled hexagons and expressed amplitude in nV/deg2.
Nagatomo et al.,[5] recorded multifocal ERGs from 20 eyes of 20 normal subjects and analyzed the topographical properties of the responses. This study represents the only attempt to establish normative values in a homogenous population (Japanese) available in published literature. The sample size of these two studies (N = 20) make it difficult to derive any conclusions applicable to a larger population. With a sample size of 222 eyes, our study is the largest such database in a single homogenous population (Indian).
In our study, the amplitudes of the N1, P1, and N2 waves also were largest in the fovea (ring 1) and decreased progressively with increasing eccentricity. This observation may be explained anatomically by the cone density distribution, as demonstrated by Curcio et al. from cadaveric retinas.[6] Similar results were also obtained by Sutter et al.[1] and Nagatomo et al.[5]
The latencies of the P1 and N2 waves were longest in the central ring and progressively shortened with eccentricity. A similar finding was however not obtained in the latencies of the N1 wave. In contrast, Nagatomo et al.[5] and Miyake et al.[7] reported that the latencies of the N1 and P1 waves tended to be long in the fovea, become shorter in the parafovea, and then again longer in the periphery.
The OCT permits direct morphometric assessment of the retina. Thus, it would be interesting to determine the correlation between functional parameters obtained with mfERG and structural assessment using OCT.
No statistically significant correlations were observed between central ring 1 parameters and CMT in the present study. The subjects included in the current study were emmetropes with ophthalmoscopically normal fundii. In addition, the variability in CMT among subject (SD = 18.12 μ) was not reflected in the mfERG response.
In a recent study, Wolsley et al.[8] investigated relationships between retinal structure using OCT and retinal function using peripheral resolution acuity and mfERG in 56 subjects with a range of refractive errors (+0.50 D to -15.00 D). Middle to inner retina (MIR) thickness (outer plexiform layer to the nerve fiber layer) correlated with reduced spatial resolution and delayed mfERG timing in the peripheral retina. The findings suggested that the structure and function of the post-receptor retina are susceptible to disruption in moderately and highly myopic eyes.
Conclusion
The present study represents the largest database of mfERG wave parameters in a normal emmetropic population. The topographic responses may, therefore, serve as a normative database when evaluating patients with retinal pathology. Our study however does not consider the effect of age as a factor influencing mfERG parameters. Statistically significant reduction in N1, P1, and N2 amplitude and P1 and N2 latencies was observed with increasing eccentricity. No statistically significant correlations were observed between central ring 1 parameters and CMT in the present study.
Footnotes
Source of Support: Nil.
Conflict of Interest: None declared.
References
- 1.Sutter EE, Tran D. The field topography of ERG components in man-I: The photopic luminance response. Vision Res. 1992;32:433–46. doi: 10.1016/0042-6989(92)90235-b. [DOI] [PubMed] [Google Scholar]
- 2.Marmor MF, Hood DC, Keating D, Kondo M, Seeliger MW, Miyake Y, et al. Guidelines for basic multifocal electroretinography (mfERG) Doc Ophthalmol. 2003;106:105–15. doi: 10.1023/a:1022591317907. [DOI] [PubMed] [Google Scholar]
- 3.Lai TY, Chan WM, Lai RY, Ngai JW, Li H, Lam DS. The clinical applications of multifocal electroretinography: A systematic review. Surv Ophthalmol. 2007;52:61–96. doi: 10.1016/j.survophthal.2006.10.005. [DOI] [PubMed] [Google Scholar]
- 4.Lakshmi S, Harikrishna V, Hussain N, Varma BR, Nutheti R, Jalali S. Pilot study on normative data map using multifocal electroretinography in Indian population. Presented at XLV ISCEV International Symposium [Google Scholar]
- 5.Nagatomo A, Nao-i N, Maruiwa F, Arai M, Sawada A. Multifocal electroretinograms in normal subjects. Jpn J Ophthalmol. 1998;42:129–35. doi: 10.1016/s0021-5155(97)00118-4. [DOI] [PubMed] [Google Scholar]
- 6.Curcio CA, Sloan KR, Jr, Packer O, Hendrickson AE, Kalina RE. Distribution of cones in human and monkey retina: Individual variability and radial asymmetry. Science. 1987;236:579–82. doi: 10.1126/science.3576186. [DOI] [PubMed] [Google Scholar]
- 7.Miyake Y. Studies of local macular ERG. Nippon Ganka Gakkai Zasshi. 1988;92:1419–49. [PubMed] [Google Scholar]
- 8.Wolsley CJ, Saunders KJ, Silvestri G, Anderson RS. Investigation of changes in the myopic retina using multifocal electroretinograms, optical coherence tomography and peripheral resolution acuity. Vision Res. 2008;48:1554–61. doi: 10.1016/j.visres.2008.04.013. [DOI] [PubMed] [Google Scholar]


