Abstract
This paper introduces a method whereby TE-averaged PRESS spectroscopy was used in conjunction with regularized lineshape deconvolution to measure N-acetyl-aspartyl-glutamate (NAAG). Averaging different echo times suppressed the signals of multiplets from strongly coupled spin systems near 2 ppm, thus minimizing the interfering signals for detecting the acetyl proton signal of NAAG. Signal distortion was corrected by lineshape deconvolution, and Tikhonov regularization was introduced to reduce noise amplification arising from deconvolution; as a result, spectral resolution was enhanced without significantly sacrificing signal-to-noise ratio (SNR). This new approach was used to measure NAAG in the two regions of interest of healthy volunteers, dominated by gray matter and white matter respectively. The acetyl proton signal of NAAG was directly quantified by fitting the deconvoluted spectra to a Voigt-lineshape spectral model function, yielding the NAAG-NAA ratios of 0.11 ± 0.02 for the gray matter voxels (n = 8) and 0.18 ± 0.02 for the white matter voxels (n = 12).
Keywords: N-acetyl-aspartate (NAA), N-acetyl-aspartyl-glutamate (NAAG), short echo time PRESS, TE-averaged PRESS, deconvolution, regularization
INTRODUCTION
The peptide neurotransmitter N-acetyl-aspartyl-glutamate (NAAG) plays a key role in glutamatergic signaling (1), most notably by antagonizing the effects of glutamate at N-methyl-D-aspartate (NMDA) receptors and regulating gamma aminobutyric acid (GABA) receptor expression. Post-mortem studies suggest that NAAG levels are increased in the brain of individuals with schizophrenia (2) and reduced in individuals with amyotrophic lateral sclerosis (ALS) (3).
Measuring NAAG in the human brain by 1H magnetic resonance spectroscopy (1H MRS) is challenging because of its low concentration and overlap with other signals. Short echo time PRESS spectroscopy is currently the most popular method for measuring NAAG levels in vivo (4). NAAG concentrations are largely determined by the acetyl proton signal at 2.04 ppm, which is the most prominent NAAG signal in 1H MRS measured by short echo time. However, this signal is separated by only ~ 0.04 ppm from the corresponding signal of N-acetyl aspartate (NAA) (5). Thus, in most clinical studies, it is difficult to differentiate the two signals. This method is further hampered by the contamination signals near 2.04 ppm that arise from molecules such as glutamate and the macromolecule MM20 (6)
A spectral editing method (7) was recently proposed to differentiate NAAG from NAA at 3 and 7 Tesla (T) (8, 9). This method applies the editing pulse on the aspartyl α-protons of NAAG and uses an echo time of 140 ms to invert the β-protons of NAAG at approximately 2.6 ppm. The β-proton signal of NAA is removed out by alternating the editing pulse on and off, then sorting out the corresponding NAAG signal. Because the β-proton signal is much weaker than the acetyl proton signal and a long echo time of 140 ms is required, this method is limited by low signal-to-noise ratio (SNR).
Insufficient spectral resolution is often associated with lineshape distortions due to both static magnetic field (B0) inhomogeneity and eddy currents (10). Although a model function can be used to fit a non-analytical lineshape and incorporated into the parametric analysis (11), lineshape correction methods, such as QUALITY (12), are more common. QUALITY deconvolves spectral data into Lorentzian-type lineshapes by using water references. Due to its shorter T2, the water reference signal drops out earlier than the signals of interest; thus, the portion of the spectral data near the end of the time domain may be rendered unusable by the noise explosion. In particular, the zero-division would occur at time points where the reference signal has zero amplitude. Although a strong decay filter can be applied after deconvolution to suppress the noise, it broadens the spectral linewidth and thus compromises the benefits of deconvolution. Some additional processing (e.g., interpolation) may be required to remove the strong spikes (13).
To overcome the issue of noise spikes induced by the zero-division, the QUECC (14) method suggested a cross-over point that separates the time domain signal into two parts. The first part of the signal was corrected using QUALITY deconvolution; for the second part of the data, only eddy current correction was performed. Practically, however, the method lacks criteria for determining the cross-over point.
TE-averaged PRESS was found to offer a way detecting the C4 signal of glutamate at 2.35 ppm (15, 16). It simplified the spectrum by effectively canceling magnetization from the outer wings of the multiplets, leaving only the signals coincident in frequency with the chemical shift. This study attempted to quantitatively detect NAAG by combining TE-averaged PRESS with lineshape deconvolution. It was expected that the strongly-coupled multiple resonance lines near 2.0 ppm, including the signals of macromolecules in the vicinity, were suppressed with echo time averaging, while the singlet peaks of NAA and NAAG acetyl proton signals remained unaffected. For the lineshape deconvolution, Tikhonov regularization was introduced to restrain the noise amplification due to the deconvolution. The deconvoluted data were further denoised by line-broadening window functions, optimally determined by Cramer-Rao Lower Bound (CRLB), and then fitted with a simple model function to quantify NAAG.
METHODS
Data Acquisition and Processing
In vivo data were acquired from 14 healthy volunteers (3 males and 11 females, aged from 19 to 33). They were recruited as part of the National Institute of Mental Health (NIMH) Genetic Study of Schizophrenia (NCT00001486) (17). Written informed consent was obtained from all participants, and the study was approved by the Institutional Review Board (IRB) of the NIMH.
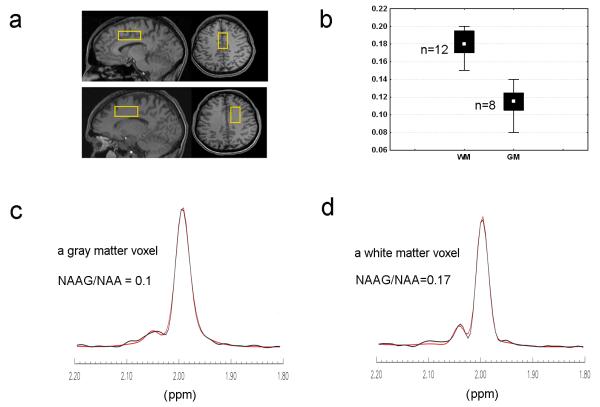
All experimental data were collected on GE 3 T Excite scanners (GE Medical Systems, Waukesha, WI) using a quadrature head coil. T1-weighted structural images were acquired to localize and position spectroscopic voxels using a three-dimensional spoiled gradient recalled (SPGR) pulse sequence (TR = 24 ms, TE = 3.2 ms, flip angle = 17 degrees, in-plane resolution = 0.9 mm2). Spectral data were collected from two voxels dominated by gray matter and white matter, respectively, each measuring 2.0 × 2.0 × 4.5 cm3. Gray matter voxels were placed in the anterior cingulate (Fig. 5a). White matter voxels were in the right frontal white matter, directly adjacent to the rostral anterior cingulate cortex. Care was taken to place the voxel directly superior to the ventricles in order to minimize the amount of cerebrospinal fluid (CSF) included.
Fig. 5.
(a) Positioning of the gray matter voxel and the white matter voxel. (b) Distributions of the levels of NAAG/NAA for the gray matter voxels (n = 8) and the white matter voxels (n = 12). The white spots in the boxes represent the median values. Two Voigt-type peaks (red line) were fitted to the experimental spectra from 1.8-2.2 ppm (black line), yielding NAAG /NAA = 0.10 for a gray matter voxel (c) and NAAG /NAA = 0.17 for white matter voxel (d).
A sphere phantom was made to investigate CRLB in the measurement of NAAG/NAA as a function of exponential line-broadening factors. It contained 20 mM NAA and 4 mM NAAG in a phosphate buffer (pH = 7.01).
The manufacturer’s PRESS sequence was modified to allow sampling of both single echo time spectroscopy and TE-averaged spectroscopy. The sequence used Shinnar-Le Roux (SLR) RF pulses with bandwidth and duration of 2400 Hz, 3.6 ms for the excitation pulse, and nominally 1400 Hz, 5.2 ms for the refocusing pulses. The refocusing pulses were automatically stretched by GE software (with a duration of 5.2 - 5.7 ms for this study) once the body weight of the subject exceeds a certain threshold. For single echo time spectroscopy, a short echo time was used (TE = 30 ms) with an average number (NA) of 32. TE-averaged spectra were acquired with 32 different echo times (NA = 4 for each echo time). TE was started at 35 ms (8.5 ms from the excitation pulse to the first refocusing pulse; 17.5 ms from the first refocusing pulse to the second refocusing pulse), and increased by 6 ms for each of the 31 following echoes. Reference unsuppressed water scans were collected immediately after spectral data acquisition (NA = 16). All spectra were sampled with a bandwidth of 5 kHz and 4096 data points. Raw data were saved and processed offline with programs developed in-house.
Spectral Simulation
Short echo time PRESS and TE-averaged PRESS were numerically simulated with spin density computation. The program was written in-house using interactive data language (IDL; Research Systems, Inc., Boulder, CO). Coupling constants were used as previously described (5). The simulation followed the same timeline as the pulse sequence described above, but the selective 90° excitation pulse and the two selective 180° refocusing pulses were replaced with the corresponding hard pulses.
Lineshape Deconvolution and Regularization
Let Y be the observed signal with lineshape distortions to be deconvoluted into X, which decays exponentially, i.e.,
| (1) |
where A(ti) is the lineshape function described by the reference data, and ti is the time at the ith data point. Because phase correction can be performed in a separate processing step, A(ti) here contains only the amplitude part of the reference data; therefore A(ti) > 0. The conventional solution (12) to X(ti) is :
| (2) |
where A−1(ti) is the inverse of A(ti). As long as the observed signal peak has the same lineshape as the reference, it will have Lorentzian-type lineshape after the deconvolution outlined in Eq. 2. However, both A(ti) and Y(ti) contain noise errors that propagate into X(ti) by Eq. 2. These noise errors will be significantly amplified at the time points where A(ti) nears singular. Eq. 2 may thus not be a desired solution, as the resultant spectrum bears much more noise after deconvolution processing than before it. One of the solutions needed to solve the problem of noise amplification in Eq. 2 is equivalent to minimizing the residual of the norm∥ AX − Y ∥2 . According to Tikhonov regularization (18), the norm should be replaced with:
| (3) |
where Γ is the Tikhonov matrix. We let Γ = (λA)1/ 2 ; λ is a positive regularization parameter to be determined later. Eq. 3 then has the solution:
| (4) |
Obviously, a non-zero λ eliminates the zero-division and restrains the noise amplification resulting from small A(ti) values. However, a minimal λ is preferable because the regularization results in incomplete lineshape correction and makes the lineshape deviate from the Lorentzian-type. When λ = 0, Eq. 4 becomes the lineshape deconvolution without regularization. The optimal regularization parameter is determined in an ad hoc manner, depending on the a priori information and the decision criteria used. We used the so-called L-curve to determine the optimal λ (19). Here, the L-curve is defined as the plot of the noise squared norm of the regularized solution versus the residual norm for each of the regularization parameter values. The residual norm was calculated by differencing the water peaks in frequency domain between with and without the regularization. The best regularization parameter is on the corner of the L-curve.
Spectral Fitting
Spectral fitting was carried out in the frequency domain from 1.8 to 2.2 ppm, using Levenberg-Marquardt non-linear algorithm (20, 21). The model function consisted of two Voigt-type (22) peaks with identical T*2 and was denoted by S:
| (5) |
The subscript j represents NAA (j=1) and NAAG (j=2); tn stands for the digitized time point. The parameters c, α, β, ω, and φ, are signal amplitude, Lorentzian decay factor, Gaussian decay factor, frequency, and phase, respectively. The fitting program, developed using IDL, used the graphic user interface (GUI) to initialize the fitting parameters. Therefore, the fitting could be started with different initial parameters in order to search for the best fit with a minimal CRLB. CRLB matrix is defined by:
| (6) |
F is the Fisher information matrix (23-25), and its rs element can be expressed as:
| (7) |
where σ is the root mean square deviation of noise of the experimental data, and denotes the real part of a matrix product. The matrix Dnr is the derivative of S (Eq. 5) with respect to the parameter r at the time tn. D was numerically calculated in the time domain and used the fitted parameters; σ was computed in the frequency domain.
RESULTS
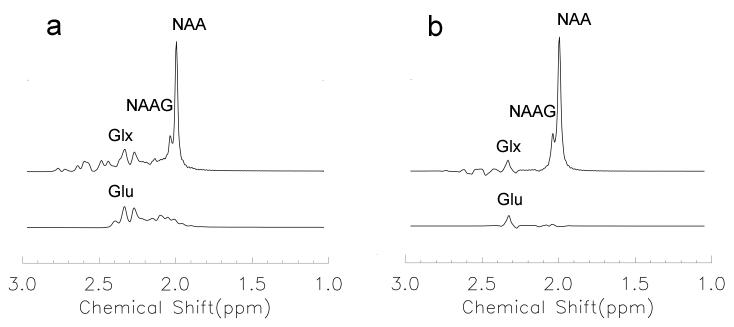
Figure 1 shows the simulated short echo time spectrum and TE-averaged spectrum. In the short echo time spectrum (Fig. 1a), the glutamate C3 signal (concentration ratio: Glutamate/NAA = 0.70) overlapped with the NAAG acetyl signal (concentration ratio: NAAG/NAA = 0.18). The glutamine C3 signal also appeared near 2.04 ppm, but its influence was smaller than that of glutamate C3 because of its lower concentration. In contrast to short echo time spectroscopy, with TE-averaged spectroscopy (Fig. 1b) the glutamate C3 signal was significantly reduced near 2.04 ppm. This suppression effect also applies to macromolecules, because of their strong coupling between different protons. Strongly coupled spins experience phase modulation and T2 relaxation during the echo time. Changes in echo time lead to different patterns of resonance peaks; macromolecule signals are subsequently substantially reduced after the average.
Fig. 1.
Simulated short echo time PRESS (a) and TE-averaged PRESS (b). The C3 glutamate signal overlapped with the acetyl proton signal of NAAG in the short echo time spectrum and was remarkably reduced in the TE-averaged spectrum.
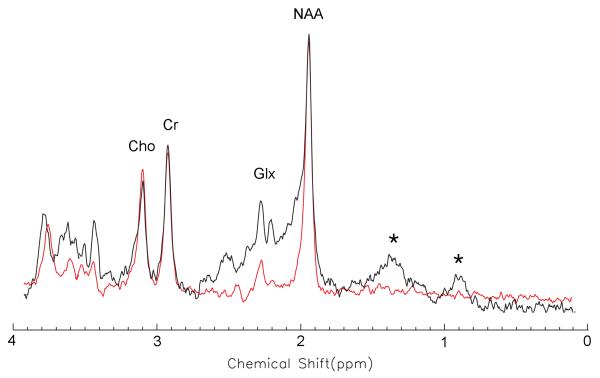
Figure 2 shows that the in vivo macromolecule signals in a white matter voxel — the peaks marked by the star symbols in the short echo time spectrum (black line) —were almost invisible in a TE-averaged spectrum (red line) acquired from the same voxel as the short echo time spectrum.
Fig. 2.
Comparison between a 30 ms short echo time spectrum (black line) and a TE-averaged spectrum (red line). Both spectra were acquired from a white matter voxel. The peaks, marked by star symbols in the short echo time spectrum, were signals from the large molecules. These disappeared in the TE-averaged spectrum.
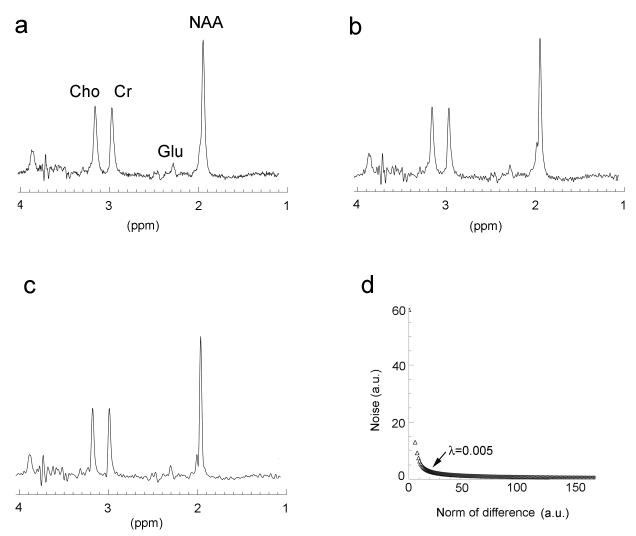
An in vivo TE-averaged spectrum was displayed without lineshape correction (Fig. 3a) and then corrected using conventional lineshape deconvolution (Fig. 3b). A 6.9 Hz strong exponential broadening factor was needed to keep SNR at pre-deconvolution levels; consequently, the improvement of resolution was compromised. By contrast, the regularized deconvolution (λ = 0.005) was applied after 4.9 Hz exponential line-broadening (Fig. 3c). The enhanced resolution is noticeable when Fig. 3c is compared with Fig. 3b; SNR remained at about the same level. The L-curve in Fig. 3d was plotted as the function of noise versus the norm of the difference between with and without the regularization. The difference was calculated using the residual water peak in frequency domain. The optimal λ (0.005) was located at the corner of the curve. Noise of the deconvoluted data increased significantly when the regularization λ approached zero from the corner.
Fig. 3.
Spectral comparisons of a white matter voxel with different processing (a) without lineshape deconvolution; (b) deconvolution without regularization; and (c) regularized deconvolution. The line broadenings of 4.9 Hz and 6.9 Hz were applied to the data with the regularization and the data without the regularization, respectively. (d) L-curve shows a λ of 0.005 at the corner, which was used for the regularization.
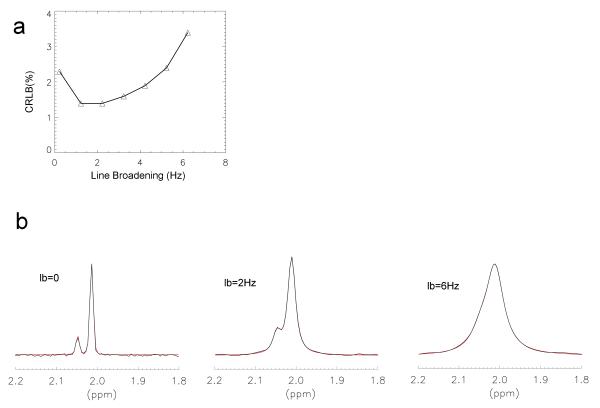
CRLB changes with different exponential line-broadening factors. In the phantom study (Fig. 4a), a region of minimal CRLB was found at the line-broadening factor of 1.6 Hz, which gave a linewidth of 2.8 Hz (measured by the acetyl peak of NAA). The acetyl peak of NAAG was separated from the acetyl peak of NAA by 4.5Hz. Both had a linewidth of 1.2 Hz prior to line-broadening. Three differently line broadened spectra (0, 2 Hz, and 6 Hz) as well as the fitted spectra are displayed in Fig. 4b.
Fig. 4.
(a) Changes in CRLB versus line-broadening factors were demonstrated using data acquired from a phantom that contained 20 mM NAA and 4 mM NAAG in a phosphate buffer (pH = 7.01). A region of line-broadening at ~ 2Hz was found where CRLB was minimal. (b) The model function (two Voigt-type peaks) was fitted to three differently line-broadened spectra: 0, 2, and 6 Hz, respectively.
In vivo TE-averaged PRESS spectra were acquired on the two regions shown in Fig. 5a, which were dominated by gray matter and white matter, respectively. The resulting NAAG/NAA levels (Fig. 5b) were 0.11 ± 0.02 for the gray matter voxels (n = 8) and 0.18 ± 0.02 for the white matter voxels (n = 12). For quantification of NAAG, the sub-spectra of the acetyl proton signals of NAA and NAAG from 1.8 to 2.2 ppm were fitted to the model function comprising two Voigt type peaks, as described in the Methods. Figure 5c and 5d show the fitting results with data collected from a gray matter voxel and a white matter voxel.
DISCUSSION
Poor spectral resolution and the interference of overlapping signals, including the interfering macromolecule signals, are major hurdles for quantifying in vivo metabolites, particularly weakly represented metabolites such as NAAG. This study used TE-averaged spectroscopy and the post-processing of lineshape deconvolution to deal with these problematic factors in order to quantitatively detect NAAG. We demonstrated that macromolecule signals and metabolite multiplets at ~ 2 ppm were effectively suppressed by using TE-averaged spectroscopy, and that spectral resolution was enhanced by regularized lineshape deconvolution without significantly sacrificing SNR.
Apparently, regularization reduced the noise introduced by the lineshape deconvolution. The additionally required line-broadening factor was thus lower than in the case no regularization was used. The regularization parameter provides a term to balance the trade-off between noise and loyalty to Lorentzian lineshape. However, noise needs to be further suppressed with a line-broadening window function. An optimal broadening factor should lead to a good balance between noise levels and spectral resolution for the purpose of quantitative spectral analysis. Because quantitative results vary with degree of line-broadening (26), a rational approach is necessary to establishing the appropriate tradeoff between noise level and line-broadening. Here, we used CRLB as a criterion to establish the optimal line-broadening factor.
CRLB is a measure of the uncertainty of estimates. Previous studies demonstrated that the lower bound of the uncertainty increased with large spectral linewidth and overlapping (23, 24). Because overlap is also a function of linewidth and increases with large linewidth, a narrowed linewidth would lower estimation errors. However, if the resolution was enhanced at the cost of SNR, CRLB might be increased rather than decreased because CRLB is also proportional to the root of mean square of noise according to Eq 7. An optimal line-broadening factor must correspond to a minimal CRLB as shown in Fig 4. As expected, CRLB increased significantly when the linewidth was broadened so much that NAAG could not be visibly distinguished.
For detecting the acetyl proton signals of NAAG with short echo time spectroscopy, interference comes from the signals of glutamate and macromolecule MM20. In particular, because both NAAG and MM20 are dominated by their signals at about 2.04 ppm, there was a strong interaction between NAAG and MM20 parameters, even when spectral fitting was performed over the entire region of the spectrum. As with the macromolecule signals in Fig. 2, MM20 signals at ~2 ppm would also be expected to be substantially suppressed with TE-averaged spectroscopy. Thus, it appears that NAAG quantification can be performed in the frequency domain by fitting a simple model to a spectral region near 2.04 ppm after lineshape correction using deconvolution. Theoretically, as long as the signal is strong enough and the removal of contaminating signals and the correction of lineshape distortions are adequate, NAAG/NAA levels can be accurately and precisely determined, even though the signal of NAAG is not clearly differentiated from that of NAA. Prior studies have shown that NAAG concentrations determined by short echo time spectroscopy or editing spectroscopy ranged from 1.5-2.7 mM for white matter and 0.6-1.5 mM for gray matter (4, 8, 9, 27). These correspond to NAAG/NAA ratios of 0.16-0.28 and 0.04-0.10, respectively, when NAA concentrations are 9.5 mM and 14.3 mM for white matter and gray matter (28). In this study, NAAG/NAA levels of the gray matter region and the white matter region were 0.11 ± 0.02 and 0.18 ± 0.02 respectively, as determined by TE-averaged PRESS spectroscopy, and thus, correspondingly, in the upper range and lower range of previously described results.
The effective echo time of the TE-averaged spectrum is much longer than that of a typical short echo time spectrum, and has lower SNR than the latter. The reported relaxation time T2 of NAA is greater than 200 ms for gray matter, and 300 ms for white matter (15, 29). If we assume that a TE-averaged PRESS spectrum uses 32 echoes with an echo spacing of 6 ms, the effective echo time would be ~ 110 ms and thus lose about 35% of its signal compared with a short echo time PRESS spectrum (30 ms).
It is also important to note that TE-averaged spectroscopy combined with regularized lineshape deconvolution can be directly applied to clinical studies. The drawback of TE-averaged spectroscopy is the influence of eddy currents. These vary with the echo time (30) and, as a result, the eddy current correction needs to be performed individually when its effects are significant. The acetyl proton resonance signals of both NAA and NAAG are singlet peaks; hence, the influence of eddy currents is expected to be less significant than that for measuring glutamate by using TE-averaged PRESS, because eddy currents equally influence the lineshapes of NAA and NAAG if the correction is inadequate. This study only corrected the frequency shifts induced by eddy currents (30). The suppression of the interference signals—i.e., macromolecule and other relevant metabolite signals—is little affected by the eddy currents. The current study used the echoes described in Ref. 15 and 16, which were designed to measure glutamate. The possibility exists that echo number and spacing could be further optimized to suppress interference signals around 2.04 ppm.
CONCLUSIONS
We demonstrated that the quantitative detection of NAAG is feasible and practical at 3T by using TE-averaged PRESS spectroscopy and regularized lineshape deconvolution. The influence of glutamate and of macromolecules on the acetyl proton signals of NAAG at 2.04 ppm were minimized by averaging different echo time spectrocopy. Lineshape correction and resolution enhancement were achieved by using regularized deconvolution without significantly sacrificing SNR. NAAG-to-NAA levels in the gray matter region of anterior cingulate and in the white matter region of the frontal lobe were estimated to be 0.11 ± 0.02 and 0.18 ± 0.02 respectively, in line with previous measurements with other techniques.
ACKNOWLEDGEMENTS
The authors are grateful to Ms. Ioline Henter (NIMH) for her excellent editorial assistance.
REFERENCES
- 1.Blakely RD, Coyle JT. The neurobiology of Nacetylaspartylglutamate. Int Rev Neurobiol. 1988;30:39–100. [PubMed] [Google Scholar]
- 2.Tsai G, Passani LA, Slusher BS, Carter R, Baer L, Kleinman JE, Coyle JT. Abnormal excitatory neurotransmitter metabolism in schizophrenic brains. Arch Gen Psychiatry. 1995;52:829–836. doi: 10.1001/archpsyc.1995.03950220039008. [DOI] [PubMed] [Google Scholar]
- 3.Tsai G, Stauch-Slusher B, Sim L, Hedreen JC, Rothstein JD, Kuncl R, Coyle JT. Reductions in acidic amino acids and N-acetylaspartylglutamate in amyotrophic lateral sclerosis CNS. Brain Res. 1991;556:151–156. doi: 10.1016/0006-8993(91)90560-i. [DOI] [PubMed] [Google Scholar]
- 4.Pouwels PJ, Frahm J. Differential distribution of NAA and NAAG in human brain as determined by quantitative localized Proton MRS. NMR Biomed. 1997;10:73–78. doi: 10.1002/(sici)1099-1492(199704)10:2<73::aid-nbm448>3.0.co;2-4. [DOI] [PubMed] [Google Scholar]
- 5.Govindaraju V, Young K, Maudsley AA. Proton NMR chemical shifts and coupling constants for brain metabolites. NMR Biomed. 2000;13:129–153. doi: 10.1002/1099-1492(200005)13:3<129::aid-nbm619>3.0.co;2-v. [DOI] [PubMed] [Google Scholar]
- 6.Wilson M, Reynolds G, Kauppinen RA, Arvanitis TN, Peet AC. A constrained least-squares approach to the automated quantitation of in vivo 1H magnetic resonance spectroscopy data. Magn Reson Med. 2011;65:1–12. doi: 10.1002/mrm.22579. [DOI] [PubMed] [Google Scholar]
- 7.Mescher M, Merkle H, Kirsch J, Garwood M, Gruetter R. Simultaneous in vivo spectral editing and water suppression. NMR Biomed. 1998;11:266–272. doi: 10.1002/(sici)1099-1492(199810)11:6<266::aid-nbm530>3.0.co;2-j. [DOI] [PubMed] [Google Scholar]
- 8.Edden RA, Pomper MG, Barker PB. In vivo differentiation of N-acetyl aspartyl glutamate from N-acetyl aspartate at 3 Tesla. Magn Reson Med. 2007;57:977–982. doi: 10.1002/mrm.21234. [DOI] [PubMed] [Google Scholar]
- 9.Choi C, Ghose S, Uh J, Patel A, Dimitrov IE, Lu H, Douglas D, Ganji S. Measurement of N-acetylaspartylglutamate in the human frontal brain by 1H-MRS at 7 T. Magn Reson Med. 2010;64:1247–1251. doi: 10.1002/mrm.22536. [DOI] [PMC free article] [PubMed] [Google Scholar]
- 10.Klose U. In vivo proton spectroscopy in presence of eddy currents. Magn Reson Med. 1990;14:26–30. doi: 10.1002/mrm.1910140104. [DOI] [PubMed] [Google Scholar]
- 11.Provencher SW. Estimation of metabolite concentrations from localized in vivo proton NMR spectra. Magn Reson Med. 1993;30:672–679. doi: 10.1002/mrm.1910300604. [DOI] [PubMed] [Google Scholar]
- 12.de Graaf AA, van Dijk JE, Bovee WM. QUALITY: quantification improvement by converting lineshapes to the Lorentzian type. Magn. Reson. Med. 1990;13:343–357. doi: 10.1002/mrm.1910130302. [DOI] [PubMed] [Google Scholar]
- 13.Metz KR, Lam MM, Webb AG. Reference deconvolution:a simple and effective method for resolution enhancement in nuclear magnetic resonance spectroscopy. Concepts Magn Reson. 2000;12:21–42. [Google Scholar]
- 14.Bartha R, Drost DJ, Menon RS, Williamson PC. Spectroscopic lineshape correction by QUECC: combined QUALITY deconvolution and eddy current correction. Magn Reson Med. 2000;44:641–645. doi: 10.1002/1522-2594(200010)44:4<641::aid-mrm19>3.0.co;2-g. [DOI] [PubMed] [Google Scholar]
- 15.Hurd R, Sailasuta N, Srinivasan R, Vigneron DB, Pelletier D, Nelson SJ. Measurement of brain glutamate using TE-averaged PRESS at 3T. Magn Reson Med. 2004;51:435–440. doi: 10.1002/mrm.20007. [DOI] [PubMed] [Google Scholar]
- 16.Hancu I, Zimmerman EA, Sailasuta N, Hurd RE. 1H MR spectroscopy using TE averaged PRESS: a more sensitive technique to detect neuron-degeneration associated with Alzheimer’s disease. Magn Reson Med. 2005;53:777–782. doi: 10.1002/mrm.20419. [DOI] [PubMed] [Google Scholar]
- 17.Egan MF, Goldberg TE, Gscheidle T, Weirich M, Bigelow LB, Weinberger DR. Relative risk of attention deficits in siblings of patients with schizophrenia. Am J Psychiatry. 2000;157:1309–1316. doi: 10.1176/appi.ajp.157.8.1309. [DOI] [PubMed] [Google Scholar]
- 18.Tikhonov AN. Solution of incorrectly formulated problems and the regularization method. Soviet Math Dokl. 1963;4:1035–1038. [Google Scholar]
- 19.Hansen PC. Analysis of discrete ill-posed problems by means of the L-curve. SIAM Rev. 1992;34:561–580. [Google Scholar]
- 20.Press WH, Teukolsky SA, Vetterling WT, Flannery BP. Numerical Recipes in C. Cambridge University Press; Cambridge: 1992. [Google Scholar]
- 21.Marquardt DW. An algorithm for least-squares estimations of non-linear parameters. J Soc Ind Appl Math. 1963;11:431–441. [Google Scholar]
- 22.Bruce SD, Higinbotham J, Marshall I, Beswick PH. An analytical derivation of a popular approximation of the Voigt function for quantification of NMR spectra. J Magn Reson. 2000;142:57–63. doi: 10.1006/jmre.1999.1911. [DOI] [PubMed] [Google Scholar]
- 23.Cavassila S, Deval S, Huegen C, van Ormondt D, Graveron-Demilly D. Cramer-Rao bound expressions for parametric estimation of overlapping peaks: influence of prior knowledge. J Magn Reson. 2000;143:311–320. doi: 10.1006/jmre.1999.2002. [DOI] [PubMed] [Google Scholar]
- 24.Cavassila S, Deval S, Huegen C, van Ormondt D, Graveron-Demilly D. Cramer-Rao bounds: an evaluation tool for quantitation. NMR Biomed. 2001;14:278–283. doi: 10.1002/nbm.701. [DOI] [PubMed] [Google Scholar]
- 25.Provencher SW, Vogel RH. Information loss with transform methods in system identification: a new set of transforms with high information content. Math. Biosci. 1980;50:251–262. [Google Scholar]
- 26.Kanowski M, Kaufmann J, Braun J, Bernarding J, Tempelmann C. Quantitation of simulated short echo time 1H human brain spectra by LCModel and AMARES. Magn Reson Med. 2004;51:904–912. doi: 10.1002/mrm.20063. [DOI] [PubMed] [Google Scholar]
- 27.Tkac I, Oz G, Adriany G, Ugurbil K, Gruetter R. In vivo 1H NMR spectroscopy of the human brain at high magnetic field: metabolite quantification at 4T vs. 7T. Magn Reson Med. 2009;62:868–879. doi: 10.1002/mrm.22086. [DOI] [PMC free article] [PubMed] [Google Scholar]
- 28.Inglese M, Rusinek H, George IC, Babb JS, Grossman RI, Gonen O. Global average gray and white matter N-acetylaspartate concentration in the human brain. NeuroImage. 2008;41:270–276. doi: 10.1016/j.neuroimage.2008.02.034. [DOI] [PMC free article] [PubMed] [Google Scholar]
- 29.Kirov II, Liu S, Fleysher R, Fleysher L, Babb JS, Herbert J, Gonen O. Brain metabolite proton T2 mapping at 3.0 T in relapsing-remitting multiple sclerosis. Radiology. 2010;254:858–866. doi: 10.1148/radiol.09091015. [DOI] [PMC free article] [PubMed] [Google Scholar]
- 30.Zhang Y, Marenco S, Shen J. Correction of frequency and phase variations induced by eddy currents in localized spectroscopy with multiple echo times. Magn Reson Med. 2007;58:174–178. doi: 10.1002/mrm.21265. [DOI] [PubMed] [Google Scholar]


