

Abstract
Diffuse optical spectroscopic imaging (DOSI) non-invasively and quantitatively measures tissue haemoglobin, water and lipid. Pilot studies in small groups of patients demonstrate that DOSI may be useful for longitudinal monitoring and predicting breast cancer neoadjuvant chemotherapy pathological response. This study evaluates the performance of a bedside DOSI platform in 34 breast cancer patients followed for several months. DOSI optical endpoints obtained at multiple timepoints are compared with final pathological response. Thirty-six stage II/III breast cancers (34 patients) were measured in vivo with DOSI prior to, in the middle of and after the completion of pre-surgical neoadjuvant chemotherapy. Cancer therapies ranged from standard anthracyclines to targeted therapies. Changes in DOSI-measured parameters at each timepoint were compared against final surgical pathology. Absolute changes in the tumour-to-normal (T/N) ratio of tissue deoxyhaemoglobin concentration (ctHHb) and relative changes in the T/N ratio of a tissue optical index (TOI) were most sensitive and correlate to pathological response. Changes in ctHHb and TOI were significantly different between tumours that achieved pathological complete response (pCR) versus non-pCR. By therapy midpoint, mean TOI-T/N changes were 47±8 versus 20±5 per cent for pCR versus non-pCR subjects, respectively (Z=0.011). Changes in ctHHb and TOI scaled significantly with the degree of pathological response (non-, partial and complete). DOSI measurements of TOI separated pCR from non-pCR by therapy midpoint regardless of drug or dosing strategy. This approach is well suited to monitoring breast tumour response and may provide feedback for optimizing therapeutic outcomes and minimizing side-effects.
Keywords: near-infrared, tissue spectroscopy, multiple scattering, therapeutic monitoring, photon migration, cancer imaging
1. Introduction
(a). Diffuse optical spectroscopic imaging
Diffuse optical imaging (DOI) and diffuse optical spectroscopy (DOS) are model-based methods that employ principles of time- and/or frequency-domain photon migration for measuring near-infrared (NIR) tissue absorption and scattering signatures. The NIR, defined as 650–1000 nm, is particularly attractive for oncological applications because of its deep tissue penetrance and high sensitivity to haemoglobin concentration and oxygenation state. With sufficient spectral bandwidth, NIR optical imaging can also provide quantitative information about tissue water and lipid and these measurements have been shown to correlate directly with magnetic resonance imaging (MRI) [1].
Medical diagnostic techniques based on NIR transillumination were first introduced in the 1920s to detect breast cancer [2]. Although NIR light penetrates tissues to depths of several centimetres, early methods were not successful owing to the fact that these approaches were qualitative and did not account for distortions from multiple light scattering. Current DOI and DOS technologies make it possible to separate light absorption from scattering and quantify subtle changes in biochemical composition in thick tissues. While the spatial resolution of DOS is inferior to conventional anatomic imaging methods such as X-ray mammography and MRI [3], diffuse optical methods can be particularly well suited to neoadjuvant chemotherapy (NAC) monitoring. This is owing to the fact that patients undergoing NAC have large, well-localized tumours (e.g. approx. 2–10 cm). Consequently, their position is known a priori and the DOS measurement can be optimized for sensitivity to tumour functional changes using quantitative spectroscopic tools rather than size or volumetric changes which may occur later in the course of treatment [4].
(b). Neoadjuvant therapy in breast cancer
Pre-surgical NAC offers unique opportunities for research and patient care [5–7]. In practice, NAC can reduce tumour size, improve breast tissue conservation during surgery and initiate treatment of micrometastases [8]. A significant potential benefit of NAC is that tumour response can be assessed in vivo on an individual basis. Accurate tumour monitoring would allow for optimization of drug dose and clinical outcomes, while providing oncologists with insights into therapeutic response mechanisms.
Conventional therapeutic endpoints for cancer treatments are 5–10 year overall survival and disease-free survival. Surrogate endpoints obtained prior to and during treatment are desirable to facilitate more rapid assessment of therapeutic strategies. Complete pathological response (pCR) is an important endpoint that correlates with survival in patients receiving NAC [9–14]. A major advantage of pCR is that assessment is performed at the completion of therapy (i.e. after a few months) and it provides a good projection for 5 year survival/disease-free survival. Although pCR is obtained relatively quickly (compared with 5 year survival), there is a significant interest in developing molecular and imaging-based biomarkers to enhance or replace pCR. These could provide dynamic feedback during therapy, giving oncologists new methods for clinical decision-making that optimize therapeutic outcomes and minimize collateral tissue damage.
(c). Imaging neoadjuvant therapy response
Standard clinical assessments (e.g. physical examination, ultrasound and mammography) have been shown to be inadequate for predicting NAC pathological response [15–17]. It is unlikely that early changes in tumour size alone are predictive of final pathological response. Functional imaging with advanced techniques such as MRI, magnetic resonance spectroscopy (MRS) and positron emission tomography (PET) has shown improved response assessment capabilities over conventional anatomic imaging [18–32]. However, these functional methods can be difficult to perform in advanced stage cancer patients (lengthy scan times, exogenous contrast, high cost), particularly when frequent measurements are desired. In addition, there is currently no consensus on optimal timepoints and quantitative response measures.
The use of NIR optical imaging to track tumour response to NAC was first described in a single patient [33]. Several DOS measurements were performed during NAC treatments extending over several weeks of cytotoxic therapy. Total tumour haemoglobin concentration (ctTHb) and tumour water concentration (ctH2O) dropped significantly by 56 and 67 per cent, respectively. The drop in ctTHb was consistent with diminished vessel density, which is a signature of NAC response [34]. Tumour to control water/lipid ratio dropped 4.4-fold, which was in excellent agreement with previous findings from MRS that showed very similar changes [35]. Subsequent studies have supported these findings by direct comparison or integration of NIR optical imaging with MRI [36,37].
Further studies have suggested that optical imaging parameters may be surrogate indicators for pathological response. DOS measurements acquired within one week prior to chemotherapy and approximately one week after the start of chemotherapy demonstrated significant differences depending on the final pathological response [38]. DOS-measured tumour concentrations of deoxy-haemoglobin (ctHHb), oxyhaemoglobin (ctO2Hb) and ctH2O dropped 27±15, 33±7 and 11±15 per cent, respectively, within one week of the first treatment for pathology-confirmed responders (N=6), while non-responders (N=5) and normal side controls showed no significant changes in these parameters. Later studies have subsequently reported correlations between sensitive NIR parameters and pathological response [39–41].
(d). Study goal
The goal of this study was to assess whether functional optical imaging biomarkers of tumour metabolism are sensitive to chemotherapy throughout the entire course of treatment. DOS and DOI pilot studies have demonstrated that, within a single therapeutic cycle [38], after one or two cycles [39–41], and at the conclusion of all cycles [40,41], changes in tumour optical/physiological properties are related to pathological response. In this study, we expanded the number of patients, treatment drugs and measurement timepoints to survey the sensitivity of diffuse optical spectroscopic imaging (DOSI) to therapeutic efficacy. Our results provide strong correlations between the degree of pathological response and the change in optical imaging biomarkers measured at different timepoints. With 34 patients (36 tumours), including 11 pathological complete responders (pCR), these results represent the largest known study of DOS/DOI technology in the NAC setting.
2. Material and methods
(a). Instrumentation
The instrument used in this study is based on DOSI technology that is not commercially available and was designed and constructed in our laboratory [42]. DOSI uses a combination of frequency-domain and continuous-wave or time-independent tissue spectroscopies to measure tissue optical absorption and reduced scattering within the entire NIR spectral bandwidth (650–1000 nm). Briefly, the frequency-domain component of the instrument allows for absolute quantification of tissue optical properties at discrete wavelengths, while the time-independent component determines the optical properties at continuous wavelengths across the NIR spectrum. The frequency-domain portion of the DOSI instrument employs six commercially available diode laser sources (660, 690, 780, 808, 830 and 850 nm) and an avalanche photodiode (APD) detector. The continuous-wave portion of the DOSI instrument employs a fibre-coupled broadband white-light source and a fibre-coupled 16 bit, 1024 pixel, cooled charge-coupled device spectrometer. The spectrometer system detects broadband light from 650 to 1000 nm with approximately 0.4 nm per pixel at 8 nm spectral resolution (i.e. resolving power). A handheld probe incorporates all source optical fibres, as well as the APD and spectrometer detector fibres. A reflectance geometry with a 28 mm source to detector separation is used, which provides an average penetration below the skin of 10–20 mm. Frequency-domain and steady-state measurements are performed using a pre-set timing technique with less than 20 mW of optical power launched into the tissue per source. Frequency-domain instrument response is removed by calibrating with a tissue-simulating phantom with known absorption and scattering properties. Spectral artefacts are removed by calibrating on a spectraflect-coated integrating sphere.
(b). Measured information content
Simple calculations using the Beer–Lambert law and known absorber extinction coefficients were used to convert the absorption spectra into quantitative measures of tissue concentrations of ctHHb (μM), ctO2Hb (μM), ctH2O (%) and ctLipid (bulk lipids, %), which are the primary NIR absorbers in breast tissue [42–44]. ctH2O is the concentration of measured tissue water divided by pure water concentration (55.6 M). Tissue lipids are reported as the percentage lipid measured relative to an assumed ‘pure’ lipid density of 0.9 g ml−1. Thus, reported water and lipid percentages are relative figures of merit compared with pure solutions of the substance and are neither strict volumes nor add upto 100 per cent. The reduced scattering properties of tissue are reported as the results of a power-law fit to the measured frequency-domain reduced scattering values at multiple wavelengths. The absolute value of the exponent resulting from this fit is termed the scatter power (SP). In general, the SP is related to the size of the tissue scattering particles in relation to the optical wavelength. Further, we calculated a tissue optical index (TOI), defined as ctHHb×ctH2O/ctLipids, which has been demonstrated as a contrast function for identifying diseased tissues derived from an analysis of 58 malignant tumours [42].
(c). DOSI measurement technique
All DOSI measurements and procedures were performed under institution-approved human subject protocols and a detailed description of the measurement technique has recently been reported [45]. Briefly, a handheld probe was used to map a grid of spatial locations that covered both normal and tumour tissues. The lesion location was known a priori from ultrasound and palpation. A 10 mm spaced point grid was marked on the breast using a non-permanent surgical skin pen to denote the DOSI scan area (figure 1). The scan area was large enough to keep the lesion within the grid (in the x–y plane), despite possible day-to-day variations in the measurement technique. Because the lesions in this study ranged in size, so did the DOSI scan field of view; the reason for this was the 5–10 s per point scan times, a limitation that has been addressed in faster versions of the instrument.
Figure 1.
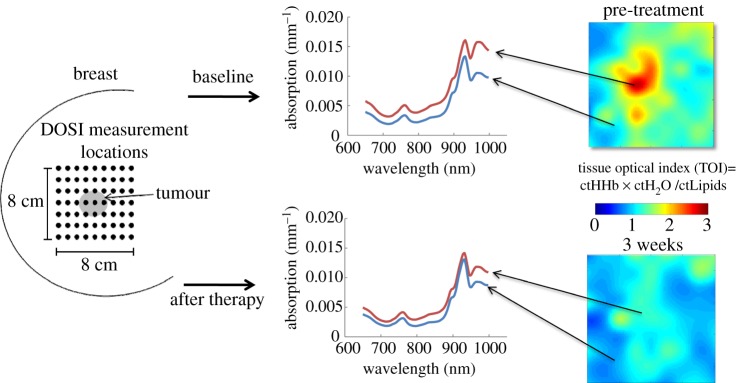
Simple two-dimensional maps of tumour metabolism derived from tissue optical properties are generated by measuring broadband absorption and scattering spectra (650–1000 nm) along a grid of discrete points on the surface of the breast. On the left is a grid (spacing 10 mm) with each dot representing a DOSI measurement site where broadband absorption and scattering spectra were acquired. On the right, maps of TOI (=ctHHb × ctH2O/ctLipids) were generated from the measured spectra; map points were interpolated for display purposes. Representative TOI maps of a breast lesion at two timepoints are shown with absorption spectra from normal (N) and tumour (T) regions as indicated in the TOI maps. In this example, a pathological complete response was achieved with spectra in the T region approaching those of the N region. Red line, lesion; blue line, normal. (Online version in colour.)
The DOSI probe was placed with light pressure without compression on the skin surface. Care was taken to perform DOSI with the patient in a constant position during each measurement session; subjects were supine on a recliner at about 30° from horizontal with their ipsilateral arm resting up above their head. The handheld probe is mostly insensitive to the probe application pressure; only light contact (gravitational pressure) without compression was used for all the measurements; contact pressure is not a significant source of measurement variation in DOSI [46].
(d). Image analysis
Functional maps of breast tissue physiological properties (ctHHb, ctO2Hb, ctH2O, bulk lipids, TOI) were calculated using the measured NIR absorption spectra from each measured grid location (figure 1). Each location on the grid was treated as an independent measurement. The value of each parameter recovered from this grid location (e.g. TOI) was plotted in this two-dimensional space and no tomographic reconstructions were used. Tissue within the scan area was modelled as homogeneous in accordance with simple diffusion theory. For visualization purposes, map points were interpolated using two-dimensional nearest-neighbour cubic splines to round out the discrete shapes (figure 1). However, all reported values used only the discrete measurement points from the grid. All scale bars were determined using the maximum and minimum values of the map.
The tumour location in the map was defined to be the location of maximum TOI which is defined as ctHHb×ctH2O/ctLipid. The TOI has been shown to be a sensitive index for identifying malignant tissue regions in the breast [42]. In order to define a region of interest for the tumour in a consistent and unbiased manner, we used full-width at half-maximum (FWHM) of the TOI parameter for the entire grid as an automatic threshold point. A spatial mask was generated using the TOI map: spatial locations with TOI values above the TOI FWHM were considered to be tumour tissue, whereas spatial locations with TOI values below the TOI FWHM were considered to be normal tissue. Reported TOI tumour values were TOI averages of points above the TOI FWHM threshold, whereas reported TOI normal tissue values were TOI averages of points below the TOI FWHM threshold. This automatically calculated feature-based stratification was preferred to a strict spatial segmentation of lesion area to guard against possible movement of the lesion and/or optically scanned area. Note that the threshold was calculated independently for each measurement session. For all DOSI calculations (e.g. ctHHb), the same TOI FWHM mask was used; we thus averaged each DOSI parameter within the same exact region of interest. Because of the relatively low spatial resolution, the small nuances of the lesion contours are not meaningful.
(e). Patient selection and treatment schedule
Thirty-four patients were studied with 36 breast lesions (two with bilateral disease). Subjects were placed on NAC by their attending physician (R.M.) using several different therapeutic schema. All treatment decisions (table 1) were based solely on patient considerations by the attending physician; DOSI findings were not factored into any therapeutic decisions. All patients received standard biopsies to confirm the presence of malignancy prior to neoadjuvant treatment. All patients had suspicious lesions as confirmed by standard radiology (mammography, ultrasound and/or MRI). All patients received surgery at the conclusion of neoadjuvant treatment with an accompanying surgical pathology report.
Table 1.
Therapy options and final pathological responses. A/C, Adriamycin/Cytoxan; Ab, Abraxane; Cb, carboplatin; Av, bevacizumab; Tz, trastuzumab; T, Taxol.
| complete | non-complete |
||||
|---|---|---|---|---|---|
| IDs | treat | pCR | pPR | pNR | total |
| 1 | A/C | 0 | 1 | 0 | 1 |
| 2 | A/C+Cb/T | 4 | 3 | 3 | 10 |
| 3 | A/C+Ab/Cb+Bz | 3 | 3 | 4 | 10 |
| 4 | A/C+Ab/Cb+Tz | 2 | 2 | 0 | 4 |
| 5 | Ab/Cb+Bz | 0 | 2 | 3 | 5 |
| 6 | Ab/Cb+Tz | 2 | 0 | 2 | 4 |
| 7 | Cb/T | 0 | 0 | 2 | 2 |
| totals | 11 | 11 | 14 | N=36 | |
There were six different neoadjuvant drugs used over the course of this study, arranged in seven different treatment schema (table 1). Treatment IDs 1–4 all started with doxorubicin (Adriamycin; 60 mg m−2) and cyclophosphamide (Cytoxan; 600 mg m−2), denoted by ‘A/C’. A/C was administered for two or four cycles with each cycle lasting two weeks. Most patients were treated with four cycles, but according to the treatment protocol (R.M.) the A/C stage was cut to two cycles if a desirable response (assessed by palpation, ultrasound and/or MRI) was not achieved. The patient treated with ID 1 (N=1) was given only A/C. Patients treated with ID 2 (N=10) received both carboplatin (Paraplatin; area under curve (AUC)=2 mg ml−1 min−1), denoted by ‘Cb’ (carboplatin) and paclitaxel (Taxol; 60 mg m−2), denoted by ‘T’, for 8–12 weekly treatments. Patients treated with ID 3 (N=10) and ID 4 (N=4) received the same A/C treatment in an initial stage (two or four cycles), but differed in treatments during a second stage. In these second stages, all patients received Nab-paclitaxel (Abraxane; 90 mg m−2), denoted by ‘Ab’, and Paraplatin in cycles consisting of three consecutive weeks plus a week off; this cycle was repeated three or four times. Targeted therapies were issued in this second stage based upon human endothelial receptor 2 (HER2) status; HER2+ received trastuzumab (Tz; 12–16 weekly doses) and HER2− received bevacizumab (Bz; 6–8 biweekly doses of 10 mg kg−1). Patients in categories ID 5 (N=5) and ID 6 (N=4) were the same as the second stage of IDs 3 and 4; Nab-paclitaxel and Paraplatin in conjunction with trastuzumab or bevacizumab depending upon HER2 status. Two patients treated under ID 7 received only Paraplatin and paclitaxel.
Table 1 further provides the pathological responses for each of the treatment options. Pathological complete response (pCR) was defined as the absence of malignancy in the affected region of the breast; ductal carcinoma in situ (DCIS) was acceptable as part of pCR. Other categories of response are less definite and as such we employed two different classification schemes (binary and tertiary). Both classification schemes classify pCR in the same way, but differ in how non-complete pathological cases are reported. In the binary scheme, all non-pCRs were grouped together as non-pCR. In the tertiary scheme, this non-pCR category was further stratified into pathological non-response (pNR) and pathological partial response (pPR). pNR was defined as less than a 20 per cent change from initial lesion size (via radiology) to final lesion size (via surgical pathology). pPR was then defined as anything in between pCR and pNR. These designations are not perfect because the separation between pPR and pNR can be somewhat arbitrary.
(f). DOSI measurement schedule
Written informed consent was provided by subjects in order to participate in this study. DOSI measurements occurred throughout the duration of chemotherapy treatments. All subjects received DOSI measurements prior to all neoadjuvant treatment (i.e. baseline; ‘B’) as well as after the conclusion of all NAC prior to surgery (i.e. final; ‘F’). In patients receiving two stages of therapy (IDs 2, 3 and 4), DOSI measurements were performed at the conclusion of the first stage. In patients receiving a single therapy stage (IDs 1, 5, 6 and 7), the measurements were performed roughly after eight weeks. Both measurements, approximately at the therapy midpoints, are designated as ‘mid’.
(g). Statistical considerations
Non-parametric statistics were used for all statistical comparisons. Comparisons between the responder groups were performed using the Wilcoxon rank sums or Kruskal–Wallis tests for two and three group comparisons, respectively. Significance was assumed at a confidence interval of 95 per cent (α=0.05) for a two-tailed distribution in the Wilcoxon rank sum test. We further assumed that all measurements were independent. All statistical calculations were performed using commercial software (JMP IN; SAS Institute, NC). Error bars for population data were the population standard errors.
3. Results
(a). Baseline tumour properties
Tumour optical–physiological properties differ significantly from those of normal tissues. Tumour optical properties prior to all treatment (baseline) and at the conclusion of all treatment (final) are outlined in table 2. Baseline values of all tumours (N=36) are provided in the top rows of the table. Five DOSI parameters are reported for both tumour (left columns) and normal (right columns) tissues: water (ctH2O), bulk lipid, deoxyhaemoglobin (ctHHb), oxy-haemoglobin (ctHHbO2) and TOI. Three statistical categories are reported: mean value, standard error and median value. Statistical comparisons were performed using a two-sided Wilcoxon rank sum test (α=0.05 significance level).
Table 2.
Optical–physiological properties of tumours and normal tissues (N=36).
| tumour |
normal |
tumour/normal |
||||||||
|---|---|---|---|---|---|---|---|---|---|---|
| variable | mean | STE | median | mean | STE | median | mean | STE | median | |
| baseline | ctH2O (%) | 34.4 | 2.4 | 31.0 | 20.2 | 1.2 | 19.6 | 1.75 | 0.11 | 1.52 |
| lipid (%) | 54.5 | 2.2 | 56.7 | 63.7 | 1.5 | 63.5 | 0.85 | 0.03 | 0.88 | |
| ctHHb (μM) | 8.68 | 0.50 | 8.07 | 6.37 | 0.96 | 5.33 | 1.58 | 0.09 | 1.45 | |
| ctO2Hb (μM) | 24.2 | 1.6 | 22.7 | 17.5 | 0.82 | 16.8 | 1.42 | 0.08 | 1.32 | |
| TOI | 8.95 | 2.2 | 4.38 | 2.21 | 0.49 | 1.64 | 4.62 | 1.03 | 2.35 | |
| final | ctH2O (%) | 25.2 | 1.8 | 23.2 | 18.8 | 0.9 | 17.6 | 1.34 | 0.08 | 1.19 |
| lipid (%) | 59.8 | 2.0 | 59.4 | 64.8 | 1.2 | 65.0 | 0.92 | 0.02 | 0.95 | |
| ctHHb (μM) | 6.40 | 0.32 | 6.05 | 5.58 | 0.46 | 4.90 | 1.23 | 0.05 | 1.21 | |
| ctO2Hb (μM) | 15.3 | 1.1 | 15.0 | 13.3 | 0.7 | 13.3 | 1.16 | 0.05 | 1.16 | |
| TOI | 3.69 | 0.72 | 2.33 | 1.72 | 0.22 | 1.29 | 2.14 | 0.31 | 1.51 | |
Compared with normal tissues, these malignant tumours demonstrated higher mean water percentage (34.4 versus 20.2%, Z<0.0001), lower mean bulk lipid percentage (54.5 versus 63.7%, Z=0.0003), higher mean deoxyhaemoglobin concentration (8.68 versus 6.37 μM, Z<0.0001) and higher mean oxy-haemoglobin concentration (24.2 versus 17.5 μM, Z=0.0013). The mean value of the composite index TOI in tumour tissues was significantly elevated relative to normal (8.95 versus 2.21, Z<0.0001). The tumour-to-normal (T/N) ratio followed the same pattern ranging from baseline values of 1.75 (ctH2O), 0.85 (Lipid), 1.58 (ctHHb), 1.42 (ctO2Hb) and 4.62 (TOI). These results are consistent with our previous findings [42].
(b). Treated tumour properties
At the conclusion of all therapy, averaging over all pathological responses and treatments, significant changes in tumour physiological properties occurred in both normal and malignant tissues. Tumour tissue values approached those of normal tissues: lower mean ctH2O (−27% relative change, Z=0.0007), higher mean lipids (+9.7% relative change, Z=0.08), lower mean ctHHb (−26% relative change, Z=0.0002), lower mean ctO2Hb (−37% relative change, Z<0.0001) and lower mean TOI (−59% relative change, Z=0.0006). Normal tissue values changed but not significantly except in the case of ctO2Hb: lower mean ctH2O (−6.9% relative change, Z=0.16), higher mean lipid (+1.7% relative change, Z=0.49), lower mean ctHHb (−12% relative change, Z=0.0.52), lower mean ctO2Hb (−24% relative change, Z=0.0004) and lower mean TOI (−22% relative change, Z=0.29). These changes are mirrored in the T/N ratios; T/N changed significantly from baseline to final measurements, except for bulk lipids. Chemotherapy is known to affect breast density, even in normal tissues [47].
(c). Stratified responses (binary)
DOSI-measured parameters changed in proportion to the degree of pathological response assessed at the conclusion of all neoadjuvant therapies. Figure 2 compares changes in all DOSI parameters with respect to pCR (N=11) or non-pCR (N=25) for (figure 2a) normalized TOI-T/N and (figure 2b) ctHHb T/N ratios. T/N refers to taking the average parameter value above the map FWHM (i.e. T) and dividing it by the average parameter value below the map FWHM (i.e. the N) (figure 1). Changes in normalized TOI-T/N and absolute ctHHb T/N ratios at different stages throughout neoadjuvant therapy were observed: pre-therapy, mid-therapy and post-therapy. ‘Normalized’ refers to dividing each TOI-T/N value by the TOI-T/N value at baseline. The error bars represent the standard errors for each population (pCR and non-pCR). Significant decreases in TOI-T/N are observed in tumours that achieved pCR (figure 2a) and these decreases were maintained throughout the treatment by dropping 60 per cent from the baseline. These decreases were significantly different from the changes observed in the non-pCR population (mid, Z=0.01; final, Z=0.001). Similar results were observed for the ctHHb T/N absolute value (figure 2b); larger decreases were observed in the pCR population (mid, Z=0.062; final 0.003). Overall, the ctHHb T/N was higher at the baseline in non-pCR tumours though the difference was not significant (Z=0.48). We further observed that the ctHHb T/N value approached unity at the conclusion of therapy for the tumours that achieved pCR.
Figure 2.
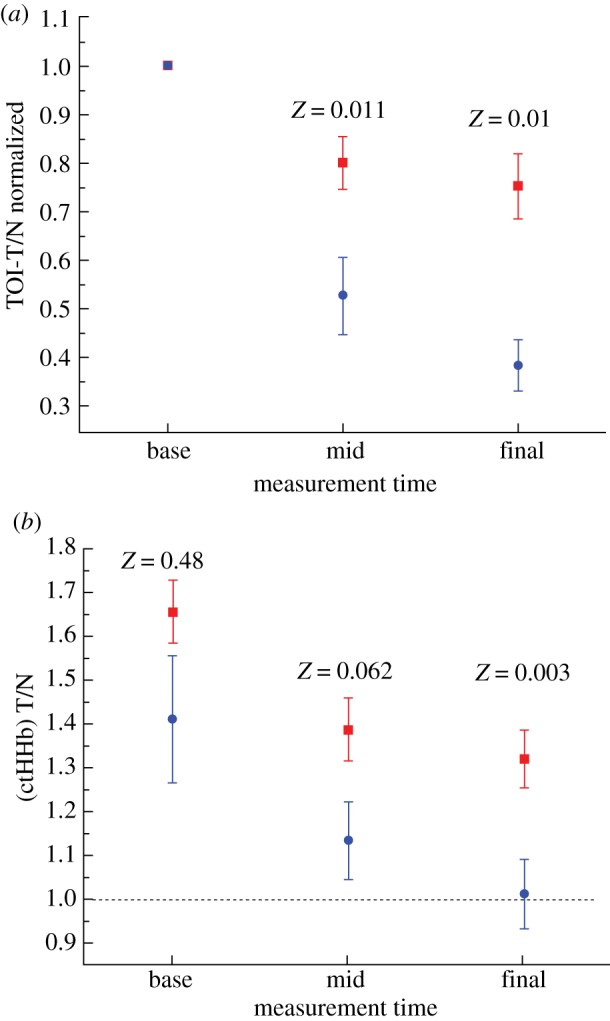
(a) TOI-T/N values normalized to the baseline value stratified by pathological complete response (pCR, N=11) and non-pathological complete response (N=25) tumours. The TOI values dropped significantly more in the pCR tumours during all phases of the therapy. (b) Tissue concentration of deoxygenated haemoglobin (ctHHb) T/N values stratified in similar fashion. The ctHHb values dropped significantly more in the pCR tumours and approached normal values at the conclusion of neoadjuvant treatment. Z values are the result of the Wilcoxon rank sum test for the entire population at a given measurement timepoint. Error bars represent the population standard error (squares, non-pCR; circles, pCR). (Online version in colour.)
Table 3 provides the data for all DOSI parameters stratified by final pathological response. The top rows display the absolute T/N for each DOSI parameter and the bottom rows display the T/N normalized to the baseline value. Each value is provided with the standard error in the last two digits of the value. In general, non-pCR tumours changed less than pCR tumours. For example, non-pCR TOI-T/N decreased from 3.91 to 2.48 at the conclusion of neoadjuvant therapy, whereas in pCR tumours the decrease was from 6.2 to 1.34 (note that the median values of TOI-T/N were more closely matched at the baseline: 2.34 for non-pCR and 2.45 for pCR). Lipids generally increased more in the pCR tumours. ctH2O, ctHHb and ctO2Hb generally decreased more in pCR tumours as well. The differences between baseline DOSI parameters were not significant. In general, the ctHHb T/N absolute value and ctH2O and TOI-T/N normalized values displayed significant differences between non-pCR and pCR tumours throughout the neoadjuvant treatment. We note that mid-treatment comparisons are somewhat mismatched because they represent different lengths of time within the neoadjuvant treatment. The general trends are encouraging.
Table 3.
DOSI parameters: changes stratified by binary pathological response.
| pCR versus non-pCR |
|||||||
|---|---|---|---|---|---|---|---|
| non-pCR |
pCR |
||||||
| variable | base | mid | final | base | mid | final | |
| T/N (Abs) | ctH2O | 1.67 (11) | 1.44 (07) | 1.44 (10) | 1.94 (24) | 1.29 (10) | 1.12 (05) |
| lipid | 0.859 (31) | 0.877 (04) | 0.896 (29) | 0.841 (66) | 0.935 (04) | 0.974 (37) | |
| ctHHb | 1.66 (11) | 1.39 (07) | 1.32 (06) | 1.41 (15) | 1.13 (09) | 1.01 (08) | |
| ctO2Hb | 1.41 (08) | 1.29 (05) | 1.21 (05) | 1.45 (21) | 1.13 (13) | 1.04 (11) | |
| TOI | 3.91 (74) | 2.57 (44) | 2.48 (43) | 6.2 (3.0) | 2.12 (56) | 1.34 (21) | |
| T/N (norm) | ctH2O | 1 | 0.92 (03) | 0.89 (04) | 1 | 0.70 (05) | 0.63 (05) |
| lipid | 1 | 1.02 (04) | 1.06 (03) | 1 | 1.19 (10) | 1.30 (20) | |
| ctHHb | 1 | 0.88 (03) | 0.84 (03) | 1 | 0.86 (07) | 0.77 (06) | |
| ctO2Hb | 1 | 0.96 (04) | 0.90 (04) | 1 | 0.84 (07) | 0.76 (08) | |
| TOI | 1 | 0.80 (05) | 0.75 (07) | 1 | 0.53 (08) | 0.39 (53) | |
(d). Stratified responses (tertiary)
Figure 3 displays the normalized TOI-T/N value (a) and displays ctHHb-T/N value (b) for each response group: pCR (N=11), pPR (N=11) and pNR (N=14). We provide results at the same base, mid- and final timepoints used in the binary classification.
Figure 3.

(a) TOI-T/N values normalized to the baseline value stratified by pathological complete response (pCR, N=11), partial pathological response (pCR, N=11) and non-pathological response (N=14) tumours. The TOI values dropped significantly more in the pCR tumours during all phases of the therapy. (b) Tissue concentration of deoxygenated haemoglobin T/N values stratified by pathological response. H values are the result of the Kruskal–Wallis ranked sum test for the entire population at a given measurement timepoint. Error bars represent the population standard error (square, pNR; circle, pPR; triangle, pCR). (Online version in colour.)
The rate of change in TOI-T/N scales with the degree of pathological response. Compared with the binary classification scheme in figure 2, we observe that the pNR patients dropped less than 10 per cent at all the measured timepoints. While TOI-T/N in the pPR category continues to decrease throughout the treatment, we note that the TOI-T/N decreases more sharply in the pCR patient category. At the treatment midpoint, the Kruskal–Wallis test H-statistic was 0.0073, indicating that these median values are not from identical populations. Although not definitive, the Bonferroni correction suggests that the rate of change for the normalized TOI-T/N value is significantly different between pCR, pPR and pNR [48]. We found that the same general trend was true at the treatment endpoint (H=0.0004). The same scenario is evident in ctHHb-T/N values, but this time the pNR and pPR responses were more similar in comparison with the pCR response. As in the case with TOI-T/N, the final timepoint suggests that stratification is possible but this is not clear at the therapy midpoint.
(e). Drug-dependent effects
We checked the dependence of our results on the particular therapy used. Given the relatively low patient numbers per category and the high degree of variance in treatment protocols, it is not feasible to assess statistical significance. Nevertheless some trends are observable. Keeping these limitations in mind, we compared patients treated with targeted therapies (i.e. H and Av, bevacizumab (Avastin)) versus patients treated without any targeted therapies (N=23 and 13, respectively). For pCR patients treated with targeted therapies (N=4), the TOI-T/N normalized values were not significantly different from patients without targeted therapies (N=7). Values at the therapy midpoint were 0.40±0.07 and 0.60±0.11 for patients treated with and without any targeted therapies, respectively. Similarly, no statistically significant differences at therapy midpoint were found for the non-pCR patients: values were 0.82±0.07 and 0.77±0.10 for patients treated with (N=16) and without (N=9) any targeted therapies, respectively. Thus, it appears that DOSI-measured parameters are more significantly affected by the degree of pathological response than by the particular therapeutic mechanism.
4. Discussion
DOSI measurements of breast tumour response to NAC provide quantitative functional indices derived from spectroscopic features. DOSI information content changes throughout the course of treatment in proportion to the degree of pathological response. As shown in previous studies, T/N ratios of both the TOI and deoxyhaemoglobin concentration (ctHHb) correlate best with the degree of pathological response determined by standard surgical pathology [38,44]. The degree of TOI change stratified by pCR/non-pCR was statistically significant by the midpoint of therapy (Z=0.011), and was not statistically significant for ctHHb at the same timepoint (Z=0.062). Similar results have been observed using PET and MRS [23,49]. Both TOI and ctHHb were statistically significant by the conclusion of therapy.
Our current study results fit within the context of previous work. Direct comparison between studies is difficult because of the difference in measured timepoints and optical parameters. We previously reported that both ctHHb and ctH2O decreased significantly in pathological responders after one week of A/C therapy [38]. These decreases are consistent with the TOI decreases (which are proportional to ctHHb and ctH2O) observed in this study; however, we note that the measurement timepoints differed (one week post-therapy versus therapy midpoint). A detailed case study demonstrating that TOI decreases in response to NAC revealed a TOI-T/N drop in a partial responder (non-pCR) of about 30 per cent by therapy midpoint, which is consistent with the average 20 per cent drop reported here [50]. Soliman et al. [41] reported that ctHHb and ctO2Hb decreased significantly in stronger pathological responders after four weeks of chemotherapy; ctH2O also decreased but not significantly when compared with poor responders. We note that these studies used a tomographic method to image larger tumours and subjects did not achieve pCR (N=10). Despite differences in patient population and imaging approach, the results of Soliman et al. [41] are consistent with our findings.
DOSI measurements of endogenous tissue haemoglobin, water and lipids are indicators of important metabolic alterations in tumours that may well complement current efforts to assess breast tumour response. Because DOSI measures several functional contrast elements related to cellular metabolism, angiogenesis and extracellular matrix, NIR optical methods have the potential to provide important functional information related to tumour regression [38,44]. Given these functional sensitivities, we have adopted terminology used in the MRI/MRS community and suggest the term ‘optical imaging biomarker’, where ‘biomarker’ applies to ‘any detectable biological parameter, whether biochemical, genetic, histologic, anatomic, physical, functional or metabolic’ [51,52]. Optical biomarkers are in reality ‘pre-biomarkers’ because they are at the ‘proof of concept’ stage [51]. Although DOSI parameters lack the specificity of gene- or protein-based biomarkers, optical imaging measures endogenous biochemical composition and tumour pathological state. A more complete understanding of the relationship between optical imaging biomarkers and classical biomarkers (e.g. Ki67) or therapeutic endpoints (e.g. pathological response) is an important area of future research.
Therapeutic drug monitoring in the neoadjuvant setting is an ideally suited application for diffuse optical methods because it accentuates the strengths (functional, portable) and offsets the limitations (low spatial resolution) of the technique. DOSI resolution limits are a consequence of multiple-light scattering in a relatively large sample volume, providing macroscopically averaged tissue absorption and scattering properties at depths up to several centimetres. Consequently, the resolution of DOSI methods is of the order of a few transport scattering lengths (approx. 5 mm to 1 cm), which is similar to PET. However, the potential limitations of DOSI in localizing small lesions are not important in characterizing NAC response in large, palpable stage II–IV tumours. This is because DOSI is inherently a functional imaging technique that is highly sensitive to endogenous biochemical composition and tumour pathological response [38].
Because of its portability and low cost, the bedside DOSI platform used in this study is a low barrier-to-access technology. As such, it potentially creates new opportunities for patients to receive personalized treatment and for physicians to gain insights into mechanisms of cancer appearance and response to therapy. An important practical advantage of our DOSI approach is that it can be used frequently in unconventional settings such as a doctor's surgery or clinic. Portable optical imaging platforms can easily supplement existing radiological methods either as standalone devices or as units integrated into established technologies such as ultrasound, mammography or MRI [40,53].
Although the results of this study are encouraging, some limitations should be noted: two are study design limitations and two others are DOSI limitations. With regard to study design limitations, the study was non-blinded; pathological results were known at the time of analysis and thus the results should be considered correlative and not predictive. For this reason, although the separation of pCR from non-pCR was statistically significant, we have not calculated sensitivity/specificity or receiver operating characteristic (ROC) curve performance. In addition, the optical–physiological responses were not placed within the context of other emerging therapeutic assessment techniques (i.e. MRI, PET, genomic/biomarker profiles); only standard of care surgical pathology was used. Thus, the functional interpretation of TOI changes in response to therapy was based on the relationship between tissue optical properties and conventional histological measures. In the future, the combination of DOSI with tissue and/or blood biomarkers could potentially improve overall predictive power [38].
With regard to DOSI limitations, the entire tumour volume was not imaged, which can result in a ‘partial volume’ effect. NIR photons are heavily attenuated by the large blood volume of tumours, and combined with a single spatial view (i.e. non-tomographic) the tumour underside was not sampled. Because of this limitation, spatially localized pockets of non-responding tumour volume (i.e. heterogeneity) are currently difficult to detect. Improved imaging capabilities may further stratify pPR from pCR. We note that, because we have not employed a tomographic approach, the absolute values of the tumour optical properties depend upon the depth and size on the lesion. We have shown that the extreme values of DOSI measurements are not strongly dependent on tumour size [42], but DOSI absolute values are dependent on tumour depth. However, this limited imaging capability should be balanced against the simplicity of the data acquisition. Continued DOSI technical developments will improve imaging capabilities and minimize this effect. Furthermore, none of the quantities measured are specific for cancer; thus thresholded changes (which are commonly employed in PET) may not reveal true residual disease. Recent discovery of malignancy-specific optical absorption signatures may help in this regard [54].
In order to standardize and coordinate rapidly advancing breast optical methods, a multi-institutional NCI Network for Translational Research in Optical Imaging (NTROI, U54CA105480) was established in 2003. The NTROI helped to build a consensus on NAC monitoring as a primary clinical focus area, and provided guidelines for quantitative image analysis and instrument calibration [53]. The results of this study are an expanded effort relative to initial case studies involving optical methods to track breast tumour response to therapy in human subjects. A prospective multi-centre clinical trial is in development in partnership with the American College of Radiology Imaging Networks (ACRIN-6691) that will employ identical DOSI instruments.
5. Conclusions
This study correlates changes in optically measured biomarkers such as oxy- and deoxyhaemoglobin, water and lipid with pathological response to NAC in 34 breast cancer patients. Overall it was observed that the absolute changes in the T/N ratio of deoxyhaemoglobin concentration and the relative changes in the T/N ratio of a TOI were the most sensitive indicators of pathological response. In a binary scheme (complete versus non-pCR) as well as in a tertiary scheme (complete versus partial versus non-pathological response), the rate of the optically measured responses correlated with the degree of pathological change. By treatment midpoint, mean TOI-T/N changes were 47±8 versus 20±5 per cent for pCR versus non-pCR subjects, respectively (Z=0.011). These results were achieved using a spectrally broadband DOSI instrument that mapped a limited number of spatial locations on the breast. The technology can be used in a clinic setting and offers the potential for rapid physician feedback regarding functional tumour response. Further study is warranted in order to assess DOSI performance in a multi-centre, prospective trial setting and to determine the overall sensitivity and specificity of optical imaging biomarkers.
Acknowledgements
Bruce J. Tromberg and Albert E. Cerussi report patents, owned by the University of California, related to the technology and analysis methods described in this study. The DOSI instrumentation used in this study was constructed in a university laboratory using federal grant support (NIH). A Conflict of Interest form has been submitted.
This work was supported by the National Institutes of Health under grants P41-RR01192 (Laser Microbeam and Medical Program: LAMMP), U54-CA105480 (Network for Translational Research in Optical Imaging: NTROI), U54-CA136400 (NTR), R01-CA142989, and P30-CA62203 (University of California, Irvine Cancer Center support grant). This project was supported by the American Recovery and Reinvestment Act of 2009. BLI programmatic support from the Beckman Foundation is acknowledged. The authors wish to thank Montana Compton and Amanda F. Durkin for their assistance as well as the patients who generously volunteered their time for this study.
References
- 1.Merritt S., Gulsen G., Chiou G., Chu Y., Deng C., Cerussi A. E., Durkin A. J., Tromberg B. J., Nalcioglu O. Comparison of water and lipid content measurements using diffuse optical spectroscopy and MRI in emulsion phantoms. Technol. Cancer Res. Treat. 2003;2:563–569. doi: 10.1177/153303460300200608. [DOI] [PubMed] [Google Scholar]
- 2.Cutler M. Transillumination as an aid in the diagnosis of breast lesions. Surg. Gynecol. Obstet. 1929;48:721–728. [Google Scholar]
- 3.Boas D. A., O'Leary M. A., Chance B., Yodh A. G.1997Detection and characterization of optical inhomogeneities with diffuse photon density waves: a signal-to-noise analysis Appl. Opt. 3675–92. 10.1364/AO.36.000075 (doi:10.1364/AO.36.000075) [DOI] [PubMed] [Google Scholar]
- 4.Srinivasan S., Pogue B. W., Dehghani H., Jiang S., Song X., Paulsen K. D.2004Improved quantification of small objects in near-infrared diffuse optical tomography J. Biomed. Opt. 91161–1171. 10.1117/1.1803545 (doi:10.1117/1.1803545) [DOI] [PubMed] [Google Scholar]
- 5.Wolff A. C., et al. 2008Research issues affecting preoperative systemic therapy for operable breast cancer J. Clin. Oncol. 26806–813. 10.1200/JCO.2007.15.2983 (doi:10.1200/JCO.2007.15.2983) [DOI] [PubMed] [Google Scholar]
- 6.Gralow J. R., Zujewski J. A., Winer E.2008Preoperative therapy in invasive breast cancer: reviewing the state of the science and exploring new research directions J. Clin. Oncol. 26696–697. 10.1200/JCO.2007.15.9459 (doi:10.1200/JCO.2007.15.9459) [DOI] [PubMed] [Google Scholar]
- 7.Jones R. L., Smith I. E.2006Neoadjuvant treatment for early-stage breast cancer: opportunities to assess tumour response Lancet Oncol. 7869–874. 10.1016/S1470-2045(06)70906-8 (doi:10.1016/S1470-2045(06)70906-8) [DOI] [PubMed] [Google Scholar]
- 8.Fisher B., et al. Effect of preoperative chemotherapy on local-regional disease in women with operable breast cancer: findings from National Surgical Adjuvant Breast and Bowel Project B-18. J. Clin. Oncol. 1997;15:2483–2493. doi: 10.1200/JCO.1997.15.7.2483. [DOI] [PubMed] [Google Scholar]
- 9.Fisher B., et al. Effect of preoperative chemotherapy on the outcome of women with operable breast cancer. J. Clin. Oncol. 1998;16:2672–2685. doi: 10.1200/JCO.1998.16.8.2672. [DOI] [PubMed] [Google Scholar]
- 10.Fisher E. R., Wang J., Bryant J., Fisher B., Mamounas E., Wolmark N.2002Pathobiology of preoperative chemotherapy: findings from the National Surgical Adjuvant Breast and Bowel (NSABP) protocol B-18 Cancer 95681–695. 10.1002/cncr.10741 (doi:10.1002/cncr.10741) [DOI] [PubMed] [Google Scholar]
- 11.Symmans W. F, et al. 2007Measurement of residual breast cancer burden to predict survival after neoadjuvant chemotherapy J. Clin. Oncol. 254414–4422. 10.1200/JCO.2007.10.6823 (doi:10.1200/JCO.2007.10.6823) [DOI] [PubMed] [Google Scholar]
- 12.Abrial S. C., et al. 2005High prognostic significance of residual disease after neoadjuvant chemotherapy: a retrospective study in 710 patients with operable breast cancer Breast Cancer Res. Treat 94255–263. 10.1007/s10549-005-9008-8 (doi:10.1007/s10549-005-9008-8) [DOI] [PubMed] [Google Scholar]
- 13.Carey L. A., et al. 2005American Joint Committee on Cancer tumor-node-metastasis stage after neoadjuvant chemotherapy and breast cancer outcome J. Natl. Cancer Inst. 971137–1142. 10.1093/jnci/dji206 (doi:10.1093/jnci/dji206) [DOI] [PubMed] [Google Scholar]
- 14.Mehta R. S., Schubbert T., Kong K.2008Trastuzumab in inflammatory breast cancer Ann. Oncol. 191815–1817. 10.1093/annonc/mdn555 (doi:10.1093/annonc/mdn555) [DOI] [PMC free article] [PubMed] [Google Scholar]
- 15.Yeh E., et al. Prospective comparison of mammography, sonography, and MRI in patients undergoing neoadjuvant chemotherapy for palpable breast cancer. AJR Am. J. Roentgenol. 2005;184:868–877. doi: 10.2214/ajr.184.3.01840868. [DOI] [PubMed] [Google Scholar]
- 16.Mankoff D. A., Dunnwald L. K., Gralow J. R., Ellis G. K., Drucker M. J., Livingston R. B.1999Monitoring the response of patients with locally advanced breast carcinoma to neoadjuvant chemotherapy using [technetium 99m]-sestamibi scintimammography Cancer 852410–2423. 10.1002/(SICI)1097-0142(19990601)85:11%3C2410::AID-CNCR16%3E3.0.CO;2-K (doi:10.1002/(SICI)1097-0142(19990601)85:11<2410::AID-CNCR16>3.0.CO;2-K) [DOI] [PubMed] [Google Scholar]
- 17.Tardivon A. A., Ollivier L., El Khoury C., Thibault F.2006Monitoring therapeutic efficacy in breast carcinomas Eur. Radiol. 162549–2558. 10.1007/s00330-006-0317-z (doi:10.1007/s00330-006-0317-z) [DOI] [PubMed] [Google Scholar]
- 18.Chen J. H., Feig B. A., Hsiang D. J., Butler J. A., Mehta R. S., Bahri S., Nalcioglu O., Su M. Y.2009Impact of MRI-evaluated neoadjuvant chemotherapy response on change of surgical recommendation in breast cancer Ann. Surg. 249448–454. 10.1097/SLA.0b013e31819a6e01 (doi:10.1097/SLA.0b013e31819a6e01) [DOI] [PMC free article] [PubMed] [Google Scholar]
- 19.Warren R. M., Bobrow L. G., Earl H. M., Britton P. D., Gopalan D., Purushotham A. D., Wishart G. C., Benson J. R., Hollingworth W.2004Can breast MRI help in the management of women with breast cancer treated by neoadjuvant chemotherapy? Br. J. Cancer 901349–1360. 10.1038/sj.bjc.6601710 (doi:10.1038/sj.bjc.6601710) [DOI] [PMC free article] [PubMed] [Google Scholar]
- 20.Meisamy S., et al. 2004Neoadjuvant chemotherapy of locally advanced breast cancer: predicting response with in vivo 1H MR spectroscopy—a pilot study at 4 T Radiology 233424–431. 10.1148/radiol.2332031285 (doi:10.1148/radiol.2332031285) [DOI] [PubMed] [Google Scholar]
- 21.Mankoff D. A., Dunnwald L. K., Gralow J. R., Ellis G. K., Schubert E. K., Tseng J., Lawton T. J., Linden H. M., Livingston R. B. Changes in blood flow and metabolism in locally advanced breast cancer treated with neoadjuvant chemotherapy. J. Nucl. Med. 2003;44:1806–1814. [PubMed] [Google Scholar]
- 22.Duch J., et al. 200918F-FDG PET/CT for early prediction of response to neoadjuvant chemotherapy in breast cancer Eur. J. Nucl. Med. Mol. Imaging 361551–1557. 10.1007/s00259-009-1116-y (doi:10.1007/s00259-009-1116-y) [DOI] [PubMed] [Google Scholar]
- 23.Baek H. M., Chen J. H., Nie K., Yu H. J., Bahri S., Mehta R. S., Nalcioglu O., Su M. Y.2009Predicting pathologic response to neoadjuvant chemotherapy in breast cancer by using MR imaging and quantitative 1H MR spectroscopy Radiology 251653–662. 10.1148/radiol.2512080553 (doi:10.1148/radiol.2512080553) [DOI] [PMC free article] [PubMed] [Google Scholar]
- 24.Dunnwald L. K., Gralow J. R., Ellis G. K., Livingston R. B., Linden H. M., Lawton T. J., Barlow W. E., Schubert E. K., Mankoff D. A.2005Residual tumor uptake of [99mTc]-sestamibi after neoadjuvant chemotherapy for locally advanced breast carcinoma predicts survival Cancer 103680–688. 10.1002/cncr.20831 (doi:10.1002/cncr.20831) [DOI] [PubMed] [Google Scholar]
- 25.Partridge S. C., et al. MRI measurements of breast tumor volume predict response to neoadjuvant chemotherapy and recurrence-free survival. AJR Am. J. Roentgenol. 2005;184:1774–1781. doi: 10.2214/ajr.184.6.01841774. [DOI] [PubMed] [Google Scholar]
- 26.Padhani A. R., Hayes C., Assersohn L., Powles T., Makris A., Suckling J., Leach M. O., Husband J. E.2006Prediction of clinicopathologic response of breast cancer to primary chemotherapy at contrast-enhanced MR imaging: initial clinical results Radiology 239361–374. 10.1148/radiol.2392021099 (doi:10.1148/radiol.2392021099) [DOI] [PubMed] [Google Scholar]
- 27.Linden H. M., et al. 2006Quantitative fluoroestradiol positron emission tomography imaging predicts response to endocrine treatment in breast cancer J. Clin. Oncol. 242793–2799. 10.1200/JCO.2005.04.3810 (doi:10.1200/JCO.2005.04.3810) [DOI] [PubMed] [Google Scholar]
- 28.Mankoff D. A., Dunnwald L. K., Gralow J. R., Ellis G. K., Charlop A., Lawton T. J., Schubert E. K., Tseng J., Livingston R. B. Blood flow and metabolism in locally advanced breast cancer: relationship to response to therapy. J. Nucl. Med. 2002;43:500–509. [PubMed] [Google Scholar]
- 29.Esserman L., et al. 2001MRI phenotype is associated with response to doxorubicin and cyclophosphamide neoadjuvant chemotherapy in stage III breast cancer Ann. Surg. Oncol. 8549–559. 10.1007/s10434-001-0549-8 (doi:10.1007/s10434-001-0549-8) [DOI] [PubMed] [Google Scholar]
- 30.Johansen R., Jensen L. R., Rydland J., Goa P. E., Kvistad K. A., Bathen T. F., Axelson D. E., Lundgren S., Gribbestad I. S.2009Predicting survival and early clinical response to primary chemotherapy for patients with locally advanced breast cancer using DCE-MRI J. Magn. Reson. Imaging 291300–1307. 10.1002/jmri.21778 (doi:10.1002/jmri.21778) [DOI] [PubMed] [Google Scholar]
- 31.Sharma U., Danishad K. K., Seenu V., Jagannathan N. R.2009Longitudinal study of the assessment by MRI and diffusion-weighted imaging of tumor response in patients with locally advanced breast cancer undergoing neoadjuvant chemotherapy NMR Biomed. 22104–113. 10.1002/nbm.1245 (doi:10.1002/nbm.1245) [DOI] [PubMed] [Google Scholar]
- 32.Emmering J., Krak N. C., Van der Hoeven J. J., Spreeuwenberg M. D., Twisk J. W., Meijer S., Pinedo H. M., Hoekstra O. S.2008Preoperative [18F] FDG-PET after chemotherapy in locally advanced breast cancer: prognostic value as compared with histopathology Ann. Oncol. 191573–1577. 10.1093/annonc/mdn185 (doi:10.1093/annonc/mdn185) [DOI] [PubMed] [Google Scholar]
- 33.Jakubowski D. B., Cerussi A. E., Bevilacqua F., Shah N., Hsiang D., Butler J., Tromberg B. J.2004Monitoring neoadjuvant chemotherapy in breast cancer using quantitative diffuse optical spectroscopy: a case study J. Biomed. Opt. 9230–238. 10.1117/1.1629681 (doi:10.1117/1.1629681) [DOI] [PubMed] [Google Scholar]
- 34.Makris A., Powles T. J., Kakolyris S., Dowsett M., Ashley S. E., Harris A. L.1999Reduction in angiogenesis after neoadjuvant chemoendocrine therapy in patients with operable breast carcinoma Cancer 851996–2000. 10.1002/(SICI)1097-0142(19990501)85:9%3C1996::AID-CNCR17%3E3.0.co;2-H (doi:10.1002/(SICI)1097-0142(19990501)85:9<1996::AID-CNCR17>3.0.co;2-H) [DOI] [PubMed] [Google Scholar]
- 35.Jagannathan N. R., Singh M., Govindaraju V., Raghunathan P., Coshic O., Julka P. K., Rath G. K.1998Volume localized in vivo proton MR spectroscopy of breast carcinoma: variation of water–fat ratio in patients receiving chemotherapy NMR Biomed. 11414–422. 10.1002/(SICI)1099-1492(199812)11:8%3C414::AID-NBM537%3E3.0.CO;2-W (doi:10.1002/(SICI)1099-1492(199812)11:8<414::AID-NBM537>3.0.CO;2-W) [DOI] [PubMed] [Google Scholar]
- 36.Shah N., Gibbs J., Wolverton D., Cerussi A., Hylton N., Tromberg B. J.2005Combined diffuse optical spectroscopy and contrast-enhanced magnetic resonance imaging for monitoring breast cancer neoadjuvant chemotherapy: a case study J. Biomed. Opt. 10051503. 10.1117/1.2070147 (doi:10.1117/1.2070147) [DOI] [PubMed] [Google Scholar]
- 37.Choe R., et al. 2005Diffuse optical tomography of breast cancer during neoadjuvant chemotherapy: a case study with comparison to MRI Med. Phys. 321128–1139. 10.1118/1.1869612 (doi:10.1118/1.1869612) [DOI] [PubMed] [Google Scholar]
- 38.Cerussi A., Hsiang D., Shah N., Mehta R., Durkin A., Butler J., Tromberg B. J.2007Predicting response to breast cancer neoadjuvant chemotherapy using diffuse optical spectroscopy Proc. Natl. Acad. Sci. USA 1044014–4019. 10.1073/pnas.0611058104 (doi:10.1073/pnas.0611058104) [DOI] [PMC free article] [PubMed] [Google Scholar]
- 39.Jiang S., et al. 2009Evaluation of breast tumor response to neoadjuvant chemotherapy with tomographic diffuse optical spectroscopy: case studies of tumor region-of-interest changes Radiology 252551–560. 10.1148/radiol.2522081202 (doi:10.1148/radiol.2522081202) [DOI] [PMC free article] [PubMed] [Google Scholar]
- 40.Zhu Q., Tannenbaum S., Hegde P., Kane M., Xu C., Kurtzman S. H. Noninvasive monitoring of breast cancer during neoadjuvant chemotherapy using optical tomography with ultrasound localization. Neoplasia. 2008;10:1028–1040. doi: 10.1593/neo.08602. [DOI] [PMC free article] [PubMed] [Google Scholar]
- 41.Soliman H., Gunasekara A., Rycroft M., Zubovits J., Dent R., Spayne J., Yaffe M. J., Czarnota G. J.2010Functional imaging using diffuse optical spectroscopy of neoadjuvant chemotherapy response in women with locally advanced breast cancer Clin. Cancer Res. 162605–2614. 10.1158/1078-0432.CCR-09-1510 (doi:10.1158/1078-0432.CCR-09-1510) [DOI] [PubMed] [Google Scholar]
- 42.Cerussi A., Shah N., Hsiang D., Durkin A., Butler J., Tromberg B. J.2006In vivo absorption, scattering, and physiologic properties of 58 malignant breast tumors determined by broadband diffuse optical spectroscopy J. Biomed. Opt. 11044005. 10.1117/1.2337546 (doi:10.1117/1.2337546) [DOI] [PubMed] [Google Scholar]
- 43.Quaresima V., Matcher S. J., Ferrari M.1998Identification and quantification of intrinsic optical contrast for near-infrared mammography Photochem. Photobiol. 674–14. 10.1111/j.1751-1097.1998.tb05159.x (doi:10.1111/j.1751-1097.1998.tb05159.x) [DOI] [PubMed] [Google Scholar]
- 44.Tromberg B. J., Shah N., Lanning R., Cerussi A., Espinoza J., Pham T., Svaasand L., Butler J.2000Non-invasive in vivo characterization of breast tumors using photon migration spectroscopy Neoplasia 226–40. 10.1038/sj.neo.7900082 (doi:10.1038/sj.neo.7900082) [DOI] [PMC free article] [PubMed] [Google Scholar]
- 45.Tanamai W., Chen C., Siavoshi S., Cerussi A., Hsiang D., Butler J., Tromberg B.2009Diffuse optical spectroscopy measurements of healing in breast tissue after core biopsy: case study J. Biomed. Opt. 14014024. 10.1117/1.3028012 (doi:10.1117/1.3028012) [DOI] [PMC free article] [PubMed] [Google Scholar]
- 46.Cerussi A., Siavoshi S., Durkin A., Chen C., Tanamai W., Hsiang D., Tromberg B. J.2009Effect of contact force on breast tissue optical property measurements using a broadband diffuse optical spectroscopy handheld probe Appl. Opt. 484270–4277. 10.1364/AO.48.004270 (doi:10.1364/AO.48.004270) [DOI] [PMC free article] [PubMed] [Google Scholar]
- 47.Chen J. H., Chang D., Nie K., Hsu F. T., Shih H. N., Hsu C. C., Nalcioglu O., Su M. Y.2009Comparison of breast density in the contralateral normal breast of patients with invasive and in situ breast cancer measured on MRI Ann. Oncol. 201449–1450. 10.1093/annonc/mdp361 (doi:10.1093/annonc/mdp361) [DOI] [PMC free article] [PubMed] [Google Scholar]
- 48.Curran-Everett D. Multiple comparisons: philosophies and illustrations. Am. J. Physiol. Regul. Integr. Comp. Physiol. 2000;279:R1–R8. doi: 10.1152/ajpregu.2000.279.1.R1. [DOI] [PubMed] [Google Scholar]
- 49.Dunnwald L. K., et al. 2008Tumor metabolism and blood flow changes by positron emission tomography: relation to survival in patients treated with neoadjuvant chemotherapy for locally advanced breast cancer J. Clin. Oncol. 264449–4457. 10.1200/JCO.2007.15.4385 (doi:10.1200/JCO.2007.15.4385) [DOI] [PMC free article] [PubMed] [Google Scholar]
- 50.Cerussi A. E., Tanamai V. W., Mehta R. S., Hsiang D., Butler J., Tromberg B. J.2010Frequent optical imaging during breast cancer neoadjuvant chemotherapy reveals dynamic tumor physiology in an individual patient Acad. Radiol 171031–1039. 10.1016/j.acra.2010.05.002 (doi:10.1016/j.acra.2010.05.002) [DOI] [PMC free article] [PubMed] [Google Scholar]
- 51.Sorensen A. G.2006Magnetic resonance as a cancer imaging biomarker J. Clin. Oncol. 243274–3281. 10.1200/JCO.2006.06.6597 (doi:10.1200/JCO.2006.06.6597) [DOI] [PubMed] [Google Scholar]
- 52.Smith J. J., Sorensen A. G., Thrall J. H.2003Biomarkers in imaging: realizing radiology's future Radiology 227633–638. 10.1148/radiol.2273020518 (doi:10.1148/radiol.2273020518) [DOI] [PubMed] [Google Scholar]
- 53.Tromberg B. J., Pogue B. W., Paulsen K. D., Yodh A. G., Boas D. A., Cerussi A. E.2008Assessing the future of diffuse optical imaging technologies for breast cancer management Med. Phys. 352443–2451. 10.1118/1.2919078 (doi:10.1118/1.2919078) [DOI] [PMC free article] [PubMed] [Google Scholar]
- 54.Kukreti S., Cerussi A. E., Tanamai W., Hsiang D., Tromberg B. J., Gratton E.2010Characterization of metabolic differences between benign and malignant tumors: high-spectral-resolution diffuse optical spectroscopy Radiology 254277–284. 10.1148/radiol.09082134 (doi:10.1148/radiol.09082134) [DOI] [PMC free article] [PubMed] [Google Scholar]