

Abstract
Nutrient absorption in the small intestine cannot occur until molecules are presented to the epithelial cells that line intestinal villi, finger-like protrusions under enteric control. Using a two-dimensional multiscale lattice Boltzmann model of a lid-driven cavity flow with ‘villi’ at the lower surface, we analyse the hypothesis that muscle-induced oscillatory motions of the villi generate a controlled ‘micro-mixing layer’ (MML) that couples with the macro-scale flow to enhance absorption. Nutrient molecules are modelled as passive scalar concentrations at high Schmidt number. Molecular concentration supplied at the cavity lid is advected to the lower surface by a lid-driven macro-scale eddy. We find that micro-scale eddying motions enhance the macro-scale advective flux by creating an MML that couples with the macro-scale flow to increase absorption rate. We show that the MML is modulated by its interactions with the outer flow through a diffusion-dominated layer that separates advection-dominated macro-scale and micro-scale mixed layers. The structure and strength of the MML is sensitive to villus length and oscillation frequency. Our model suggests that the classical explanation for the existence of villi—increased absorptive surface area—is probably incorrect. The model provides support for the potential importance of villus motility in the absorptive function of the small intestine.
Keywords: gastrointestinal, intestine, gut, absorption, villi, lattice Boltzmann method
1. Introduction
As the longest organ in the human gastrointestinal tract, the small intestine (gut) is where most of the nutrients from ingested food are absorbed to maintain the required energy balances in the body. Nutrient absorption relies on coupled multiscale transport and mixing processes that span several orders of magnitude. After the food is broken down, mixed and released to the duodenum by the stomach, the chyme is further mixed and transported in the gut lumen by patterned deformations (motility) of the intestinal wall at the lumen scale (approx. 1–2 cm) that result from neurologically controlled contractions of the circular and longitudinal muscle fibres within the muscularis propria. The outer layer of the human intestinal wall (mucosa) is folded and covered with absorptive finger- or leaf-like protuberances called villi which are 400–600 μm in length. The structure of a single villus is illustrated in figure 1a. Within each villus are capillaries and a central lacteal that carry away glucose and lipid nutrient molecules after diffusion and transport across the epithelial enterocytes that line the villi surfaces.
Figure 1.

(a) A single finger-like human villus (from DeSesso & Jacobson 2001). (b) The multiscale lattice numerical model for studying macro–micro-scale interactions: a two-dimensional lid-driven cavity flow with groupings of ‘villi’ at the lower surface. The fine lattice covers the villi while the coarse lattice covers the rest of the domain. (c) Specification of villi geometry and motion.
The common explanation for the existence of the villi is to increase the absorptive surface area by an order of magnitude. This is necessary to counterbalance the existence of what is commonly referred to as an ‘unstirred water layer’ (UWL; Barry & Diamond 1984)—a low-velocity fluid layer adjacent to the luminal surface through which nutrient molecules must diffuse before absorption is possible. There is strong evidence that the molecular transport of nutrient molecules through this diffusion-dominated layer to the epithelial surface is the rate-limiting step in absorption (Sallee & Dietschey 1973; Westergaard & Dietschy 1974; Dietschy & Westergaard 1975; Barry & Diamond 1984; Thomson & Dietschy 1984; Westergaard et al. 1986). A number of studies have attempted to estimate the UWL thickness, the effective thickness of the diffusion layer. Using ‘Michaelis–Menton’ kinetic theory (Thomson & Dietschy 1977; Thomson 1979) with permeability data obtained in vitro using rat and rabbit gut tissue and with strong stirring, UWL thicknesses have been estimated as high as 1000 μm in the dog (Frase et al. 1985; Thomson & Wild 2001). However, this is physiologically unrealistic. Using these values and a typical diffusivity of the order of 6×106 cm2 s−1 (Strocchi & Levitt 1991), straightforward scaling gives diffusion time scales far exceeding those in normal digestion, suggesting that the true in vivo UWL thickness is significantly smaller than the in vitro estimates. Using a different technique that they argued is more accurate, Strocchi & Levitt (1991) and Levitt et al. (1992) measured UWL thicknesses an order of magnitude smaller than previous estimates in the same animal. They go on to argue that ‘Although speculative, it seems possible that the thin, in vivo unstirred layer results from the contractions of the villi, a unique stirring mechanism that functions at the absorptive surface rather than in the centre of the lumen’.
As illustrated in figure 1a, each villus contains smooth muscle fibres that originate within the muscularis mucosae, a thin layer of smooth muscle integrated with a plexus of neurons, and under enteric neuromuscular control (King & Robinson 1945; DeSesso & Jacobson 2001; Wood 2004). The first study of villus motility in live animals was reported by Gruby & Delafond (1843), who observed shortening, lengthening and lateral movements of villi in gut segment exteriorized from a living animal (ex vivo). Since then, several types of villus motion have been documented ex vivo, including ‘wavy’ and ‘whip-like’ pendular motions and axial contractions (Hambleton 1914; King & Arnold 1922; Womack et al. 1987, 1989). Although Hambleton (1914) was the first to suggest that villi motion might enhance mixing, the low UWL thicknesses reported in vivo by Strocchi & Levitt (1991) and Levitt et al. (1992) are the strongest evidence for a local mixing mechanism that might result from villus motility. Furthermore, Strocchi et al. (1996) measured UWL thicknesses 7 times higher than normal in patients affected with celiac disease, a disorder characterized by villus atrophy and malabsorption. However, the details of villus motion in vivo, their space–time organizations, their responses to nutrient and other stimuli, and their potential for local mixing are unknown. This lack of knowledge reflects the lack of experimental technology available to quantify villi motion in vivo and the common acceptance of the untested explanation for the existence of villi as a passive mechanism to enhance absorption by increasing the absorptive surface area.
Here, we initiate an exploration into the hypothesis that villi motility exists as a mechanism to actively enhance the rate of absorption. We argue that if villi motility were to systematically enhance absorption, there would exist patterned motions of villi groupings on the mucosal surface that generate a micro-mixing layer (MML) to couple with outer macro-scale mixing flow eddies that are created by the patterned luminal contractions of the intestinal wall. This macro–micro coupling would be necessary to reduce the time scale for the transport of concentrations of nutrient molecules from the bulk flow to the epithelium. It is known that the enterically controlled villi motions respond differently to different local stimuli, so it is possible that specific patterns of villi motility are stimulated by transepithelial nutrient transport. The coupled macro–micro-scale advective motions, we hypothesize, increase the rate of nutrient transport to the epithelium and nutrient absorption to physiological levels. If true, it would follow that diseases that chronically suppress villi motility would be associated with malabsorption.
In the absence of direct quantification of villi motility in vivo, we begin this direction of enquiry with a simplified two-dimensional numerical model with the primary macro–micro interactions that we envision in intestinal nutrient transport and absorption. We analyse the consequences of systematic variations in villi motility parameters to the absorption rate and to the transport physics that underlie absorption rate. We employ the lattice Boltzmann method to predict fluid and molecule concentration transport with leaf-like villi under patterned group motion and zero-concentration boundary conditions on the ‘villi’ surfaces to simulate immediate nutrient uptake. Because the actual villi in the human intestine are finger-like structures in a variety of three-dimensional motions, we cannot expect to capture all the important flow physics that may be associated with macro–micro interactions in the human intestine in this study. This study is a first step in a longer-term effort to develop insight into the potential couplings between macro- and micro-scale transport processes that physical experiments are currently unable to provide. Our primary concerns in this study are (i) the generation of a MML by villi motions, (ii) the interaction between the MML and the outer macro-scale eddying motions in the transport of concentrations of nutrient molecules to the villi surface, and (iii) the consequences of macro–micro-scale interaction on absorption rate.
2. The numerical model
Owing to the complexity of full gut physiology and function, we constructed a highly simplified two-dimensional model that captures some basic macro–micro-scale interactions, which we hypothesize are involved in gut function. The numerical method is based on a multilattice Boltzmann formulation of the Navier–Stokes, continuity and passive scalar concentration equations in the low Mach number limit with second-order moving surface boundary conditions. We describe the model and summarize briefly the salient features of the lattice Boltzmann and multilattice numerics below. Complete details of the numerical method with validation tests are given in Wang et al. (2010).
(a). Physical model
As illustrated in figure 1b,c, we model a two-dimensional macro-scale lid-driven cavity flow with two-dimensional micro-scale finger-like ‘villi’ in pendular motion along the bottom surface. The villi are modelled as thin protrusions with round tips, and have dimensions typical of what is reported in the literature for the leaf-like rat villus. The upper lid moves with constant speed to create a large-scale eddy as a simplified model of the macro-scale luminal motions in the small intestine. Pendular motions of the villi have been observed by a number of authors (above); we model these as sinusoidal oscillatory motions of the villi tips (figure 1c). The villi are grouped and each group is made to oscillate sinusoidally 180° out of phase with its neighbouring groups. Nutrient molecular transport is modelled by passive scalar concentration with specified diffusivity. Zero-concentration boundary conditions are applied at the surfaces over and between the villi as a model of immediate nutrient absorption once nutrient molecules reach the villi surfaces. At the lid we specify a fixed concentration of 1 and zero flux is applied along the side walls. No-slip velocity boundary conditions are applied on all surfaces. The flow and concentration approach stationary states where field variables averaged over a period of villus oscillation become independent of time. All analysis is done in the stationary state.
We choose cavity characteristics roughly consistent with the macro-scales of the human jejunum: cavity length and height L×H=6 mm×3 mm and lid velocity Ulid=2 mm s−1. Although the viscosity of the chyme in the gut is variable, we use the viscosity and density of water at 20°C in our simulations as a base case. Thus, the macro-scale Reynolds number Rec=UlidH/ν=6. The Schmidt number of the modelled nutrient molecule concentration in chyme is 100. Although true Schmidt numbers are at least an order of magnitude higher, simulation is limited by the need to maintain reasonable space–time resolutions. However, the most important requirement is that Schmidt number be ≫1. The higher-than-normal diffusivities imply that the results obtained in this study are conservative in the sense that any advective effects on mixing that we uncover in this study are probably stronger in the gut.
In our simulations, the outer cavity variables are held fixed while we vary parameters associated with inner villi groupings and motion. To study sensitivity to villi length, the length of villi varied from ℓν=100–400 μm; the larger numbers are roughly consistent with human villi. The villus width and space between villi are fixed at w=66 μm. In order to compare systematically the influence of villi oscillation frequency, we fix the horizontal amplitude of oscillation, while the frequency of oscillation fν and the villus length ℓν are varied. That is, we specify (see figure 1c)
| (2.1) |
where  is fixed in this study. In our study we normalize the frequency of micro-scale villus tip motion with the characteristic inverse time scale of macro-scale eddying motion, fL=Ulid/Hc. In what follows we vary the villus-to-outer flow frequency ratio fν/fL and villus length ℓν.
(b). The lattice Boltzmann method
We briefly summarize our two-dimensional lattice Boltzmann model (LBM) here. Complete details and validation studies are given in Wang et al. (2010).
The two-dimensional LBM is an explicit two-dimensional finite difference representation of the continuous Boltzmann equation (Shan et al. 2006). The dependent variable is a discretized particle distribution function fα(x,t) that quantifies the probability of finding an ensemble of molecules at discretized positions x on a uniform square lattice at discretized time t with one of eight discretized finite velocities eα, α=1,…,8 that point to neighbouring nodes on the lattice, or a zero velocity α=0. |eα|=1 between lattice nodes perpendicular to the cell surface and  between corner nodes (D2Q9 model). Continuum-level velocity u(x,t) and density ρ(x,t) are obtained from moments of fα(x,t). The LBM is inherently compressible with pressure proportional to ρ.
The lattice Boltzmann equation with the standard ‘Bhatnagar–Gross–Krook’ (Bhatnagar et al. 1954) representation for the collision operator is (Chen & Doolen 1998)
| (2.2) |
where δt≡1. The LHS of equation (2.2) is ‘streaming’, the exchange of momentum between neighbouring nodes as a result of bulk advection and molecular diffusion, while the RHS describes the molecular mixing, or ‘collision’ of molecules that move the local state towards an equilibrium particle distribution,  with relaxation time scale τ that is related to the fluid kinematic viscosity, ν. In the low Mach number limit, the equilibrium distribution function is strictly a function of fluid density ρ(x,t) and velocity u(x,t) at the continuum level (Chen & Doolen 1998):
 |
(2.3) |
where wα are weighting functions specific to the D2Q9 formulation.
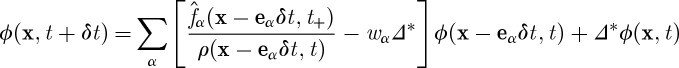
We use passive scalar concentration to model transport and absorption of nutrient molecules at the continuum level. We solve for the concentration ϕ(x,t) using the ‘moment propagation method’ developed by Frenkel & Ernst (1989) and improved by Merks et al. (2002), whereby ϕ(x,t) is transported and diffused at the continuum level along with the particle distribution function:
 |
(2.4a) |
and
| (2.4b) |
where Dm is the mass diffusivity, c is the lattice speed and δx is the lattice spacing.
At the boundaries we apply second-order boundary conditions for fα(x,t) developed by Mei et al. (1999) and Lallemand & Luo (2003) which apply ‘bounce-back’ with interpolation to the boundary surface. At moving boundaries an additional term developed by Ladd (1994) is used to take into account the momentum added by the moving surface (Bouzidi et al. 2001). We developed similar second-order boundary conditions for zero concentration and zero concentration flux at the boundaries (Wang et al. 2010).
The two-dimensional LBM requires a uniform square lattice. To resolve the micro-scale villi-driven flow with a lattice that is finer than the macro-scale outer flow, we apply the multilattice strategy developed by Filippova & Hanel (1998) and Yu et al. (2002) where the computational domain is decomposed into subdomains each with different lattice resolution. To maintain continuity of viscosity across the lattices, the relaxation times on the fine lattice (τf) and coarse lattice (τc) are related by
| (2.5) |
where m=δxc/δxf is the ratio of the lattice spacing between the two lattices.
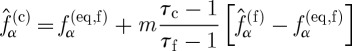
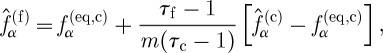
Between the neighbouring lattices, there is an overlap of one coarse lattice unit. To maintain continuity of density and momentum in the overlap region, the equilibrium distribution functions of neighbouring lattice systems must be the same at the interface between the coarse and fine lattices, and to maintain continuity of viscous stress, the transfer of the post-collision distribution functions between the two lattices is given by
 |
(2.6) |
and
 |
(2.7) |
where  is the post-collision particle distribution function.
In the overlap region, the boundary of the coarse lattice is within the fine lattice and vice versa. Where the two lattices overlap there are m fine lattices for each coarse lattice, so that spatial interpolation is necessary to transfer data from the coarse to fine lattices. The time for particles to travel one lattice distance on the coarse lattice is m times greater than that on the fine lattice. Thus, each time advance on the coarse lattice required m time advances on the fine lattice.
The cavity was covered by a uniform coarse lattice of 120×60 lattice nodes, except around villi where the fine lattice is applied (figure 1b) with lattice ratio m=11, chosen so that there would be more than 10 lattice nodes over a villus thickness w.
3. Analysis of macro–micro–scale interactions in molecule absorption
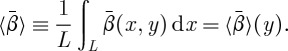
In the long time limit, the cavity flow becomes stationary and all variables β(x,y,t) averaged over a period of villus motion become independent of time:
 |
(3.1) |
The time-averaged variable  averaged again over horizontal planes depends only on the vertical coordinate, y:
 |
(3.2) |
Molecules are transferred from the source in the lid (representing bulk nutrient molecule concentration) to the lower villi-covered surface where they are absorbed at the rate  (per unit depth). The vertical flux of molecules is a summation of molecular diffusion and advection by local vertical velocity υ. In the stationary limit, the total flux of molecules towards the lower surface, averaged in time and across horizontal planes, is independent of y and is proportional to
  :
:
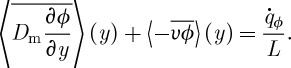 |
(3.3) |
In what follows, we examine the relationships between vertical flux of molecules from molecular diffusion and advection arising from interactions between the outer macro-scale flow generated by the moving lid and the inner micro-scale flow generated by the moving villi.
(a). Overview of macro–micro-scale interactions and the MML
Figure 2 gives an overview of the macro–micro-scale interactions that will be examined in detail. In this simulation the upper lid moves as described in §2a, the villus length is ℓν=200 μm and the villus-to-outer scale frequency ratio is fν/fL=40. We analyse the flow in the stationary state.
Figure 2.
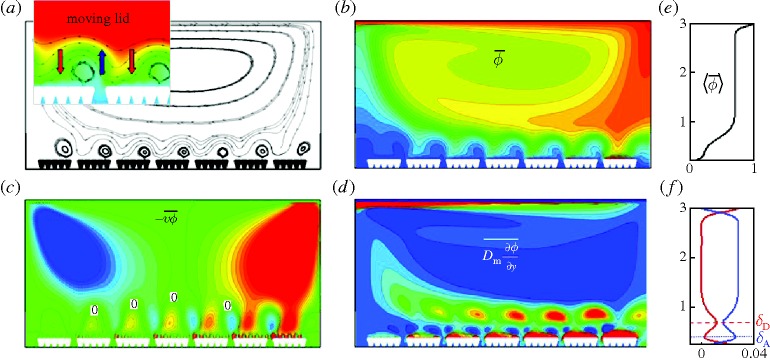
Fields averaged over one period of villi motion with moving lid. (a) Streamlines. (b) Isocontours of the molecular concentration field. (c) Vertical concentration flux by advection. (d) Vertical concentration flux by diffusion. (e) and (f) show time-averaged fluxes averaged again over horizontal planes: (e) concentration, (f) vertical concentration flux by advection (blue) and by diffusion (red). Flux is defined positive from the outer flow towards the villi. In the isocontours, high or positive values are red while low or negative values are blue. Zero values in (c) and (d) are green. The inset in (a) shows average streamlines overlayed with concentration isocontours. Villus length ℓυ=200 μm and villus frequency ratio fν/fL=40.
The time-averaged streamline patterns of figure 2a show both a macro-scale outer eddy formed by the moving lid, and micro-scale eddies generated by the oscillatory motions of the two-dimensional villi. Comparing with the concentration field in figure 2b, it is apparent that the outer eddy enhances the diffusive flux of molecules by advecting high concentration fluid at the lid to the lower surface where the molecules come into contact with the villi-induced micro-scale eddies. We also observe the presence of low concentration fluid between and on the right side of villi groups. Relatively higher concentrations exist on the left side of the villi groups with low concentration adjacent to the villi surfaces from immediate absorption. Compare the concentration and streamline fields, shown together in the inset to figure 2a. We observe that, on average, an upward flow is produced between the villi groups that carries low molecular concentrations vertically. This villi-driven upward flow interacts with the outer eddy creating an average streamline pattern that drives higher concentration fluid originating in the outer flow towards the villi on the downstream sides of the villi groups. Tentatively, it appears that lower concentration fluid is forced upward by the flow between villi groups while higher concentration fluid is forced downward over the villi by the interaction between micro- and macro-scale flows. The layer adjacent to the villi surface over which this macro–micro-scale interaction takes place is what we refer to as the MML.
Consistent with the conclusion above, figure 2c shows that in the MML the time-averaged advective flux in the micro-flow is from the outer flow towards the villi in the regions over the villi groups and from the inner flow towards the bulk flow in the gaps between the villi groups. This pattern is modulated by a macro-scale flux from the bulk flow towards the villi on the right (red isocontours) and from the villi to the bulk flow on the left (blue isocontours), enhancing transport to/from the villi in the downward/upward flow regions of the macro-scale eddy, respectively. What is particularly interesting, however, is the comparison between diffusive flux in figure 2d and advective flux in figure 2c. Whereas advection-dominated micro-scale eddies are generated just above the villi, diffusion-dominated eddies are formed in the layer just above that. Whereas the advective flux is of both signs, the diffusive flux is fully downward, and is concentrated above and between the upward/downward advective eddies that are induced by the oscillatory motion of the villi.
When averaged over horizontal planes, the summation of diffusive and advective fluxes is independent of y (equation (3.3)). However, as shown in figure 2f, there is a tradeoff between advective and diffusive flux that is associated with macro–micro-scale interactions. In this flow, advective flux is overall larger than diffusive flux everywhere except in a diffusion-dominated ‘unstirred water layer’ (UWL) adjacent to the villi surfaces (red concentration in figure 2d), and adjacent to the upper lid source. Advective flux peaks in a layer just above the UWL, while a peak in diffusive flux occurs in a layer just above that.
We define the y locations of the peaks in advective and diffusive fluxes, relative to the top of the villi surface, as δA and δD, respectively. Figure 2e shows how the vertical mean concentration gradient is larger in a transitional layer between a micro-scale mixed layer below and a mixed layer above associated with the macro-scale outer flow from the outer-scale eddying motion. The thickness of the region of influence of the MML appears to scale as δD.
(b). The micro-mixing layer
In figure 3, we illustrate two related phenomena associated with the MML. Consider the time evolution of instantaneous streamlines in figure 3a. Where villi groups are moving together, mass conservation forces fluid out from the gaps between the groups, creating vertical jets that scale on the gap in width. At the same time, where the groups move apart fluid is forced into the gaps. The combination creates a single eddy over each villus group at each instant in time. However, the strengths of the eddies vary with time so that, as shown in figure 2a, on average the outward-directed motions are stronger than inward motions and the average flow is outward in each gap with a single eddy that is distorted by interaction with the macro-scale bulk flow.
Figure 3.
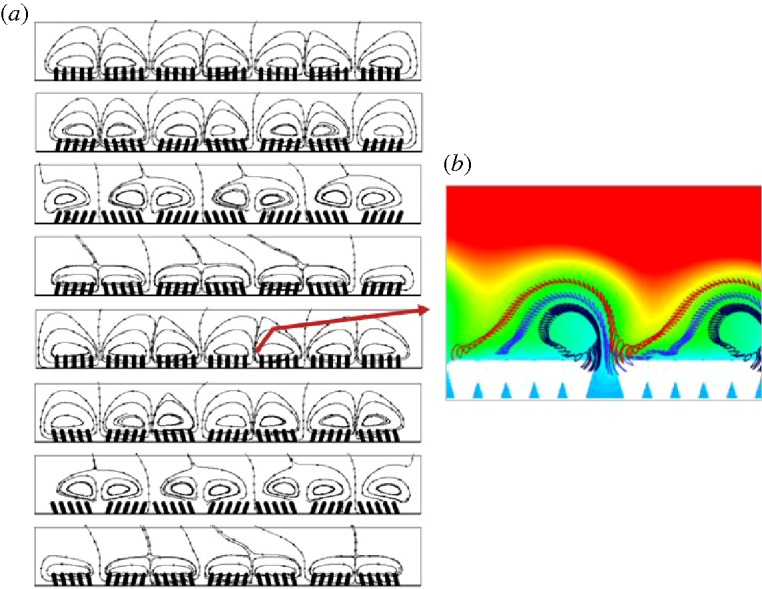
(a) Instantaneous streamlines in the micro-mixing layer at discrete time instants over one period of villi oscillation. (b) Particle trajectories over about 50 periods of villi oscillation overlayed with particle concentrations averaged over one period.
As a consequence of the above, the pathlines of figure 3b are consistent with the average streamline pattern of figure 2a. The particle trajectories show clearly how the MML interacts with the outer macro-scale flow and concentration fields. Fluid particles originating between villi groups are ultimately forced vertically. However, one observes from the dark blue pathlines that fluid particles are sucked into the gap as well. After several periods, the particles move vertically, and as the particles move away from the gaps and over the villi groups, the vertical oscillations in particle motion transition to horizontal oscillatory motions with the villi tips.
The fluid particles are at low concentration when they leave the UWL where rapid absorption across the villi surfaces has depleted this region of molecules. As they move into the higher concentration fluid driven towards the villi by the macro-scale eddy, their concentrations increase by local diffusion. In this flow, it took roughly 15 periods of villi oscillation for fluid particles to reach their apogee before being driven towards the villi tips by a combination of the micro-scale eddying motions and interaction with the macro-scale outer flow. The fluid particles eventually make their way to the downstream gap between villi groups where the process repeats itself, albeit at lower concentrations due to overall depletion of molecules in the macro-scale eddy by absorption. For the combination of inner and outer flow parameters in this simulation, the fluid particles passed from one gap to the next over approximately 50 periods of villi motion. We conclude that the enhancement of absorption from villi motion requires time scales of the order of the large-eddy time scale, H/Ulid.
The MML is formed, in part, by the interaction of the outer macro-scale eddying motions that, in the gut, are generated by the contractions of the wall muscle layer (muscularis propria) and the inner micro-scale motions of the villi (controlled from within the muscularis mucosae). To develop additional insight into this coupling, compare figure 2 with an equivalent simulation in figure 4 with the upper surface fixed, thus removing the influence of the outer macro-scale eddy. Immediately apparent from figure 4b,e is the absence of an outer macro-scale mixed layer; the outer region is fully diffusive. More interesting is figure 4a which shows that, in the absence of an interaction with an outer advection-dominated mixing flow, the time-averaged MML consists of pairs of micro-scale eddies over each villi group. Comparison with figure 2a indicates that, when the outer eddy is sufficiently strong, macro–micro-scale interactions suppress the co-rotating micro-scale eddies while enhancing the counter-rotating eddies. The consequence is that the transport of higher-concentration fluid to the villi surface by the micro-scale motions is enhanced and shifted from the centre of the villi groups to the downstream side by the macro-scale eddies.
Figure 4.
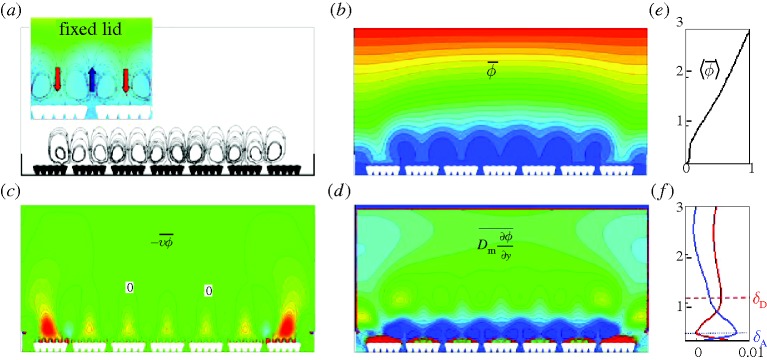
Fields averaged over one period of villi motion with fixed lid. (a) Streamlines. (b) Isocontours of the molecular concentration field. (c) Vertical concentration flux by advection. (d) Vertical concentration flux by diffusion. (e) and (f) show time-averaged fluxes averaged again over horizontal planes: (e) concentration, (f) vertical concentration flux by advection (blue) and by diffusion (red). Flux is defined positive from the outer flow towards the villi. In the isocontours, high or positive values are red and low or negative values are blue. Zero values in (c) and (d) are green. The inset in (a) shows average streamlines overlayed with concentration isocontours. Villus length ℓν=200 μm. Villus frequency is the same as in figures 2 and 3.
Perhaps more important from a functional perspective is the comparison of parts (c), (d) and (f) in figures 4 and 2. Whereas the advective component of the MML is relatively unaffected by the lack of the outer macro-scale eddy—the location of peak advective flux δA is unchanged—the outer margin of the MML, as defined by peak diffusive flux δD, is nearly twice what it was in the presence of an outer-scale eddy. Furthermore, the strengths of the advective and diffusive eddies are much reduced: the inclusion of an outer macro-scale eddy within the MML increases the absorption rate by a factor of 3.6. Thus, the macro–micro-scale interactions force the MML closer to the villi, increase the concentration gradient at the villi surface, enhance the flux of molecules to the lower surface, and increase the rate of absorption.
(c). The effect of the MML on the unstirred water layer and absorption rate
In the simulation discussed in figures 1–4 we find that, compared with no mixing motions of any kind, macro or micro (i.e. pure diffusion), the existence of the macro-scale eddy in the absence of the MML increases the absorption rate by a factor of 5 while the addition of the MML together with the macro-scale eddy increases the absorption rate by a factor of 8. Thus, whereas both the macro-scale and micro-scale motions enhance absorption rate, the interaction between the two can provide major additional increases in the effectiveness of absorption. With our two-dimensional model and with the parameters explored thus far, advective flux is the dominant contributor to the absorption of molecules at the villi surface. However, the generation of a MML by villi motility increases both advective and diffusive contributions to flux. Here, we explore variations in villi motility parameters in the structure of the MML and enhancement of absorption by the MML.
In figure 5, we plot the time–space averages of concentration together with the relative contributions to molecule concentration flux towards the villi from diffusion and advection over a range of villi-to-outer flow frequency ratios and villi lengths. Note that the plots are a function of distance from the villi surface, so that as villus length is increased in figure 5d–f, the distance to the lid decreases. We can immediately draw several general conclusions from figure 5. Interestingly, increasing either villus frequency or villus length, while maintaining the outer macro-scale flow the same, changes the MML and macro–micro-scale interactions in similar ways. As both increase, the following changes take place: (i) what, at low frequencies and villus lengths, was a diffusion-dominated layer with monotonic decrease in mean concentration adjacent to the villus surface transitions to a mixed layer with progressively more uniform concentration, higher levels of advective flux and lower levels of diffusive flux, (ii) diffusive flux in the macro-scale region does not change, while advective flux progressively increases, driving molecules from the bulk flow to the villi at a more rapid rate and increasing absorption, and (iii) whereas the strength of the advection-dominated sublayer within the MML increases, its depth does not change significantly while the total MML thickness, defined by the peak in diffusive flux between the macro- and micro-scale flow regions, increases. Thus, as the frequency of oscillation of the villi or as the length of the villi increase, not only does the eddy strength and advective flux increase, driving molecule concentration towards the villi surface at a more rapid rate, the region of influence of the MML also grows, extending deeper into the higher concentration fluid within the macro-scale flow. Figure 5 suggests that significant influence of the MML on concentration flux may not be apparent until the frequency ratio fν/fL exceeds 10–20 and the villus length exceeds 100–200 μm.
Figure 5.

Fields averaged over one period of villi oscillation and over horizontal planes with moving lid. (a,d) Concentration. (b,e) Concentration flux by diffusion. (c,f) Concentration flux by advection. (a–c) Varying frequency ratio fν/fL for fixed ℓν=200 μm. (d–f) Varying villus length ℓυ for fixed frequency ratio fν/fL=40.  . (a–c) Solid line, fν/fL=0; spaced-dashed line, fν/fL=10; dashed-dotted line, fν/fL=20; dashed-double-dotted line, fν/fL=30; long-dashed line, fν/fL=40. (d–f) Solid line, ℓν=0 μm; spaced-dashed line, ℓν= 100 μm; dashed-dotted line, ℓν=200 μm; dashed-double-dotted line, ℓν=300 μm; long-dashed line, ℓν=400 μm.
The variations above are shown explicitly in figure 6 where variables relevant to absorption are plotted as a function of villus length and frequency. In figure 6a we plot the enhancement in absorption rate as a result of villi-induced micro-scale mixing, where we non-dimensionalize with  , the absorption rate at zero villus length with surface motion defined as per the RHS of equation (2.1). The result for frequency ratio 0 in figure 6a (solid line) is particularly important. We learn that, contrary to the commonly stated explanation for the existence of villi in the gastrointestinal tract as an enhancer of absorption simply by increasing the exposed surface area of the gut, the existence of villi in the absence of motion does very little to increase the rate of nutrient absorption at the villi surface. At a villus length of 400 μm, the increase in absorption rate is only 7 per cent. However, when the villi are in motion the enhancement can be substantial. Figure 6a suggests that when villus length exceeds 100–200 μm, the absorption rate is sensitive to villus length.
Figure 6.

Enhancement of absorption rate and alteration of the UWL (diffusion layer) with increasing villus length for various oscillation frequencies. (a) Increase in scalar absorption rate relative to absorption with zero villus length. (b) Reduction in UWL thickness. (c) Changes in distance to the centre of the outer diffusion layer δD (upper three curves, filled circles) and to the centre of advection layer δA (lower three curves, open circles). (d) Relative contribution of vertical flux from advection to total absorption rate in the inner advection-dominated layer (upper three curves, filled circles) and in the outer micro–macro interaction layer (lower three curves, open circles). (Open circle with solid line, fν/fL=0; open circle with dashed line, fν/fL=10; open circle with dashed-dotted line, fν/fL=20; open circle with dashed-double-dotted line, fν/fL=30; open circle with long-dashed line, fν/fL=40.)
The enhanced absorption rate with villi motion suggests a reduction in the UWL thickness, as hypothesized by Levitt et al. (1992). This is shown explicitly in figure 6b, where the UWL is defined as an effective diffusion layer thickness:
 |
(3.4) |
where ϕbulk is the average concentration in the cavity. δUWL is an effective measure of the thickness of the red isocontours and high diffusive flux layer adjacent to the villi surface in figure 2d,f, respectively. Figure 6b shows that the UWL thickness decreases substantially as villus length and villus frequency increase. Figure 6c shows quantitatively that, whereas the thickness of the advection-dominated portion of the MML (δA) is relatively insensitive to villus length and frequency, the overall region of influence of the MML (δD) grows with increasing length and frequency of villus oscillation.
In addition, in figure 6d we plot the ratio of advective to total flux,
 |
(3.5) |
in the advective (filled circles) and diffusive (open circles) regions of the MML separately. Figure 6d shows that Rϕ increases in both regions as villus length and frequency increase. We conclude that the enhancement of absorption rate from macro–micro-scale interactions results from a major enhancement of both advective and diffusive contributions to molecular concentration flux, as well as through the extension of the MML into the region of higher molecular concentration associated with macro-scale transport from the bulk flow to near the villi surface.
4. Discussion
Nutrient molecules are absorbed in the small intestine at a mucosal epithelium that covers multitudes of villi: finger- and leaf-like protrusions approximately 400–600 μm in length that cover the mucosal surface. The villi have been observed to move in response to local stimuli. Luminal contractions (macro-scale motility) create macro-scale fluid motions that transport nutrient molecules to the epithelium. We hypothesize that enterically controlled micro-scale motility of the villi is stimulated by the presence of nutrient molecules to create coherent oscillatory motions of the villi tips to generate micro-scale fluid motions that interact with the macro-scale outer flow to shorten the time scale of absorption in the small intestine to physiological values.
It is currently not possible to explore the hypothesis above in vivo, given the lack of technology available to quantify villi motion. All knowledge of villi motion to date has been obtained ex vivo, by opening the gut of an animal and observing the villi with a microscope while stimulating the mucosa with pressure, acid, nutrient, etc. Whereas these highly obtrusive experiments have confirmed that the villi move and respond to local stimuli consistent with enteric control, there is no quantification of the motions of the villi in vivo, or the coordinated motions of groups of villi in response to nutrient stimuli. We therefore initiate an analysis of the potential role of villus motility in gut absorptive function using computer modelling.
We have previously developed models of the macro-scale flow in the intestine from peristaltic and segmental motility (Banco et al. 2009) and have quantified macro-scale motility in the rat intestine with magnetic resonance imaging (Ailiani et al. 2009). Here we consider the micro-scale flow driven by villi motion and begin an analysis into macro–micro-scale interactions that may influence gut absorption. We do this with a simplified two-dimensional model that captures the essential features of villi–lumen scale interactions in the intestine. The model is a two-dimensional cavity with an outer scale eddy motion driven by a moving lid and a source for passive scalar concentration as a model of nutrient molecule transport and absorption. The lower surface of the cavity is lined with two-dimensional ‘villi’ in oscillatory pendular motion with systematically varying length and frequency. A multilattice Boltzmann algorithm was used to calculate the macro–micro-scale fluid motions, advective and molecular and transport of concentration from the source at the upper lid to the lower surface villi, and the interactions between the macro- and micro-scale motions induced by specified villus motions. The numerical details of the lattice Boltzmann model are given by Wang et al. (2010).
The common explanation for the existence of villi in the gastrointestinal tract is that absorption is enhanced passively by an order of magnitude increase in surface area (e.g. Magee et al. 1986). We show with our model that this is not necessarily the case and may be incorrect. The increase in absorption rate in the presence of fixed unmoving villi is predicted to be small, a few percent at best. The reason is because the villi are packed closely and the fluid between villi is nearly stagnant so nutrient molecules can only penetrate this fluid by molecular diffusion. Therefore, relative to the tips, the sides of the villi are not exposed to high molecular concentrations of nutrients.
We have found that even when there is motion, most of the scalar absorption is over the tips of the villi (plot not presented due to space limitations). In particular, over the villi lengths simulated (100–400 μm), when the villi were stationary, 81–82% of the absorption rate was through the villi tips, and at the highest frequencies, the percentage of absorption rate reduced slightly to 76–81%. These high percentages of absorption at the tips are even more significant when one recognizes that the tips occupy only 11–33% of the total absorptive surface area for villi lengths of 400–l00 μm, respectively.
We show here that vertical pumping between groups of villi, and interactions between the inner MML and the outer macro-scale motions create flow patterns that move low-concentration fluid particles from the gaps between villi groups vertically, putting low-concentration fluid in contact with high-concentration fluid that was transported from the bulk flow by the macro-scale eddying motion. Having absorbed molecules from the macro-scale eddy by diffusion, the high concentration fluid particles are subsequently transported by the MML to the tops of the villi surfaces. As a result of these macro–micro-scale interactions, absorption rate can be significantly enhanced as compared with macro-scale motility and mixing alone. We find that the degree of increased absorption rate is sensitive to villus length when the length exceeds 100–200 μm, and that the enhancement requires villus oscillations at frequency ratios of 10 or more relative to macro-scale eddy time scales. Absorption enhancement is correspondingly associated with a reduction in the thickness of the UWL, the high diffusion layer next to the villi surfaces in which fluid motions are suppressed by friction. Our results therefore support the conjecture by Levitt et al. (1992) that ‘the villi [provide] a unique stirring mechanism that functions at the absorptive surface’.
The manner in which the micro- and macro-scale flows interact is particularly interesting. In the absence of outer macro-scale eddies, the MML is far less effective in enhancing absorption, while the enhancement of absorption by the MML in the presence of macro-scale transport is quite significant. We find that an advection-dominated micro-scale mixed layer is formed just above the UWL. The advective motions within the MML do not integrate smoothly into the advection-dominated macro-scale eddying motions. The large difference in scale between the inner and outer mixing motions causes another diffusion layer to be created between the micro-scale advective motions of the MML and the outer macro-scale eddy. This diffusion layer marks the upper margin of the MML; that is, its region of influence. We find that both the strength and the region of influence of the MML increase with villus length and oscillation frequency. This increased region of influence allows low concentration fluid particles to penetrate more deeply into the outer macro-scale eddy and capture molecules from within the higher concentration fluid more effectively by diffusion. After the fluid particles increase in concentration as a result of diffusion from high concentration fluid at the upper margins of the MML, they are subsequently transported back to the epithelial surface lining the villi by the fluid motions within the MML. The nutrient molecules thus transported are then released into the epithelial cells, enhancing overall absorption rate.
Space restrictions do not allow the presentation of another significant result. We have carried out simulations with different villi groupings that suggest the existence of optimal groupings of villi. Because the micro-scale eddy is formed by the interaction between micro-scale pumping between villi groups and the outer macro-scale eddying motions, and because the structure of the MML underlies enhanced absorption, we find that groupings that contain too many villi are suboptimal, as are groupings that contain too few. It is possible, therefore, that villi motility may be associated with optimal groupings that depend on specific couplings between macro- and micro-scale motions induced by macro-scale motility at the lumen scale and micro-scale motility at the villi scale.
There is no knowledge of the detailed manner in which villi move in vivo, their coherence, or their groupings. All that is known is from ex vivo observations of exteriorized gut in living animals. In the absence of direct observation, the current study indicates that there would be an advantage to coherent motions of villi groups at the mucosal surface and provides motivation both for additional modelling studies and for the development of experimental methods to see villi motion in vivo in the natural setting.
It should be kept in mind that the results and conclusions of this work were obtained using a two-dimensional model. Significant new mechanics can be expected from a fully three-dimensional model in which the villi are separated and move in two directions along a planar surface. Nevertheless, the more important features of the MML—its interaction with the outer macro-scale flow and the consequent enhancement of advective flux and absorption rate—are expected to be present in three-dimensional models. We are in the process of carrying out three-dimensional simulations that shall be reported in the future. The current study has produced new insight that can be applied in future explorations for technology to quantify villus micro-motility in vivo and its role in digestion.
Acknowledgements
We gratefully acknowledge support from the US National Science Foundation under grant CTS-056215. This research programme was within the Microscale Modeling (MSM) consortium under the multi-agency Interagency Modeling and Analysis Group (IMAG) that spanned the following US funding agencies: NIH, NSF, NASA, DOE, DOD and USDA.
Footnotes
One contribution of 13 to a Theme Issue ‘The virtual physiological human: computer simulation for integrative biomedicine II’.
References
- Ailiani A. C., Neuberger T., Brasseur J. G., Banco G., Wang Y., Smith N. B., Webb A. G. Quantitative analysis of peristaltic and segmental motion in-vivo in the rat small intestine using dynamic MRI. Magn. Reson. Med. 2009;62:116–126. doi: 10.1053/j.gastro.2004.02.017. ( ) [DOI] [PubMed] [Google Scholar]
- Banco G., Brasseur J., Wang Y., Ailiani A., Neuberger T., Web A. The relation between peristaltic and segmental contraction, mixing, and absorption in the small intestine. Bull. Am. Phys. Soc. 2009;54:271. [Google Scholar]
- Barry P. H., Diamond J. M. Effects of unstirred layers on membrane phenomena. Physiol. Rev. 1984;64:763–872. doi: 10.1152/physrev.1984.64.3.763. [DOI] [PubMed] [Google Scholar]
- Bhatnagar P. L., Gross E. P., Krook M. A model for collision processes in gases. I. Small amplitude processes in charged and neutral one-component system. Phys. Rev. 1954;94:511–525. doi: 10.1103/PhysRev.94.511. ( ) [DOI] [Google Scholar]
- Bouzidi M., Firdaouss M., Lallemand P. Momentum transfer of a lattice Boltzmann fluid with boundaries. Phys. Fluids. 2001;13:3452–3459. doi: 10.1063/1.1399290. ( ) [DOI] [Google Scholar]
- Chen S., Doolen G. D. Lattice Boltzmann method for fluid flows. Annu. Rev. Fluid Mech. 1998;30:329–364. doi: 10.1146/annurev.fluid.30.1.329. ( ) [DOI] [Google Scholar]
- DeSesso J. M., Jacobson C. F. Anatomical and physiological parameters affecting gastrointestinal absorption in humans and rats. Food Chem. Toxicol. 2001;39:209–228. doi: 10.1016/S0278-6915(00)00136-8. ( ) [DOI] [PubMed] [Google Scholar]
- Dietschy J. M., Westergaard H. Intestinal absorption and malabsorption. New York, NY: Raven Press; 1975. The effect of unstirred water layers on various transport processes in the intestine; pp. 197–207. [Google Scholar]
- Filippova O., Hanel D. Grid refinement for lattice-BGK models. J. Comput. Phys. 1998;147:219–228. doi: 10.1006/jcph.1998.6089. ( ) [DOI] [Google Scholar]
- Frase L. L., Strickland A. D., Kachel G. W., Krejs G. J. Enhanced glucose absorption in the jejunum of patients with cystic fibrosis. Gastroenterology. 1985;88:478–484. doi: 10.1016/0016-5085(85)90510-4. [DOI] [PubMed] [Google Scholar]
- Frenkel D., Ernst M. H. Simulation of diffusion in a two-dimensional lattice-gas cellular automation: a test of mode-coupling theory. Phys. Rev. Lett. 1989;56:2165–2168. doi: 10.1103/PhysRevLett.63.2165. ( ) [DOI] [PubMed] [Google Scholar]
- Gruby D., Delafond H. M. O. Recherches sur les animalcules se developpant en grand nombre dans l’estomac et dans les intestines, pendant la digestion des animaux herbivores et carnivores. C. R. Acad. Sci. Paris. 1843;17:1304–1308. [Google Scholar]
- Hambleton B. F. Note upon the movements of the intestinal villi. Am. J. Physiol. 1914;34:446–447. [Google Scholar]
- King C. E., Arnold L. The activities of the intestinal mucosal motor mechanism. Am. J. Physiol. 1922;59:97–121. [Google Scholar]
- King C. E., Robinson M. H. The nervous mechanisms of the muscularis mucosae. Am. J. Physiol. 1945;143:325–335. [Google Scholar]
- Ladd A. J. C. Numerical simulations of particulate suspensions via a discretized Boltzmann equation. Part 1. Theoretical foundation. J. Fluid Mech. 1994;271:285–309. doi: 10.1017/S0022112094001771. ( ) [DOI] [Google Scholar]
- Lallemand P., Luo L. Lattice Boltzmann method for moving boundaries. J. Comput. Phys. 2003;184:406–421. doi: 10.1016/S0021-9991(02)00022-0. ( ) [DOI] [Google Scholar]
- Levitt M. D., Strocchi A., Levitt D. G. Human jejunal unstirred layer: evidence for extremely efficient luminal stirring. Am. J. Physiol. 1992;262:G593–G596. doi: 10.1152/ajpgi.1992.262.3.G593. [DOI] [PubMed] [Google Scholar]
- Mei R., Luo L., Shyy W. An accurate curved boundary treatment in the lattice Boltzmann method. J. Comput. Phys. 1999;155:307–330. doi: 10.1006/jcph.1999.6334. ( ) [DOI] [Google Scholar]
- Magee D. F., Dalley A. F., II, Omaha N. Digestion and the structure and function of the gut. Basel, Switzerland: Friedrich Reinhardt; 1986. ch. 10. [Google Scholar]
- Merks R. M. H., Hoekstra A. G., Sloot P. M. A. The momentum propagation method for advection–diffusion in the lattice Boltzmann method: validation and Peclet number limits. J. Comput. Phys. 2002;183:563–576. doi: 10.1006/jcph.2002.7209. ( ) [DOI] [Google Scholar]
- Sallee V. L., Dietschy J. M. Determinants of intestinal mucosal uptake of short- and medium-chain fatty acids and alcohols. J. Lipid Res. 1973;14:475–484. [PubMed] [Google Scholar]
- Shan X., Yuan X., Chen H. Kinetic theory representation of hydrodynamics: a way beyond the Navier–Stokes equations. J. Fluid Mech. 2006;550:413–441. doi: 10.1017/S0022112005008153. ( ) [DOI] [Google Scholar]
- Strocchi A., Levitt M. D. A reappraisal of the magnitude and implications of the intestinal unstirred layer. Gastroenterology. 1991;101:843–847. doi: 10.1016/0016-5085(91)90548-y. [DOI] [PubMed] [Google Scholar]
- Strocchi A., Corazza G., Furne J., Fine C., Sario A. D., Gasbarrini G., Levitt M. D. Measurements of the jejunal unstirred layer in normal subjects and patients with celiac disease” Am. J. Physiol. Gastrointest. Liver Physiol. 1996;270:G487–G491. doi: 10.1152/ajpgi.1996.270.3.G487. [DOI] [PubMed] [Google Scholar]
- Thomson A. B. R. Limitations of Michaelis–Menton kinetics in presence of intestinal unstirred layers. Am. J. Physiol. 1979;5:E701–E709. doi: 10.1152/ajpendo.1979.236.6.E701. [DOI] [PubMed] [Google Scholar]
- Thomson A. B. R., Dietschy J. M. Derivation of the equations that describe effects of unstirred water layers on the kinetic parameters of active transport processes in the intestine. J. Theor. Biol. 1977;64:277–294. doi: 10.1016/0022-5193(77)90357-5. ( ) [DOI] [PubMed] [Google Scholar]
- Thomson A. B. R., Dietschy J. M. The role of the unstirred water layer in intestinal permeation. Handbook Exp. Pharmacol. 1984;70:165–259. [Google Scholar]
- Thomson A. B. R., Wild G. The influence of the intestinal unstirred water layers on the understanding of the mechanisms of lipid absorption. In: Mansbach C. M. II, Tso P., Kuksis A., editors. Intestinal lipid metabolism. Dordrecht, The Netherlands: Kluwer; 2001. pp. 135–152. [Google Scholar]
- Wang Y., Brasseur J. G., Banco G. G., Webb A. G., Ailiani A. C., Neuberger T. Development of a lattice-Boltzmann method for multiscale transport and absorption with application to intestinal function. In: De S., Guilak G., Mofrad M. R. K., editors. Computational modeling in biomechanics. New York, NY: Springer; 2010. pp. 69–98. [Google Scholar]
- Westergaard H., Dietschy J. M. Delineation of the dimensions and permeability characteristics of the two major diffusion barriers to passive mucosal uptake in the rabbit intestine. J. Clin. Invest. 1974;54:718–732. doi: 10.1172/JCI107810. ( ) [DOI] [PMC free article] [PubMed] [Google Scholar]
- Westergaard H., Holtermuller K. H., Dietschy J. M. Measurement of resistance of barriers to solute transport in vivo in rat jejunum. Am. J. Physiol. Gastrointest. Liver Physiol. 1986;250:G727–G735. doi: 10.1152/ajpgi.1986.250.6.G727. [DOI] [PubMed] [Google Scholar]
- Womack W. A., Barrowman J. A., Graham W. H., Benoit J. N., Kvietys P. R., Granger W. H. Quantitative assessment of villus motility. Am. J. Physiol. 1987;252:G250–G256. doi: 10.1152/ajpgi.1987.252.2.G250. [DOI] [PubMed] [Google Scholar]
- Womack W. A., Kvietys P. R., Granger D. N. Villous motility. In: Schultz S. G., Wood J. D., Rauner B. B., editors. Handbook of physiology. 2nd edn. Bethesda, MD: American Physiological Society; 1989. pp. 975–986. [Google Scholar]
- Wood J. D. Enteric neuroimmunophysiology and pathophysiology. Gastroenterology. 2004;127:635–657. doi: 10.1053/j.gastro.2004.02.017. ( ) [DOI] [PubMed] [Google Scholar]
- Yu D., Mei R., Luo L., Shyy W. A multi-grid lattice Boltzmann method for viscous fluid flows. Int. J. Num. Meth. Fluids. 2002;39:99–120. doi: 10.1002/fld.280. ( ) [DOI] [Google Scholar]