Abstract
Despite of the importance of epigenetic regulation in neurological disorders, little is known about neuronal chromatin. Cerebellar Purkinje neurons have large and euchromatic nuclei, whilst granule cell nuclei are small and have a more typical heterochromatin distribution. While comparing the abundance of 5-methylcytosine (mC) in Purkinje and granule cell nuclei, we detected the presence of an unusual DNA nucleotide. Using thin layer chromatography (TLC), high pressure liquid chromatography (HPLC) and mass spectrometry (MS) we have identified the nucleotide as 5-hydroxymethyl-2′-deoxycytidine (hmdC). hmdC comprises 0.6% of total nucleotides in Purkinje cells, 0.2% in granule cells, and is not present in cancer cell lines. hmdC is a constituent of nuclear DNA that is enriched in the brain, suggesting a role in epigenetic control of neuronal function.
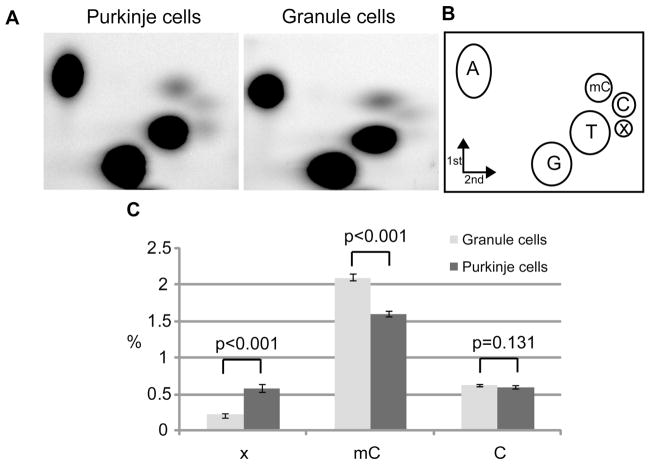
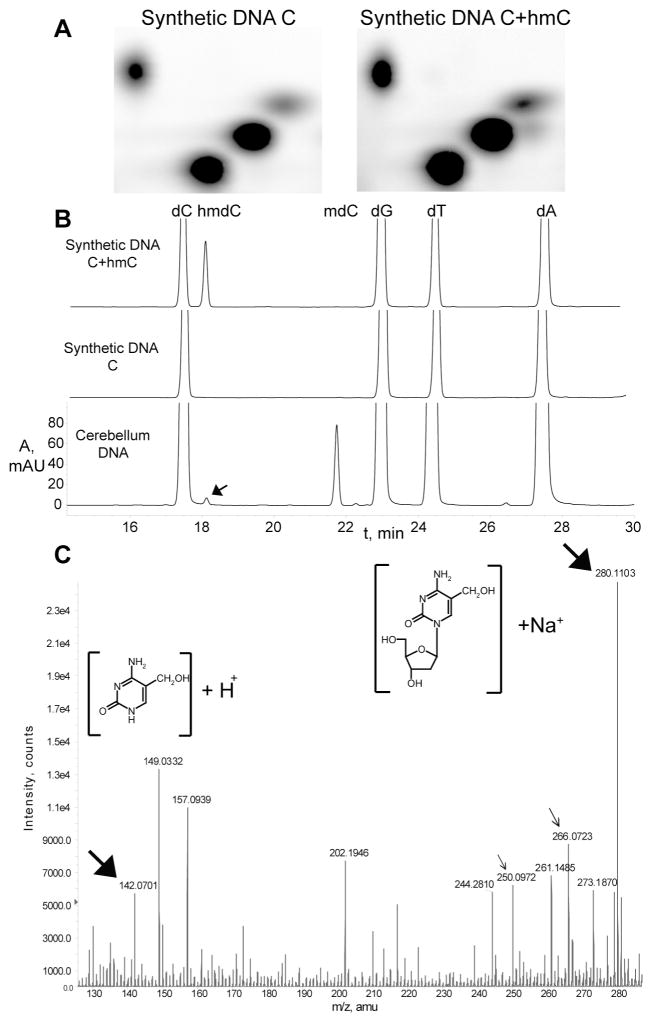
To enable investigation of Purkinje and granule cell nuclei, we took advantage of the fact that ribosomal proteins are assembled in the nucleolus of all cells. Consequently, transgenic mice containing ribosomal protein L10 a fusion with EGFP, for example the Pcp2 bacTRAP and NeuroD1 bacTRAP lines that express in cerebellar Purkinje and granule neurons, respectively, contain fluorescent nucleoli (1, 2) (fig. S1D, E, fig. S2C, D). We utilized this fact, and the fluorescence activated cell sorter (FACS), to obtain ~ 95% pure preparations of Purkinje or granule cell nuclei. While determining the total amount of cytosine methylation in CpG content in Purkinje and granule cell genomic DNA, we consistently observed a significantly lower amount of mC in Purkinje DNA (Fig. 1C) and the presence of a unidentified spot “x” on TLC plates (Fig. 1A). Treating the DNA samples overnight with a mix of RNases A and T1, followed by a one hour with RNase H and V1 (hydrolyzing ssRNA, RNA-DNA hybrids, and dsRNA respectively) did not remove spot “x” (fig. S3A). When the sample was treated with RNase free DNase, spot “x” disappeared, together with the majority of the signal from other spots (fig. S3A). Using the same labeling procedure on total cerebellar RNA, we did not observe spot “x”. Spot “x” was not 2′-deoxyuridine monophosphate, which could appear after cytosine deamination, since a hydrolysate of uracilcontaining DNA generated a spot migrating significantly below spot “x” (fig. S3B). Fragmenting DNA with FokI restriction endonuclease and filling in with α-P32dATP did not yield spot “x” on the resulting TLC plates, demonstrating that “x” is preferentially found in the context of xpG dinucleotides (fig. S3C). From total nucleosides neighboring G, we estimated that “x” constitutes 0.59% ± 0.05 in Purkinje cell DNA and 0.23% ± 0.01 in granule cell DNA. We noticed that the actual increase of xpG is proportional to the decrease of mCpG (Fig. 1C). Considering the quantitative “x” relation with mC, and the fact that the abundance of the other nucleosides was not different between these cell types (Fig. 1C and Fig. 1 legend), we tested the possibility that “x” is 5-hydroxymethyl-2′-deoxycytidine, which is found in T-even bacteriophage DNA (3). The results demonstrated that hmdC monophosphate generated a spot that comigrated with the “x” spot on a TLC plate (Fig. 2A). When a synthetic DNA hydrolysate was separated with reverse phase HPLC, hmdC eluted just after the cytosine peak, consistent with the published observations (4) (Fig. 2B). HPLC analysis of cerebellar genomic DNA resulted in a small, but reproducible, peak on the HPLC chromatogram in the same position (Fig. 2B). To provide definitive proof that “x” is hmC, the corresponding fraction was analyzed with high precision mass spectrometry. Mass spectra identified the presence of two ions, m/z 142.06 ± 0.01 and 280.11 ± 0.02, which matched the theoretical isotopic molecular weights of ions derived from hmdC - m/z 142.06 and 280.09 respectively (Fig. 3C). MS collision induced fragmentation of the hmdC corresponding fraction from synthetic DNA produced the same ions (fig. S4). Taken together, these data demonstrate the presence of hmC in mouse cerebellar DNA. We were unable to detect hmC in four different cell lines of mouse and human origin (fig. S5A). The distribution of hmC in mouse tissues displays the enrichment exclusively in brain, with higher abundance in cortex and brainstem (fig. S5B).
Fig. 1.
Quantification of mC and “x” abundance in Purkinje and granule neurons. A, 2D TLC separation of nucleoside monophosphates from genomic DNA in Purkinje and granule cells. B, reference map to the TLC spots (A is dAMP, etc) (14), with added “x” position. C, percentage shows the abundance of a nucleotide neighboring G. Error bars show SEM (n=11), p values were derived from Matt-Whitney statistics. Neither abundance of dTMP or dAMP were different between the samples (p=0.743 and p=0.793 respectively).
Fig. 2.
2D TLC, HPLC and MS identification of hmC. A, 2D TLC analysis of synthetic DNA templates indicates that hmC comigrates with the “x” spot (Fig 1). B, HPLC chromatograms (A, 254 nm) of the nucleosides derived from synthetic and cerebellum DNA. The peaks were identified using MS. The black arrow points to the peak, which elutes at the same time as hmdC. C, MS of the fraction corresponding to the HPLC peak indicated above. Closed black arrows indicate the masses of 5-hydroxymethylcytosine and 5-hydroxymethyl-2′-deoxylcytidine sodium ions (structures are shown on the insets). Open arrows indicate the ions generated by 2′-deoxycytidine, which elutes in a large nearby peak and spills over into the analyzed fraction.
It is unlikely that the hmC we observe in vivo is a product of DNA damage (5, 6). We do not observe any other DNA damage products such as 8-oxoguanine, a preferential target for oxidants (7) or thymidine glycol, which is produced in vitro by the oxidation of mC (6). In addition, hmC is enriched in brain, but not in other metabolically active non-proliferating tissues (fig. S5B). Finally, contrary to what one would expect for oxidative DNA damage, we find that there is no correlation between the age of adult mice and the amount of hmC in Purkinje and granule cells (fig. S6).
An early publication suggesting the presence of hmC in mammalian genomes (8) has not been reproduced by others (9, 10). If treated with bisulfite, hmC has been suggested to produce cytosine 5-methylsulfonate, which would be deaminated even at a slower rate than mC (11) leading to the interpretation of hmC as mC after bisulfite sequencing. Although active DNA demethylation is considered to occur, no enzyme has been found that can remove the methyl group from 5-methylcytosine (12). The presence of hydroxylated methyl group could either indicate an intermediate for oxidative demethylation or a stable end-product, which eliminates the need of removal of the methyl group, by modulating affinity of proteins which read the mC signal in non-dividing neuronal cell types. The result that methyl-CpG binding domain of MeCP2 protein has a lower affinity towards sequences containing hmC supports this notion (13). It is notable that hmC is nearly 40% as abundant as mC in Purkinje cell DNA. Given the critical role of mC in epigenetic regulation of the genome, we believe that hmC may also have an important biological role in vivo.
Supplementary Material
References and Notes
- 1.Doyle JP, et al. Cell. 2008;135:749. doi: 10.1016/j.cell.2008.10.029. [DOI] [PMC free article] [PubMed] [Google Scholar]
- 2.Heiman M, et al. Cell. 2008;135:738. doi: 10.1016/j.cell.2008.10.028. [DOI] [PMC free article] [PubMed] [Google Scholar]
- 3.Wyatt GR, Cohen SS. Biochem J. 1953;55:774. doi: 10.1042/bj0550774. [DOI] [PMC free article] [PubMed] [Google Scholar]
- 4.Tardy-Planechaud S, Fujimoto J, Lin SS, Sowers LC. Nucleic Acids Res. 1997;25:553. doi: 10.1093/nar/25.3.553. [DOI] [PMC free article] [PubMed] [Google Scholar]
- 5.Burdzy A, Noyes KT, Valinluck V, Sowers LC. Nucleic Acids Res. 2002;30:4068. doi: 10.1093/nar/gkf520. [DOI] [PMC free article] [PubMed] [Google Scholar]
- 6.Zuo S, Boorstein RJ, Teebor GW. Nucleic Acids Res. 1995;23:3239. doi: 10.1093/nar/23.16.3239. [DOI] [PMC free article] [PubMed] [Google Scholar]
- 7.Cadet J, Douki T, Ravanat JL. Nat Chem Biol. 2006;2:348. doi: 10.1038/nchembio0706-348. [DOI] [PubMed] [Google Scholar]
- 8.Penn NW, Suwalski R, O’Riley C, Bojanowski K, Yura R. Biochem J. 1972;126:781. doi: 10.1042/bj1260781. [DOI] [PMC free article] [PubMed] [Google Scholar]
- 9.Kothari RM, Shankar V. J Mol Evol. 1976;7:325. doi: 10.1007/BF01743628. [DOI] [PubMed] [Google Scholar]
- 10.Gommers-Ampt JH, Borst P. FASEB J. 1995;9:1034. doi: 10.1096/fasebj.9.11.7649402. [DOI] [PubMed] [Google Scholar]
- 11.Hayatsu H, Shiragami M. Biochemistry. 1979;18:632. doi: 10.1021/bi00571a013. [DOI] [PubMed] [Google Scholar]
- 12.Ooi SK, Bestor TH. Cell. 2008;133:1145. doi: 10.1016/j.cell.2008.06.009. [DOI] [PubMed] [Google Scholar]
- 13.Valinluck V, et al. Nucleic Acids Res. 2004;32:4100. doi: 10.1093/nar/gkh739. [DOI] [PMC free article] [PubMed] [Google Scholar]
- 14.Ramsahoye BH. Methods Mol Biol. 2002;200:9. doi: 10.1385/1-59259-182-5:009. [DOI] [PubMed] [Google Scholar]
- 15.We thank Betsy Gauthier for the excellent technical assistance, Svetlana Mazel, Christopher Bare, Xiaoxuan Fan for flow cytometry advice and nuclei sorts, Haiteng Deng and Joseph Fernandez for acquirement of MS data and help with HPLC. We are grateful to Heintz lab members for discussions and support. This work was supported by the Howard Hughes Medical Institute and the Simons Foundation Autism Research Initiative.
Associated Data
This section collects any data citations, data availability statements, or supplementary materials included in this article.


