Abstract
UDP-glucuronosyltransferases (Ugt) catalyze phase II conjugation reactions with glucuronic acid, which enhances chemical polarity and the elimination from the body. Few studies have addressed whether Ugt expression and activity are affected by liver disease, such as steatosis. The purpose of this study was to determine whether steatosis induced by obesity or fasting could affect liver Ugt mRNA expression and activity. Male C57BL/6J and Lepob/ob (ob/ob) mice were fed ad libitum or food was withheld for 24 h. In steatotic livers of ob/ob mice, Ugt1a1, -1a6, -1a9, -2a3, -3a1, and -3a2 mRNA expression increased. Fasting, which also induced steatosis, increased hepatic Ugt1a1, -1a6, -1a7, -1a9, -2b1, -2b5, -2a3, -3a1, and -3a2 mRNA expression in mouse liver. Likewise, acetaminophen glucuronidation increased by 47% in hepatic microsomes from ob/ob mice compared with that in C57BL/6J mice, but not after fasting. In both steatosis models, Ugt induction was accompanied by increased aryl hydrocarbon receptor, constitutive androstane receptor (CAR), peroxisome proliferator-activated receptor (PPAR)-α, pregnane X receptor, nuclear factor (erythroid-derived 2)-like 2 (Nrf2), and peroxisome proliferator-activated receptor-γ coactivator-1α mRNA expression. In addition, fasting increased CAR, PPAR, and Nrf2 binding activity. The work points to hepatic triglyceride concentrations corresponding with nuclear receptor and Ugt expression. The findings indicate that steatosis significantly alters hepatic Ugt expression and activity, which could have a significant impact on determining circulating hormone levels, drug efficacy, and environmental chemical clearance.
Introduction
UDP-glucuronosyltransferases are a family of biotransformation enzymes that catalyze phase II biotransformation reactions, conjugate lipophilic substrates with glucuronic acid, and aid in transporter-mediated excretion into bile and urine. Glucuronidation is a major detoxification pathway for both endogenous and exogenous compounds and is becoming increasingly important for clearance and elimination of the top 200 drugs (Williams et al., 2004). Endogenous Ugt substrates comprise numerous steroids and metabolic products, including bilirubin, steroidal hormones, thyroid hormones, biliary acids, hyodeoxycholic acid, and vitamins. Numerous xenobiotics, including acetaminophen, morphine, propofol, chloramphenicol, and nonsteroidal anti-inflammatory drugs, as well as environmental compounds such as bisphenol A (Hanioka et al., 2008), are glucuronidated by UDP-glucuronosyltransferase.
On the basis of the amino acid sequence similarity, the Ugt superfamily is divided into Ugt1 and Ugt2. The Ugt1 gene consists of a unique first exon that encodes the N-terminal domain and splices with common exons 2 to 5 that create the common C-terminal domain. Each Ugt1a member contains gene-specific promoter regions (Mackenzie et al., 1997). In mice, the Ugt1a gene contains 14 first exons, coding 9 enzymes (Ugt1a1, -1a2, -1a5, -1a6a, -1a6b, -1a7c, -1a8, -1a9, and -1a10) and 5 pseudogenes (Ugt1a3, -1a4, -1a7a, -1a7b, and -1a11) (Zhang et al., 2004), which mediate drug, hormone, and bilirubin glucuronidation. The Ugt2a isoforms are encoded by separate genes composed of six individual exons, further subdivided into Ugt2a and Ugt2b subfamilies. There are three Ugt2a gene duplication products, Ugt2a1, -a2, and -a3. The seven Ugt2b genes in mice include Ugt2b1, -2b5, and -2b34 to -2b38. In addition, a novel Ugt3a family has been recently identified in humans and rodents, giving rise to two individual gene products in mice, Ugt3a1 and Ugt3a2, located on mouse chromosome 15 (Mackenzie et al., 2005).
It is well described that Ugt induction in liver occurs with microsomal enzyme inducer treatment, and this induction is mediated through nuclear receptor- and transcription factor-dependent mechanisms (Shelby and Klaassen, 2006; Buckley and Klaassen, 2009). Peroxisome proliferator-activated receptor-α (PPARα), pregnane X receptor (PXR), constitutive androstane receptor (CAR), nuclear factor (erythroid-derived 2)-like 2 (Nrf2), and aryl hydrocarbon receptor (AhR) have been implicated in the regulation of Ugt expression. PPAR response elements are present in the human UGT2B4 promoter and PPARα-retinoid X receptor-α binding has been described to drive the gene expression (Barbier et al., 2003). Pregnenolone 16-carbonitrile, a PXR ligand, up-regulated Ugt1a1, -1a4, and -1a6 mRNA and protein levels in livers and intestines of mice in a PXR-dependent manner (Chen et al., 2005). Phenobarbital increased UGT1A1 gene transcription by a CAR-dependent mechanism (Sugatani et al., 2005). Tetrachlorodibenzo-p-dioxin, a potent AhR activator, induced Ugt1a6, -1a9, -2b34, -2b35, and -2b36 mRNA expression in liver, which was Nrf2-dependent (Yeager et al., 2009). Human UGT1A1 expression was markedly increased in intestines and livers of transgenic mice treated with tert-butylhydroquinone, suggesting Nrf2-Keap1 signaling involvement in UGT1A1 induction (Yueh and Tukey, 2007).
Obesity has been cited as a major health hazard factor in the United States in recent years. A common consequence of obesity and diabetes is the development of hepatic steatosis or “fatty liver,” which is the accumulation of triglyceride in hepatocytes. In the United States, it is estimated that one-third of the general population has nonalcoholic fatty liver disease, which is associated with obesity and consumption of a diet rich in fat and carbohydrates (Sanyal, 2011). Moreover, type 2 diabetes increases the risk of steatosis. In contrast, steatosis can also be produced by food deprivation, because fat is mobilized from adipose tissue to liver for acetyl-CoA production. Steatosis has been observed with anorexia (Sakada et al., 2006). Few studies have addressed how steatosis can affect Ugt expression and activity and whether excess fat stores can counter fasting-mediated alterations in enzyme expression or activity.
With obesity and obesity-associated hepatic steatosis increasing, there is a need to understand how Ugt expression is affected under fed and nutrient-deprived conditions to better predict adverse drug reactions, drug-induced liver injury, and alterations in drug pharmacokinetics. The aim of the current study was to determine whether Ugt expression is altered in livers of obese (ob/ob) mice, and how obese mice regulate Ugt expression after food deprivation. Our results demonstrate that Ugt expression increases correspondingly with increased hepatic triglyceride content and nuclear receptor expression and that obesity conferred some resistance to fasting-induced loss of Ugt activity.
Materials and Methods
Supplies and Reagents.
8-Bromoadenosine 3′,5′-cyclic monophosphate (8-Br-cAMP), acetic acid, acetaminophen, acetaminophen glucuronide, polyethylene glycol hexadecyl ether (Brij 58), EDTA, MgCl2, paraxanthine (1,7-dimethylxanthine), perchloric acid, potassium chloride, sodium pyrophosphate, sucrose, Trizma hydrochloride, UDP-glucuronic acid, and protein protease inhibitor were purchased from Sigma-Aldrich (St. Louis, MO). Ethanol, methanol, chloroform, and Triton X-100 were obtained from Thermo Fisher Scientific (Waltham, MA). All chemicals used were of the highest purity available for analytical research.
Animal Care.
Male 8-week-old C57BL/6J and Lepob/ob mice were purchased from The Jackson Laboratory (Bar Harbor, ME) and acclimated for a minimum of 1 week in a temperature- and humidity-controlled facility. Mice were fed Teklad Rodent Diet 7012 (Harlan Teklad, Madison, WI) and allowed access to water ad libitum unless otherwise noted. All procedures were conducted in accordance with the National Institutes of Health Guidelines for the Care and Use of Laboratory Animals (Institute of Laboratory Animal Resources, 1996) and were approved by the University of Rhode Island Animal Care and Use Committee.
Fasting Studies.
Mice were divided into four groups: C57BL/6J fed ad libitum (C57-Fed), C57BL/6J food withheld (C57-Fasted), Lepob/ob fed ad libitum (ob/ob-Fed), and Lepob/ob food withheld (ob/ob-Fasted); n = 8 for each group. The day before fasting, mice were housed singly and habituated for 1 day. Mice were allowed access to water and food ad libitum or water only. Blood and liver tissue were collected 24 h after food was withheld. Blood was centrifuged at 5000g for 15 min at 4°C; serum was isolated and stored at −80°C. Two portions of the left lobe of each liver were fixed in 10% formalin. The remainder of the liver was snap-frozen in liquid nitrogen and stored at −80°C.
Hematoxylin and Eosin Staining of Liver Sections.
Liver tissue was fixed in buffered formalin for 24 h, transferred to 70% ethanol, and then processed for paraffin embedding. Paraffin sections (5 μm) were cut and stained with hematoxylin and eosin. All procedures were performed according to typical histology protocols as performed by AML Laboratories (Baltimore, MD).
Glucose Assay.
Serum glucose levels were analyzed using a spectrophotometric glucose assay kit (Cayman Chemical, Ann Arbor, MI) according to the manufacturer's protocol. Five hundred microliters of glucose assay reagent was added to 5 μl of serum or standard and incubated for 10 min at 37°C. The absorbance was measured at 500 to 520 nm by using a 96-well plate reader.
Serum Cytokine and Hormone Quantification.
Serum cytokine concentrations were determined using a MILLIPLEX MAP kit (Millipore Corporation, Billerica, MA) according to the manufacturer's protocol. Ten microliters of serum was added and incubated with specific antibody-immobilized beads with agitation on a plate shaker overnight at 4°C. The plate was then washed with 200 μl of wash buffer/well three times, and 50 μl of detection antibodies was added to each well and incubated for 30 min with agitation. A further 50 μl of streptavidin-phycoerythrin was added to the well and incubated for another 30 min. The plate was washed, and 100 μl of sheath fluid was added. The median fluorescent intensity was measured on a Luminex Bio-Plex 200 system, and data were acquired with Bio-Plex Manager 5.0 software (Bio-Rad Laboratories, Hercules, CA).
Primary Mouse Hepatocyte Culture, RNA Isolation, and Quantitative Real-Time PCR.
Primary mouse hepatocytes were isolated from 2- to 3-month-old male C57BL/6J or ob/ob mouse livers using a two-step collagenase perfusion; 1 × 10⁶ cells/well in 2 ml of complete medium (minimal essential medium supplied with 10% fetal bovine serum) were seeded on collagen-coated six-well plates. After attachment (∼4 h), cells were cultured in serum-free minimal essential medium containing 1% ITS supplement (Invitrogen, Carlsbad, CA). At approximately 24 h after-plating, hepatocytes were treated with vehicle or 0.1 mM 8-Br-cAMP for another 24 h. Total RNA was isolated from cells or 50 mg of tissue using TRIzol reagent (Invitrogen) according to the manufacturer's instructions. One microgram of total RNA was converted to single-stranded cDNA using oligo(dT)18 primers, and mRNA levels were quantified by quantitative real-time PCR using a Roche LightCycler detection system (Roche Applied Science, Mannheim, Germany). Samples were run by using SYBR Green and compared with levels of 18S rRNA as a reference housekeeping gene. Quantitative real-time PCR conditions were optimized for each gene using appropriate forward and reverse primers. The primers used are listed in Supplemental Table S1. Multiple housekeeping genes were screened (e.g., GAPDH and β-actin), but 18S rRNA was selected because it showed the least change with steatosis. All oligonucleotides were synthesized by Invitrogen.
Quantification of Serum and Hepatic Lipid Concentrations.
Liver tissues (50 mg) were homogenized at 4°C in 1 ml of phosphate-buffered saline, a 200-μl aliquot of the homogenates was used, and the lipids were extracted with 3.75 ml of chloroform-methanol (2:1, v/v). The lipid residue was resuspended in 200 μl of 1% Triton X-100 in 100% ethanol. Hepatic and serum triglyceride and free fatty acid concentrations were determined by using triglyceride (Pointe Scientific, Inc., Lincoln Park, MI) and free fatty acid (Wako Chemicals USA, Inc., Richmond, VA) reagent kits.
Hepatic Microsomal Preparation and In Vitro Acetaminophen Glucuronidation.
Liver tissue (∼200 mg) was homogenized in 154 mM potassium chloride buffer containing 50 mM Tris-HCl and 1 mM EDTA (pH 7.4, containing protease inhibitor). Homogenates were centrifuged at 10,000g for 30 min at 4°C. The supernatant was collected and centrifuged at 100,000g for 1 h at 4°C. Then the microsomal pellet was resuspended in 2 ml of 100 mM sodium pyrophosphate containing 0.1 mM EDTA (pH 7.4) and centrifuged at 100,000g at 4°C for another 1 h. The resulting supernatant was discarded, and the microsomal pellet was resuspended with 100 μl of 250 mM sucrose and stored at −80°C.
Acetaminophen glucuronidation was determined using a modified method (Alkharfy and Frye, 2001). In brief, 0.1 M sodium phosphate buffer (pH 7.8), 5 mM acetaminophen, 10 mM MgCl2, 0.5% Brij 58 (microsomal activator), and microsomes (10–50 μg of total protein) were preincubated in glass test tubes for 10 min. Then 4 mM UDP-glucuronic acid was added to the solution to a total volume of 250 μl. The tubes were placed in a 37°C water bath, and the reaction was started. The reaction was stopped after a 60-min incubation by the addition of 25 μl of 6% perchloric acid containing 25 μg of paraxanthine (internal standard), followed by vortexing and cooling on ice. Tubes were then centrifuged at 3200g for 10 min at 4°C, and the resulting supernatant was transferred into autosampler vials. Then 40-μl aliquots of the supernatant were injected into the high-performance liquid chromatography column; each measurement was repeated three times.
Measurement of DNA Binding of Transcriptional Factors in Mouse Liver.
The in vitro binding activity of transcriptional factors, namely AhR, CAR, PPAR, PXR, and Nrf2 to consensus cis-response elements was determined using Procarta TF 9-Plex custom arrays from Affymetrix (Santa Clara, CA) according to the manufacturer's instructions (Yaoi et al., 2006). Nuclear extracts were isolated from livers of C57BL/6J and ob/ob mice by using a NE-PER Nuclear and Cytoplasmic Extraction Kit (Thermo Fisher Scientific). The PPAR assays determine the binding of TFs to the consensus PPAR cis-response elements and thus do not differentiate the DNA binding of PPARα from that of other PPAR family members, including PPARβ and PPARγ. Samples were analyzed using a Luminex Bio-Plex 200 array reader with Luminex 100 xMAP technology, and data were acquired using Bio-Plex Manager software (version 5.0). All data were normalized to TF IID binding activity.
Statistical Analysis.
Two-way analysis of variance was used with genotype and fasting as the main factors, followed by Student-Newman-Keuls comparisons to assess the differences between groups (P < 0.05). The data for in vitro DNA binding of transcriptional factor assays were analyzed by using an unequal variance t test with significance set at P < 0.05.
Results
Body and Liver Weight, Serum Glucose, Triglyceride, Free Fatty Acid, Insulin, and Leptin Levels in C57BL/6J and ob/ob Mice after Fasting.
Table 1 illustrates basic parameters of C57BL/6J and ob/ob mice after fasting. The fed ob/ob mice were 2 times heavier than C57BL/6J mice. After 24 h of fasting, ob/ob mice lost only 0.2% of body weight; however, C57BL/6J mice lost 17.3%. ob/ob mice exhibited fatty liver, with liver weight being 1.2-fold higher than that of C57BL/6J mice. Fasting decreased liver weight by 28.7% in C57BL/6J mice (from 1.08 ± 0.02 to 0.77 ± 0.01 g) but only 8.3% in ob/ob mice (from 2.40 ± 0.06 to 2.20 ± 0.10 g). Serum glucose levels decreased after fasting in both lean and ob/ob mice. However, in ob/ob mice, even after fasting, serum glucose levels were still elevated, being higher than those of C57BL/6J mice fed ad libitum (300.9 ± 36.7 versus 204.6 ± 2.5 mg/dl). Fasting increased serum free fatty acid concentrations by 35.1% in C57BL/6J mice and 22.4% in ob/ob mice. The insulin concentrations decreased from 1.37 ± 0.24 to 0.19 ± 0.02 ng/ml in lean mice and from 9.77 ± 0.50 to 3.47 ± 0.45 ng/ml in obese mice, respectively. Serum leptin concentrations were measured in lean mice (556 ± 109 pg/ml). Fasting decreased serum leptin levels to undetectable concentrations.
TABLE 1.
Characters and metabolic parameters in 8-week-old C57BL/6J and ob/ob mice after fasting
Adult male C57BL/6J and ob/ob mice were fed ad libitum (Fed) or food was withheld (Fasted) for 24 h. Serum was collected. Serum glucose, triglyceride, and free fatty acid were measured by a spectrophotometric assay; hormones were measured by a luminex-based assay. Data represent average ± S.E. (n = 4–8/group).
| C57 |
ob/ob |
|||
|---|---|---|---|---|
| Fed | Fasted | Fed | Fasted | |
| BW (g) | 21.64 ± 0.15a | 17.90 ± 0.34b | 38.18 ± 0.40c | 38.09 ± 1.18c |
| LW (g) | 1.08 ± 0.02a | 0.77 ± 0.01b | 2.40 ± 0.06c | 2.20 ± 0.10d |
| LW/BW (%) | 4.99 ± 0.07a | 4.28 ± 0.05b | 6.27 ± 0.10c | 5.76 ± 0.08d |
| Glucose (mg/dl) | 204.6 ± 2.5a | 178.7 ± 7.2a | 699.9 ± 24.2b | 300.9 ± 36.7c |
| TG (mg/dl) | 43.01 ± 6.53a | 28.56 ± 1.08b | 49.94 ± 5.50a | 45.00 ± 2.18a |
| FFA (mEq/dl) | 0.34 ± 0.01a | 0.50 ± 0.03b | 0.67 ± 0.05c | 0.82 ± 0.06d |
| Insulin (ng/ml) | 1.37 ± 0.24a | 0.19 ± 0.02b | 9.77 ± 0.50c | 3.47 ± 0.45d |
| Leptin (pg/ml) | 556 ± 109 | N.D. | N.D. | N.D. |
BW, body weight; LW, liver weight; TG, triglyceride; FFA, free fatty acid; N.D., not detected.
Groups with letters different from each other are significantly different (P < 0.05).
Morphological Changes in Liver after Fasting.
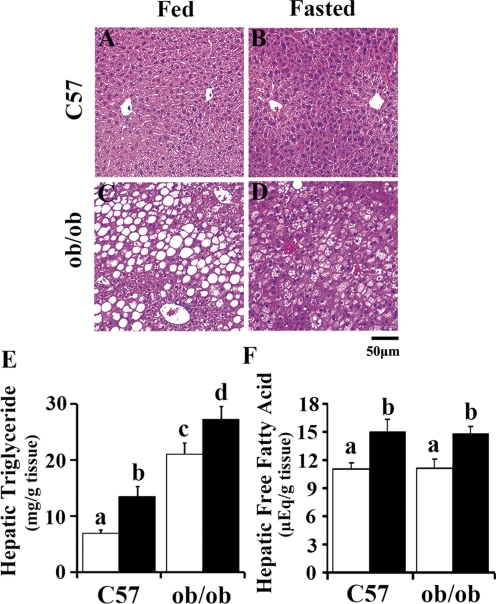
Hematoxylin and eosin staining displayed accumulation of fat in ob/ob liver. C57BL/6J mice exhibited normal liver histopathology before and/or after fasting treatment by histopathological observation (Fig. 1, A and B). In ob/ob mice, fat deposition was clearly associated with the perivenous area of liver lobules, resulting in enlarged fat-laden hepatocytes in these parts of the liver (Fig. 1, C and D). No hepatic necrosis, inflammation, or fibrosis was present in either strain. To quantify hepatic fat accumulation in C57BL/6J and ob/ob mice, lipids were extracted from liver tissues, and the content was quantified by using a spectrophotometric method. ob/ob mice exhibited higher hepatic triglyceride content, and fasting significantly induced hepatic triglyceride accumulation in both genotypes (Fig. 1E). Hepatic free fatty acid concentration increased significantly by fasting in C57BL/6J and ob/ob mice; however, no significant differences were observed between these two genotypes in ad libitum or fasted status (Fig. 1F).
Fig. 1.
Representative hematoxylin and eosin staining and hepatic lipid accumulation of C57BL/6J and ob/ob mice after fasting. A–D, liver samples from adult male C57BL/6J (C57) and obese (ob/ob) mice fed ad libitum (Fed) or withheld food (Fasted) for 24 h were assessed by hematoxylin and eosin staining. Original magnification, 200×. Scale bar, 50 μm (n = 4/group). E–F, hepatic lipids were extracted from liver tissues and hepatic triglyceride and free fatty acid were measured for quantitative lipid content (□, Fed; ■, Fasted). Data represent average ± S.E. (n = 6–8/group). Groups without a common letter are significantly different (P < 0.05).
Fasting Increased Ugt1a mRNA Expression in Mouse Liver.
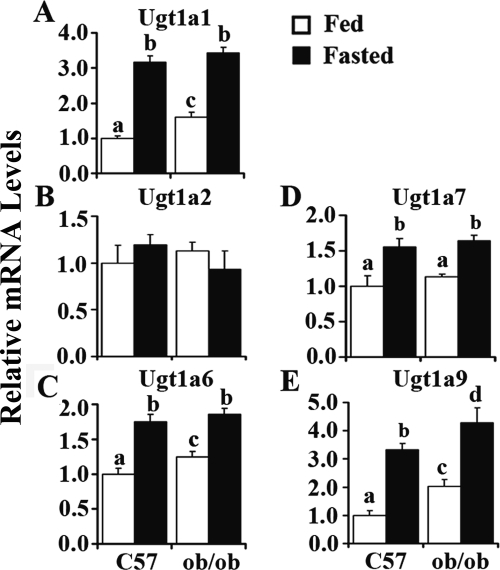
The Ugt isoforms chosen to be measured were determined on the basis of reported expression and inducibility in livers (Buckley and Klaassen, 2009). Figure 2 illustrates fasting-induced expression of various Ugt1a isoforms, including Ugt1a1, 1a6, 1a7, and 1a9 in mouse liver. Fasting increased Ugt1a1 expression more than 2-fold in livers of C57BL/6J mice (Fig. 2A). ob/ob mice fed ad libitum exhibited higher Ugt1a1 expression levels than C57BL/6J mice. After fasting, ob/ob mice showed even higher expression levels of Ugt1a1. Ugt1a6 regulation displayed a similar pattern (Fig. 2C) and was induced 73 and 47% in C57BL/6J and ob/ob mice by fasting, respectively, and after fasting, ob/ob mice exhibited even higher expression levels. Ugt1a7 expression levels increased 56 and 45% by fasting in C57BL/6J and ob/ob mice, respectively. No significant difference was observed between C57BL/6J and ob/ob mice in ad libitum or fasted status (Fig. 2D). Ugt1a9 expression levels were induced 233% in C57BL/6J mice by fasting. The expression levels increased 103% in ob/ob mice compared with those in C57BL/6J mice and increased more by fasting. After fasting, ob/ob mice exhibited even higher expression levels of Ugt1a9 (Fig. 2E). No significant difference in Ugt1a2 expression was found in C57BL/6J and ob/ob mice by fasting (Fig. 2B). These data demonstrated obesity- and fasting-induced Ugt1a1, -1a6, -1a7, and -1a9 expression in mouse liver.
Fig. 2.
Fasting induced Ugt1a1 (A), -1a2 (B), -1a6 (C), -1a7 (D), and -1a9 (E) in mouse liver. Total RNA was isolated from livers of lean (C57) or obese (ob/ob) mice that were fed ad libitum (□, Fed) or withheld food (■, Fasted) for 24 h, and mRNA levels were quantified by quantitative real-time PCR. Data represent average ± S.E. (n = 5–8/group). All data were normalized to 18S rRNA levels. a–d, Groups without a common letter are significantly different (P < 0.05).
Fasting Increased Ugt2b mRNA Expression in Mouse Liver.
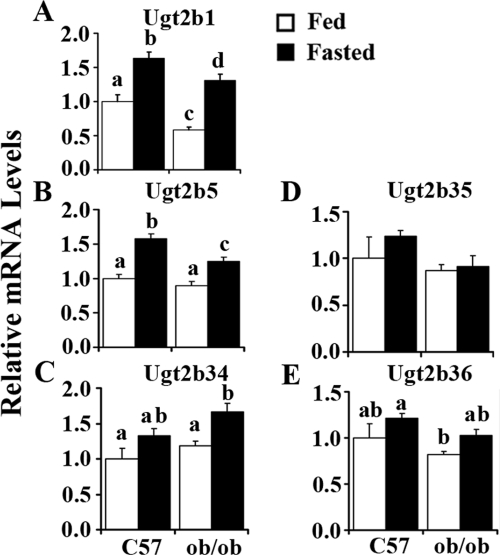
Ugt2b1 expression increased 63% in C57BL/6J mice by fasting; a more than 200% induction was found by fasting in ob/ob mice. ob/ob mice showed lower Ugt2b1 expression levels after fasting (Fig. 3A). Ugt2b5 expression increased significantly in C57BL/6J and ob/ob mice livers after fasting (58 and 39%, respectively), and ob/ob mice exhibited significantly lower expression of the Ugt2b5 gene after fasting (Fig. 3B). Fasting induced Ugt2b34, -2b35, and -2b36 expression slightly, with no significant difference in C57BL/6J mice, and induced 41% of Ugt2b34 expression in livers of ob/ob mice (Fig. 3, C–E).
Fig. 3.
Fasting-induced Ugt2b1 (A), -2b5 (B), -2b34 (C), -2b35 (D), and -2b36 (E) in mouse liver. Total RNA was isolated from livers of lean (C57) or obese (ob/ob) mice that were fed ad libitum (□, Fed) or withheld food (■, Fasted) for 24 h, and mRNA levels were quantified by quantitative real-time PCR. Data represent average ± S.E. (n = 5–8/group). All data were normalized to 18S rRNA levels. a–d, Groups without a common letter are significantly different (P < 0.05).
Fasting Increased Ugt2a3 and Ugt3a1/2 mRNA Expression in Mouse Liver.
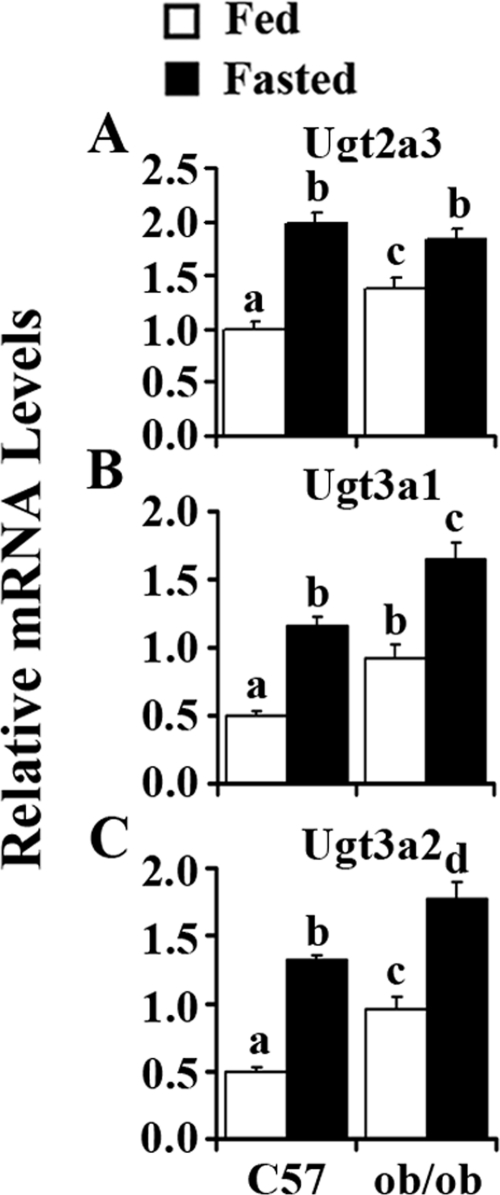
Regarding basal expression, hepatic Ugt2a3 expression is significantly higher in ob/ob mice than in C57BL/6J mice. Fasting increased Ugt2a3 expression by 100% in livers of C57BL/6J mice but only 34% in livers of ob/ob mice (Fig. 4A). Figure 4B illustrates that Ugt3a1 expression increased 84% in ob/ob mice compared with that in C57BL/6J mice. Fasting induced Ugt3a1 expression 130% in C57BL/6J mice and 79% in ob/ob mice. Compared with C57BL/6J mice, ob/ob mice exhibited higher expression levels of Ugt3a1 after fasting. Ugt3a2 expression levels in ob/ob mice were approximately 2 times higher than those in C57BL/6J mice. Fasting induced Ugt3a2 mRNA expression 160% in livers of C57BL/6J mice but only 84% in ob/ob mice.
Fig. 4.
Fasting-induced Ugt2a3 (A), -3a1 (B), and -3a2 (C) in mouse liver. Total RNA was isolated from livers of lean (C57) or obese (ob/ob) mice that were fed ad libitum (□, Fed) or withheld food (■, Fasted) for 24 h, and mRNA levels were quantified by quantitative real-time PCR. Data represent average ± S.E. (n = 6–8/group). All data were normalized to 18S rRNA levels. a–d, Groups without a common letter are significantly different (P < 0.05).
Fasting Decreased Hepatic Acetaminophen Glucuronidation Activity In Vitro.
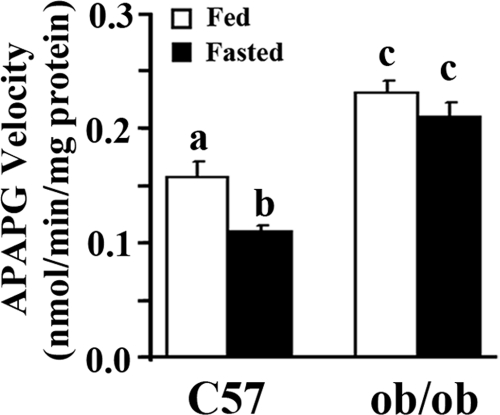
The current data demonstrate that mRNA expression of various Ugt isoforms corresponded with obesity- and fasting-induced steatosis. However, it is necessary to examine whether steatosis and fasting affect UGT activity. Figure 5 illustrates that acetaminophen glucuronidation was 47% higher in ob/ob mice than in C57BL/6J mice when fed ad libitum, implying that hepatic steatosis increased acetaminophen glucuronidation. Fasting decreased acetaminophen glucuronidation 30% in C57BL/6J mice but only 9% in ob/ob mice. The data demonstrated obesity- or hepatic steatosis-induced UGT activity, but fasting or food deprivation suppressed UGT activity, further demonstrating that ob/ob mice were resistant to fasting effects.
Fig. 5.
Effect of obesity and fasting on acetaminophen glucuronidation (APAPG) in vitro in C57BL/6J and ob/ob mice. Hepatic microsomes were isolated from livers of C57BL/6J (C57) or obese (ob/ob) mice fed ad libitum (□, Fed) or withheld food (■, Fasted) for 24 h, and acetaminophen glucuronidation in vitro was measured by using high-performance liquid chromatography. Data represent average ± S.E. (n = 8/group). a–c, Groups without a common letter are significantly different (P < 0.05).
Fasting Increased AhR, CAR, PPARα, PXR, Nrf2, and PGC1α Expression in Mouse Liver.
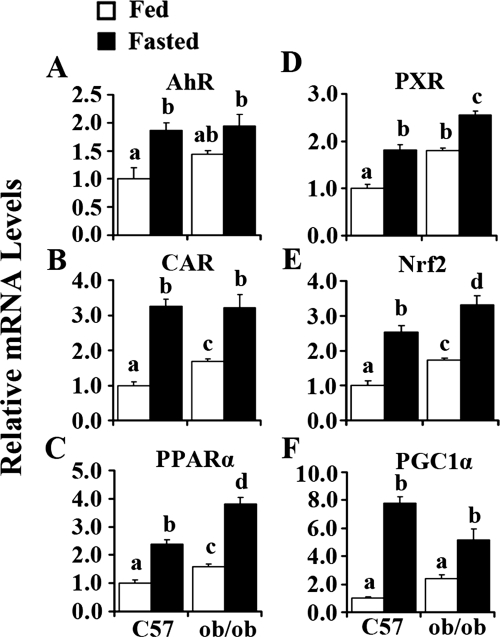
Figure 6A illustrates that fasting increased AhR expression by 86 and 35% in C57BL/6J and ob/ob mice, respectively. ob/ob mice exhibited higher expression levels of CAR in livers when fed ad libitum. After fasting, CAR expression levels increased more than 200% in C57BL/6J mice and 91% in ob/ob mice (Fig. 6B). Figure 6C illustrates that ob/ob mice had higher expression levels of PPARα than C57BL/6J mice; the mRNA expression levels were induced 139 and 140% in C57BL/6J and ob/ob mice, respectively. Compared with C57BL/6J mice, ob/ob mice exhibited higher expression levels of PPARα after fasting. PXR expression was higher in livers of ob/ob mice fed ad libitum compared with that in C57BL/6J mice. After fasting, PXR expression levels increased by 82% in C57BL/6J mice and 42% in ob/ob mice, and ob/ob mice showed higher expression levels (Fig. 6D). Expression of Nrf2 was higher in livers of ob/ob mice than in livers of C57BL/6J mice when fed ad libitum. Fasting doubled Nrf2 expression levels in livers of C57BL/6J mice and increase levels by 91% in ob/ob mice. ob/ob mice exhibited the highest expression levels of Nrf2 after fasting (Fig. 6E). Figure 6F illustrates that PGC1α expression levels increased dramatically in C57BL/6J mice after fasting (more than 6-fold), whereas this increase was attenuated in ob/ob mice (only 190%).
Fig. 6.
Obesity- and fasting-increased AhR (A), CAR (B), PPARα (C), PXR (D), Nrf2 (E), and PGC1α (F) mRNA expression in mouse liver. Total RNA was isolated from livers of C57BL/6J (C57) or obese (ob/ob) mice that were fed ad libitum (Fed) or withheld food (Fasted) for 24 h, and mRNA levels were quantified by quantitative real-time PCR. Data represent average ± S.E. (n = 6–8/group). All data are normalized to 18S rRNA levels. a–d, Groups without a common letter are significantly different (P < 0.05).
Fasting Activated Transcriptional Factor Pathways in Mouse Livers.
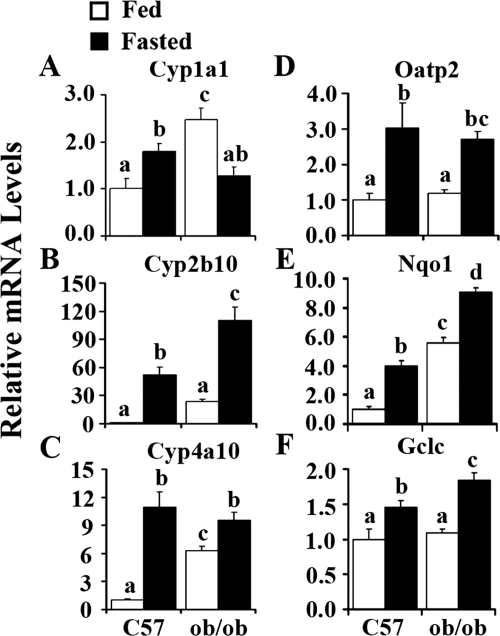
To determine whether fasting will activate each transcriptional factor signaling pathway, the specific target gene of each transcriptional factor was determined by quantitative real-time PCR. Cyp1a1 expression, the marker of AhR activation, was significantly induced by fasting in C57BL/6J mice (Fig. 7A), and ob/ob mice exhibited higher expression levels of Cyp1a1. The CAR target gene, Cyp2b10, increased by 52- and 3.6-fold in C57BL/6J and ob/ob mice, respectively, by fasting (Fig. 7B). Cyp4a10, the target gene of PPARα, increased 10- and 0.5-fold by fasting in C57BL/6J and ob/ob mice, respectively (Fig. 7C). Fasting activated the PXR pathway regarding induction of the target gene expression of Oatp2 (Fig. 7D). Nqo1 and Gclc, the two Nrf2 target genes, showed expression patterns similar to that of Nrf2, excluding no significant induction of Gclc by obesity. Likewise, fasting increased Nqo1 expression 300% in C57BL/6J mice and only 63% in ob/ob mice (Fig. 7E). Gclc increased 46% in C57BL/6J mice and 68% in ob/ob mice (Fig. 7F). These data demonstrate that the transcriptional factor pathways of AhR, CAR, PPARα, PXR, and Nrf2 were probably activated in hepatic steatosis caused by obesity and/or fasting.
Fig. 7.
Obesity- and fasting-induced Cyp1a1 (A), Cyp2b10 (B), Cyp4a10 (C), Oatp2 (D), Nqo1 (E), and Gclc (F) mRNA expression in mouse liver. Total RNA was isolated from livers of C57BL/6J (C57) or obese (ob/ob) mice that were fed ad libitum (□, Fed) or withheld food (■, Fasted) for 24 h, and mRNA levels were quantified by quantitative real-time PCR. Data represent average ± S.E. (n = 6–8/group). All data were normalized to 18S rRNA levels. a–d, Groups without a common letter are significantly different (P < 0.05).
cAMP-Induced Ugt Expression in Mouse Primary Hepatocytes Isolated from C57BL/6 and ob/ob Mice.
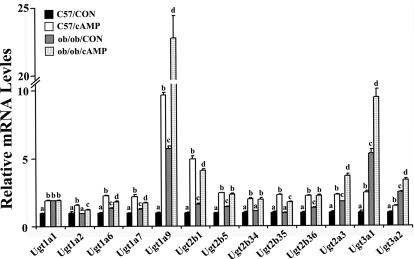
Fasting promotes glucagon secretion into the blood, subsequently increases hepatic intercellular cAMP concentrations, and up-regulates gluconeogenesis. A previous report demonstrated that cAMP treatment increased Ugt1a1 in mouse hepatocytes (Ding et al., 2006). Thus, other Ugt isoforms, which were increased in vivo were also examined. Primary hepatocytes isolated from mouse liver were treated with 8-Br-cAMP, the analog of natural signal molecule cAMP for 24 h. Expression of Ugt1a1, -1a2, -1a6, -1a7, -1a9, -2b1, -2b5, -2b34 to -2b36, -2a3, -3a1, and -3a2 significantly increased after treatment in hepatocytes from C57BL/6J and ob/ob mice, demonstrating that the signaling pathway activated by cAMP played vital roles in Ugt induction in mouse primary hepatocytes (Fig. 8).
Fig. 8.
8-Br-cAMP-induced Ugt isoform mRNA expression levels in hepatocytes. Primary mouse hepatocytes were isolated from 2- to 3-month-old C57BL/6J and ob/ob mouse livers and seeded on collagen-coated six-well plates. After seeding for 24 h, cells were treated with vehicle (■, C57/CON;  , ob/ob/CON) or 0.1 mM 8-Br-cAMP (□, C57/cAMP; ▩, ob/ob/cAMP) for 24 h. Total RNA was isolated, and mRNA relative levels were quantified by quantitative real-time PCR. Data represent average ± S.E (n = 3). All data were normalized to 18S rRNA levels. a–d, Groups without a common letter are significantly different (P < 0.05).
Fasting Increased DNA Binding of Transcriptional Factors to Their cis-Response Elements.
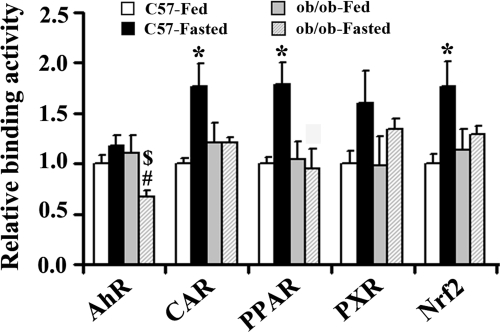
Procarta transcription factor binding assays were used to measure nuclear transcription factor levels via in vitro binding activity to consensus cis-response elements. In lean mice, DNA binding of CAR, PPAR, and Nrf2 was induced 77, 79, and 75% by fasting, respectively. A trend for increased AhR and PXR binding was observed but was not statistically significant. However, in obese mice, DNA binding of these transcriptional factors remained unchanged after fasting, except that AhR DNA binding activity was attenuated, further suggesting that ob/ob mice were resistant to fasting effects (Fig. 9).
Fig. 9.
Steatosis and fasting modulate nuclear AhR, CAR, PPAR, PXR, and Nrf2 binding. Nuclear extraction from livers of C57BL/6J (□, C57/Fed; ■, C57/Fasted) and ob/ob ( , ob/ob/Fed; ▩, ob/ob/Fasted) mice (n = 3 per group) were used to determine in vitro DNA binding of transcriptional factors with Procarta TF 9-Plex custom arrays. Data ob/ob (
 , ob/ob/Fed; ▩, ob/ob/Fasted) represent average ± S.E. All data were normalized to TF IID values. *, #, $, P < 0.05, C57-Fasted compared with C57-Fed, ob/ob-Fasted compared with C57-Fasted, and ob/ob-Fasted compared with ob/ob-Fed, respectively.
Discussion
UDP-glucuronosyltransferases are highly expressed in liver and intestine and are responsible for glucuronidation of chemicals including hormones, bile acids, drugs, and environmental agents. Glucuronidation influences the pharmacokinetic profiles of the drugs in tissues with high glucuronidation capacity. The study herein illustrates two key findings: the expression of multiple Ugt isoforms is associated with fatty liver and occurs after fasting. Both conditions correspond with increased hepatic triglyceride content, increased nuclear receptor expression, and binding (Supplemental Table S2).
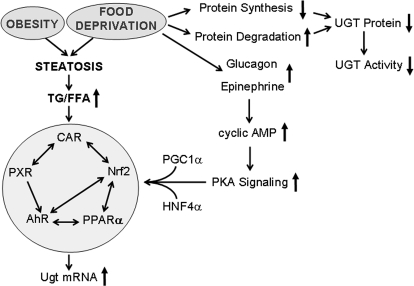
Fasting is known to increase glucagon secretion and hepatic intracellular cAMP levels and has been shown to induce Ugt1a1 expression through a network of cAMP, PGC1α, HNF4α, and CAR signaling pathways (Ding et al., 2006). In response to fasting induction, serum epinephrine and glucagon concentrations increase, which will increase intracellular cAMP levels and then activate the protein kinase A signaling pathway, which up-regulates downstream gene expression of PGC1α and PPARα and subsequently induces Ugt target gene expression (Fig. 10). Our data demonstrate additional increases in Ugt1 and Ugt2 isoforms after food deprivation and in primary mouse hepatocytes treated with the cAMP analog 8-Br-cAMP, suggesting that enhanced intracellular cAMP levels play vital roles in the induction of Ugt isoforms by fasting.
Fig. 10.
Summary of obesity and fasting-induced Ugt induction. Obesity- and food deprivation-induced steatosis, which was accompanied by increased hepatic triglyceride and free fatty acid content and subsequently induced the network of transcriptional factors of AhR, CAR, Nrf2, PXR, and PPARα and then increased Ugt isoform mRNA expression. Fasting up-regulates protein kinase A (PKA) signaling along with PGC1α and HNF4α, also induced the network of transcriptional factors of AhR, CAR, Nrf2, PXR, and PPARα and then induced Ugt isoform mRNA expression. Food deprivation decreased protein synthesis and increased protein degradation, which decreased UGT activity in livers. TG, triglyceride; FFA, free fatty acid.
Mice have relatively high expression levels of Ugt1a1 and Ugt1a6 in liver (Shelby et al., 2003). In the current study, obesity- and fasting-induced steatosis increased Ugt1a1 and Ugt1a6 mRNA expression along with an observed increase in CAR binding and a trend toward an increase in PXR binding. Multiple studies have illustrated that prototypical CAR and PXR activators increased Ugt1a1 and Ugt1a6 mRNA expression in mouse liver via CAR- and PXR-dependent mechanisms (Buckley and Klaassen, 2009; Ou et al., 2010). In addition, rifampicin, a human PXR activator, increased UGT1A1 mRNA and protein expression in HepG2 cells, and dexamethasone enhanced PXR-mediated induction (Sugatani et al., 2005). Transgenic mice overexpressing a constitutively active form of human PXR exhibited significant induction of Ugt1a1 and Ugt1a6 expression in the liver, suggesting the induction of Ugt expression via a PXR-dependent pathway (Ou et al., 2010). Our results demonstrate up-regulation of mRNA levels of CAR and PXR in livers of ob/ob mice or after fasting (Fig. 6, B and D) and activation of the signaling pathway of CAR and PXR (Fig. 7, B and D), which would promote Ugt expression in mouse liver subsequently.
PPARα, a key regulator of fatty acid oxidation and lipid homeostasis, is essential for adaptation to fasting in rats and mice (Leone et al., 1999). As with CAR and PXR activators, PPARα activators induced Ugt1 isoform expression in mouse and rat liver, as well as in human hepatocytes. PPAR-responsive elements were identified in the promoter of UGT1A1, 1A3, and 1A6 genes, which mediated PPAR-dependent UGT induction in HepG2 cells (Senekeo-Effenberger et al., 2007). Likewise, Ugt2 isoforms were inducible by PPARα ligands in mouse liver and human hepatocytes (Barbier et al., 2003). It is well documented that PPARα activity is up-regulated in steatosis and in livers from ob/ob mice (Memon et al., 2000). The current research also demonstrates that PPARα mRNA expression increased in steatotic livers of ob/ob mice and fasting-induced steatosis, suggesting that PPARα activation plays an important role in the observed Ugt isoform induction.
Nrf2 is considered to be a major regulator of cytoprotective detoxification and antioxidant enzyme expression (Wakabayashi et al., 2010). Enhanced Nrf2 activity and expression after electrophilic and oxidant exposure has been termed the antioxidant response, inducing phase I and II detoxification enzymes, namely UDP-glucuronosyltransferases. It is well described that Nrf2 activators can up-regulate certain UGT1 and UGT2 isoforms in human cell lines (Yueh and Tukey, 2007) as well as in mouse and rat liver and intestine (Buckley and Klaassen, 2009). Ugt1a6 and Ugt1a7 induction by oltipraz was abrogated in Nrf2-null mice, suggesting a major role for Nrf2 in the induction of Ugt expression (Iida et al., 2004). Ugt1a6 expression was inducible in mouse liver after constitutive Nrf2 activation via silencing of Kelch-like ECH-associated protein 1 (Keap1 knockdown) (Reisman et al., 2009), consistent with the latter findings of Nrf2 activation up-regulating Ugt1a6 expression pharmacologically (Buckley and Klaassen, 2009). Data from our current study illustrate increased hepatic Nqo1 and Gclc expression levels in ob/ob and fasted mice, suggesting that Nrf2 signaling activated by different models of steatosis, which could be responsible for the Ugt induction in mouse liver.
The existence of Ugt3 subfamily isoforms was first noted in 2000 (Tukey and Strassburg, 2000) after homology searching of the databases assembled as part of the Human Genome Project (Radominska-Pandya et al., 1999). In contrast to the extensive studies on the function of Ugt1 and Ugt2 subfamilies, there are limited studies that describe the catalytic properties and substrates of the Ugt3 subfamily and regulation of gene expression remain largely undescribed. Ugt3a1/2 is expressed at relatively high levels in kidney and at low levels in liver and was not detectable in lung, stomach, brain, gonad, and placental tissue (Buckley and Klaassen, 2007). Ugt3a2 uses both UDP-glucose and UDP-xylose as a glucose donor and is relatively low in liver and gastrointestinal tract, but higher in thymus, testis, and kidney, suggesting that it probably plays a minor role in drug metabolism (MacKenzie et al., 2011). In the current study, Ugt3a1 and Ugt3a2 mRNA levels increased in livers from ob/ob and fasted mice. Further research on the Ugt3 subfamily is needed to reveal significant therapeutic and/or toxicological implications in the future.
Our current data demonstrate that fasting increased the mRNA levels of additional Ugt isoforms but decreased UGT activity in vitro in mouse liver. UGT activity in vivo is dependent on hepatic glycogen stores (Bánhegyi et al., 1988). During severe food deprivation, the UDP-glucose supply might be insufficient for acetaminophen conjugation despite the induction of Ugt isoforms in liver. However, it is also known that fasting decreases the rate of protein synthesis and increases protein degradation in mammalian animal models (Cherel et al., 1991), which subsequently decreases the cellular protein levels described by decreased UGT activity from the current study, despite higher mRNA expression. It has been established historically that fasting increased acetaminophen hepatotoxicity in rodents (Walker et al., 1982). It is well known that induction of acetaminophen toxicity in rodents has a circadian component and the timing of acetaminophen dosing is critical for the level of hepatotoxicity that manifests (Schnell et al., 1984). It should be noted that cases of acetaminophen-induced hepatotoxicity in humans (especially children) has been documented with concomitant fasting and malnutrition (Fernando and Ariyananda, 2009). In the present study, we observed discordant Ugt expression and acetaminophen glucuronidation. Fasting increased Ugt mRNA isoforms likely to carry out acetaminophen biotransformation, such as Ugt1a1, -1a5, and -1a6 (Kessler et al., 2002). However, the present data illustrate that fasting decreased acetaminophen glucuronidation activity in lean mice, but did so minimally in ob/ob mice, indicating that extra fat stores may provide resistance. In addition, in ob/ob mice, obesity-induced hepatic steatosis increased Ugt expression and acetaminophen glucuronidation in vitro activity. Obesity has been associated with enhanced capacity for biotransformation of lorazepam, oxazepam, and acetaminophen, which were via glucuronide conjugation (Abernethy et al., 1983). Together, the findings indicate that the obese population could be resistant to acetaminophen-induced liver injury under normal conditions, as well as when food consumption has been limited due to illness.
It is interesting that despite such different models, Ugt isoforms and nuclear receptor expression levels corresponded with hepatic triglyceride content. In the current experiment, certain Ugt isoforms (Ugt1a1, -1a6, -1a9, -2a3, -2b34, -3a1, and -3a2) corresponded with hepatic triglyceride content (Supplemental Figure S1), suggesting excessive triglyceride in hepatic steatosis plays a vital role in up-regulating nuclear receptors and induces Ugt expression. The increased hepatic triglyceride content was also associated with increased nuclear receptor expression and binding activity. In brief, our study and others have observed that fasting and obesity caused increased hepatic triglyceride content (Newberry et al., 2003). Both conditions are associated with increased levels of circulating free fatty acid and increased hepatic steatosis (Guan et al., 2009). This increase in hepatic steatosis in accompanied by the increase in expression and binding activity of nuclear receptors, such as AhR, CAR, Nrf2, PXR, and PPARα, which are known to modulate Ugt expression directly or indirectly though interactions with other nuclear receptors (such as HNFs) (Osabe et al., 2008). However, because food deprivation is known to induce protein degradation and repress protein synthesis, hepatic UGT isoform expression was probably decreased at the protein level, which corresponded to the decreased UGT activity (summarized in Fig. 10).
Overall, the current study demonstrates obesity- and fasting-induced UDP-glucuronosyltransferases expression in mouse liver, and the induction was associated with AhR, CAR, PPARα PXR, Nrf2, and PGC1α up-regulation. Obesity increased hepatic glucuronidation activity; however, fasting decreased the activity in C57BL/6J or ob/ob mice. In addition, ob/ob mice appeared to be resistant to fasting effects. These data indicate nuclear receptor and Ugt expression may be responsive to hepatic triglyceride concentrations, as well as blood glucose levels. Overall, there is potential for differential glucuronidation pharmacokinetics for drugs and environmental chemicals in the obese and fasted liver, which warrants further investigation.
Supplementary Material
Acknowledgments
We thank Ajay Donepudi, Vjay More, Maneesha Paranjpe, and Wei Wei for technical assistant and critical review for manuscript.
This work was supported by the National Institutes of Health National Institute of Environmental Health Sciences [Grants 5R01-ES016042-03, 3R01-ES016042-2S2, 5K22-ES013782-03]; and in part by the National Institutes of Health National Center for Research Resources [Rhode Island IDeA Network of Biomedical Research Excellence Award P20-RR016457-10].
Article, publication date, and citation information can be found at http://dmd.aspetjournals.org.
 The online version of this article (available at http://dmd.aspetjournals.org) contains supplemental material.
- Ugt/UGT
- UDP-glucuronosyltransferase
- PPAR
- peroxisome proliferator-activated receptor
- PXR
- pregnane X receptor
- CAR
- constitutive androstane receptor
- Nrf2
- nuclear factor (erythroid-derived 2)-like 2
- AhR
- aryl hydrocarbon receptor
- 8-Br-cAMP
- 8-bromoadenosine 3′,5′-cyclic monophosphate
- PCR
- polymerase chain reaction
- Nqo1
- NAD(P)H dehydrogenase, quinone 1
- Gclc
- glutamate-cysteine ligase, catalytic subunit
- TF
- transcription factor
- PGC1α
- peroxisome proliferator-activated receptor-γ coactivator-1α
- HNF
- hepatic nuclear factor.
Authorship Contributions
Participated in research design: Xu, Kulkarni, and Slitt.
Conducted experiments: Xu, Kulkarni, Li, and Slitt.
Performed data analysis: Xu, Li, and Slitt.
Wrote or contributed to the writing of the manuscript: Xu, Kulkarni, Li, and Slitt.
References
- Abernethy DR, Greenblatt DJ, Divoll M, Shader RI. (1983) Enhanced glucuronide conjugation of drugs in obesity: studies of lorazepam, oxazepam, and acetaminophen. J Lab Clin Med 101:873–880 [PubMed] [Google Scholar]
- Alkharfy KM, Frye RF. (2001) High-performance liquid chromatographic assay for acetaminophen glucuronide in human liver microsomes. J Chromatogr B Biomed Sci Appl 753:303–308 [DOI] [PubMed] [Google Scholar]
- Bánhegyi G, Garzó T, Antoni F, Mandl J. (1988) Glycogenolysis—and not gluconeogenesis—is the source of UDP-glucuronic acid for glucuronidation. Biochim Biophys Acta 967:429–435 [DOI] [PubMed] [Google Scholar]
- Barbier O, Duran-Sandoval D, Pineda-Torra I, Kosykh V, Fruchart JC, Staels B. (2003) Peroxisome proliferator-activated receptor α induces hepatic expression of the human bile acid glucuronidating UDP-glucuronosyltransferase 2B4 enzyme. J Biol Chem 278:32852–32860 [DOI] [PubMed] [Google Scholar]
- Buckley DB, Klaassen CD. (2007) Tissue- and gender-specific mRNA expression of UDP-glucuronosyltransferases (UGTs) in mice. Drug Metab Dispos 35:121–127 [DOI] [PubMed] [Google Scholar]
- Buckley DB, Klaassen CD. (2009) Induction of mouse UDP-glucuronosyltransferase mRNA expression in liver and intestine by activators of aryl-hydrocarbon receptor, constitutive androstane receptor, pregnane X receptor, peroxisome proliferator-activated receptor α, and nuclear factor erythroid 2-related factor 2. Drug Metab Dispos 37:847–856 [DOI] [PMC free article] [PubMed] [Google Scholar]
- Chen S, Beaton D, Nguyen N, Senekeo-Effenberger K, Brace-Sinnokrak E, Argikar U, Remmel RP, Trottier J, Barbier O, Ritter JK, et al. (2005) Tissue-specific, inducible, and hormonal control of the human UDP-glucuronosyltransferase-1 (UGT1) locus. J Biol Chem 280:37547–37557 [DOI] [PubMed] [Google Scholar]
- Cherel Y, Attaix D, Rosolowska-Huszcz D, Arnal M, Le Maho Y. (1991) Brief fasting decreases protein synthesis in the brain of adult rats. Neurochem Res 16:843–847 [DOI] [PubMed] [Google Scholar]
- Ding X, Lichti K, Kim I, Gonzalez FJ, Staudinger JL. (2006) Regulation of constitutive androstane receptor and its target genes by fasting, cAMP, hepatocyte nuclear factor α, and the coactivator peroxisome proliferator-activated receptor gamma coactivator-1α. J Biol Chem 281:26540–26551 [DOI] [PMC free article] [PubMed] [Google Scholar]
- Fernando WK, Ariyananda PL. (2009) Paracetamol poisoning below toxic level causing liver damage in a fasting adult. Ceylon Med J 54:16–17 [DOI] [PubMed] [Google Scholar]
- Guan HP, Goldstein JL, Brown MS, Liang G. (2009) Accelerated fatty acid oxidation in muscle averts fasting-induced hepatic steatosis in SJL/J mice. J Biol Chem 284:24644–24652 [DOI] [PMC free article] [PubMed] [Google Scholar]
- Hanioka N, Naito T, Narimatsu S. (2008) Human UDP-glucuronosyltransferase isoforms involved in bisphenol A glucuronidation. Chemosphere 74:33–36 [DOI] [PubMed] [Google Scholar]
- Iida K, Itoh K, Kumagai Y, Oyasu R, Hattori K, Kawai K, Shimazui T, Akaza H, Yamamoto M. (2004) Nrf2 is essential for the chemopreventive efficacy of oltipraz against urinary bladder carcinogenesis. Cancer Res 64:6424–6431 [DOI] [PubMed] [Google Scholar]
- Institute of Laboratory Animal Resources (1996) Guide for the Care and Use of Laboratory Animals 7th ed Institute of Laboratory Animal Resources, Commission on Life Sciences, National Research Council, Washington DC [Google Scholar]
- Kessler FK, Kessler MR, Auyeung DJ, Ritter JK. (2002) Glucuronidation of acetaminophen catalyzed by multiple rat phenol UDP-glucuronosyltransferases. Drug Metab Dispos 30:324–330 [DOI] [PubMed] [Google Scholar]
- Leone TC, Weinheimer CJ, Kelly DP. (1999) A critical role for the peroxisome proliferator-activated receptor α (PPARα) in the cellular fasting response: the PPARα-null mouse as a model of fatty acid oxidation disorders. Proc Natl Acad Sci USA 96:7473–7478 [DOI] [PMC free article] [PubMed] [Google Scholar]
- Mackenzie PI, Bock KW, Burchell B, Guillemette C, Ikushiro S, Iyanagi T, Miners JO, Owens IS, Nebert DW. (2005) Nomenclature update for the mammalian UDP glycosyltransferase (UGT) gene superfamily. Pharmacogenet Genomics 15:677–685 [DOI] [PubMed] [Google Scholar]
- Mackenzie PI, Owens IS, Burchell B, Bock KW, Bairoch A, Bélanger A, Fournel-Gigleux S, Green M, Hum DW, Iyanagi T, et al. (1997) The UDP glycosyltransferase gene superfamily: recommended nomenclature update based on evolutionary divergence. Pharmacogenetics 7:255–269 [DOI] [PubMed] [Google Scholar]
- MacKenzie PI, Rogers A, Elliot DJ, Chau N, Hulin JA, Miners JO, Meech R. (2011) The novel UDP glycosyltransferase 3A2: cloning, catalytic properties, and tissue distribution. Mol Pharmacol 79:472–478 [DOI] [PubMed] [Google Scholar]
- Memon RA, Tecott LH, Nonogaki K, Beigneux A, Moser AH, Grunfeld C, Feingold KR. (2000) Up-regulation of peroxisome proliferator-activated receptors (PPAR-α) and PPAR-γ messenger ribonucleic acid expression in the liver in murine obesity: troglitazone induces expression of PPAR-γ-responsive adipose tissue-specific genes in the liver of obese diabetic mice. Endocrinology 141:4021–4031 [DOI] [PubMed] [Google Scholar]
- Newberry EP, Xie Y, Kennedy S, Han X, Buhman KK, Luo J, Gross RW, Davidson NO. (2003) Decreased hepatic triglyceride accumulation and altered fatty acid uptake in mice with deletion of the liver fatty acid-binding protein gene. J Biol Chem 278:51664–51672 [DOI] [PubMed] [Google Scholar]
- Osabe M, Sugatani J, Fukuyama T, Ikushiro S, Ikari A, Miwa M. (2008) Expression of hepatic UDP-glucuronosyltransferase 1A1 and 1A6 correlated with increased expression of the nuclear constitutive androstane receptor and peroxisome proliferator-activated receptor α in male rats fed a high-fat and high-sucrose diet. Drug Metab Dispos 36:294–302 [DOI] [PubMed] [Google Scholar]
- Ou Z, Huang M, Zhao L, Xie W. (2010) Use of transgenic mice in UDP-glucuronosyltransferase (UGT) studies. Drug Metab Rev 42:123–131 [DOI] [PMC free article] [PubMed] [Google Scholar]
- Radominska-Pandya A, Czernik PJ, Little JM, Battaglia E, Mackenzie PI. (1999) Structural and functional studies of UDP-glucuronosyltransferases. Drug Metab Rev 31:817–899 [DOI] [PubMed] [Google Scholar]
- Reisman SA, Yeager RL, Yamamoto M, Klaassen CD. (2009) Increased Nrf2 activation in livers from Keap1-knockdown mice increases expression of cytoprotective genes that detoxify electrophiles more than those that detoxify reactive oxygen species. Toxicol Sci 108:35–47 [DOI] [PMC free article] [PubMed] [Google Scholar]
- Sakada M, Tanaka A, Ohta D, Takayanagi M, Kodama T, Suzuki K, Inoue K, Fujita Y, Maruyama M. (2006) Severe steatosis resulted from anorexia nervosa leading to fatal hepatic failure. J Gastroenterol 41:714–715 [DOI] [PubMed] [Google Scholar]
- Sanyal AJ. (2011) NASH: a global health problem. Hepatol Res 41:670–674 [DOI] [PubMed] [Google Scholar]
- Schnell RC, Bozigian HP, Davies MH, Merrick BA, Park KS, McMillan DA. (1984) Factors influencing circadian rhythms in acetaminophen lethality. Pharmacology 29:149–157 [DOI] [PubMed] [Google Scholar]
- Senekeo-Effenberger K, Chen S, Brace-Sinnokrak E, Bonzo JA, Yueh MF, Argikar U, Kaeding J, Trottier J, Remmel RP, Ritter JK, et al. (2007) Expression of the human UGT1 locus in transgenic mice by 4-chloro-6-(2,3-xylidino)-2-pyrimidinylthioacetic acid (WY-14643) and implications on drug metabolism through peroxisome proliferator-activated receptor α activation. Drug Metab Dispos 35:419–427 [DOI] [PubMed] [Google Scholar]
- Shelby MK, Cherrington NJ, Vansell NR, Klaassen CD. (2003) Tissue mRNA expression of the rat UDP-glucuronosyltransferase gene family. Drug Metab Dispos 31:326–333 [DOI] [PubMed] [Google Scholar]
- Shelby MK, Klaassen CD. (2006) Induction of rat UDP-glucuronosyltransferases in liver and duodenum by microsomal enzyme inducers that activate various transcriptional pathways. Drug Metab Dispos 34:1772–1778 [DOI] [PubMed] [Google Scholar]
- Sugatani J, Nishitani S, Yamakawa K, Yoshinari K, Sueyoshi T, Negishi M, Miwa M. (2005) Transcriptional regulation of human UGT1A1 gene expression: activated glucocorticoid receptor enhances constitutive androstane receptor/pregnane X receptor-mediated UDP-glucuronosyltransferase 1A1 regulation with glucocorticoid receptor-interacting protein 1. Mol Pharmacol 67:845–855 [DOI] [PubMed] [Google Scholar]
- Tukey RH, Strassburg CP. (2000) Human UDP-glucuronosyltransferases: metabolism, expression, and disease. Annu Rev Pharmacol Toxicol 40:581–616 [DOI] [PubMed] [Google Scholar]
- Wakabayashi N, Slocum SL, Skoko JJ, Shin S, Kensler TW. (2010) When NRF2 talks, who's listening? Antioxid Redox Signal 13:1649–1663 [DOI] [PMC free article] [PubMed] [Google Scholar]
- Walker RM, Massey TE, McElligott TF, Racz WJ. (1982) Acetaminophen toxicity in fed and fasted mice. Can J Physiol Pharmacol 60:399–404 [DOI] [PubMed] [Google Scholar]
- Williams JA, Hyland R, Jones BC, Smith DA, Hurst S, Goosen TC, Peterkin V, Koup JR, Ball SE. (2004) Drug-drug interactions for UDP-glucuronosyltransferase substrates: a pharmacokinetic explanation for typically observed low exposure (AUCI/AUC) ratios. Drug Metab Dispos 32:1201–1208 [DOI] [PubMed] [Google Scholar]
- Yaoi T, Jiang X, Li X. (2006) Development of a fluorescent microsphere-based multiplexed high-throughput assay system for profiling of transcription factor activation. Assay Drug Dev Technol 4:285–292 [DOI] [PubMed] [Google Scholar]
- Yeager RL, Reisman SA, Aleksunes LM, Klaassen CD. (2009) Introducing the “TCDD-inducible AhR-Nrf2 gene battery.” Toxicol Sci 111:238–246 [DOI] [PMC free article] [PubMed] [Google Scholar]
- Yueh MF, Tukey RH. (2007) Nrf2-Keap1 signaling pathway regulates human UGT1A1 expression in vitro and in transgenic UGT1 mice. J Biol Chem 282:8749–8758 [DOI] [PubMed] [Google Scholar]
- Zhang T, Haws P, Wu Q. (2004) Multiple variable first exons: a mechanism for cell- and tissue-specific gene regulation. Genome Res 14:79–89 [DOI] [PMC free article] [PubMed] [Google Scholar]
Associated Data
This section collects any data citations, data availability statements, or supplementary materials included in this article.


