

Abstract
To visualize the latter stages of cell division in live Escherichia coli, we have carried out fluorescence recovery after photobleaching (FRAP) on 121 cells expressing cytoplasmic green fluorescent protein and periplasmic mCherry. Our data show conclusively that the cytoplasm is sealed prior to the periplasm during the division event.
TEXT
All forms of life depend critically on the ability of cells to divide and multiply. In the Gram-negative bacterium Escherichia coli, division is carried out by a dynamic protein complex called the divisome. The divisome contains proteins that are localized in the cytoplasm, the inner membrane, the periplasm, and the outer membrane (5, 8). These proteins arrive at the future division site in a temporally controlled manner, starting with FtsZ in the cytoplasm (1, 6, 12, 13) and followed by a series of cytoplasmic and inner membrane proteins (3, 8, 9) and finally two transenvelope complexes (7, 16). Together, these proteins conduct a carefully orchestrated series of biochemical reactions that result in the contraction and scission of the mother cell into two daughter cells.
Although cell division in E. coli has been intensely studied for more than 50 years, we still do not have a complete framework for understanding the late stages of division. For instance, when does the outer membrane contract, and when is the periplasm closed off by the divisome? Electron microscopy images of dividing E. coli cells provide some insight into these processes, but the data are contradictory. Images taken by Burdett and Murray (4) indicate that the inner membrane (IM) and peptidoglycan layer (PG) invaginate first, and that the outer membrane follows at a later time point. On the other hand, images taken by Bi and Lutkenhaus (2, 11) suggest that the inner and outer membranes contract simultaneously during division. While both of these studies imply that the cytoplasm should be sealed before the periplasm, this point has not been unequivocally resolved.
To gain insight into the continuity of the cytoplasm and the periplasm during division, we have analyzed cytoplasmic green fluorescent protein (GFP) and periplasmic red fluorescent protein (mCherry) in cells undergoing division (Fig. 1A). mCherry was fused to the TorA signal sequence and thereby targeted to the periplasm through the twin-arginine translocation (Tat) pathway, as described previously (15). To confirm the cellular location of GFP and mCherry, we imaged the cells by confocal fluorescence microscopy. GFP fluorescence was confluent throughout the cell, as expected for a protein localized in the cytoplasm (Fig. 1B). In contrast, mCherry fluorescence was observed as a halo as described previously (15), indicating that it was localized to the periplasm (Fig. 1B). Of the 40 cells that we analyzed, we did not detect any containing mCherry fluorescence that was confluent throughout the cell. In comparison, when we expressed TorA-mCherry in a strain deleted for the Tat translocation pathway, we did observe mCherry fluorescence that was confluent throughout the cell (Fig. 1C). These experiments clearly indicate that TorA-mCherry was effectively targeted to the periplasm in wild-type cells.
Fig 1.
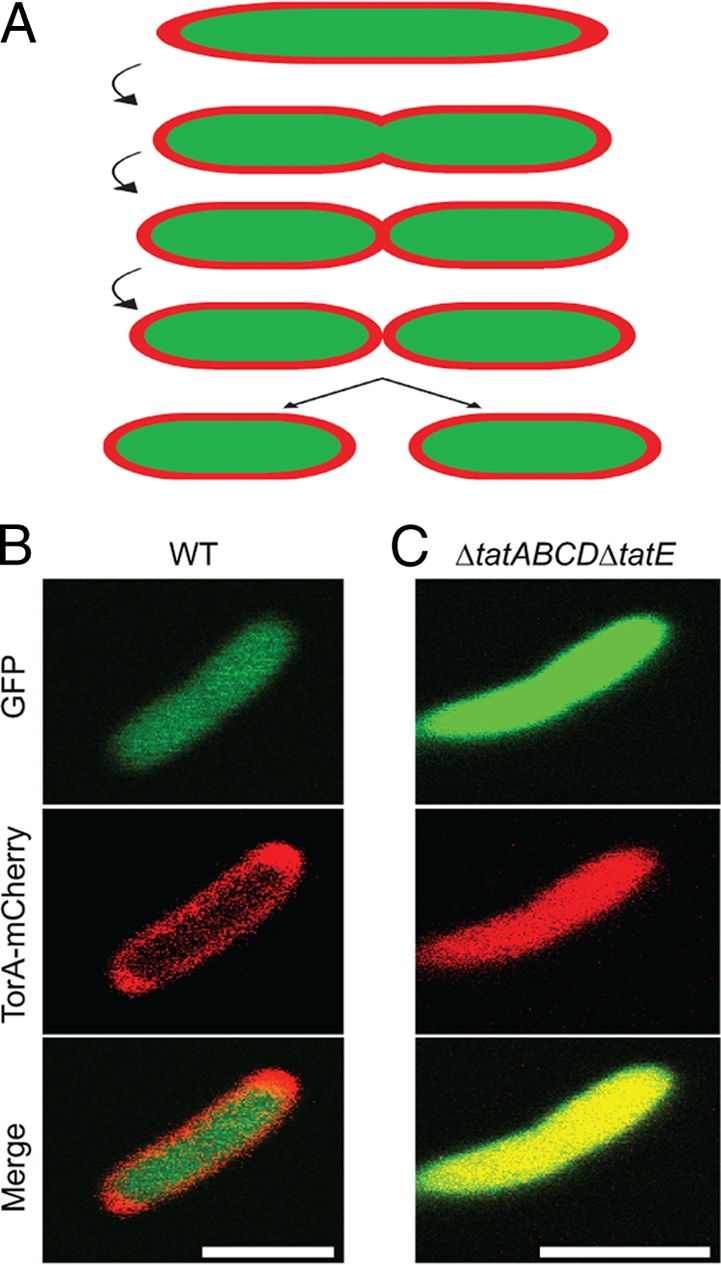
(A) Hypothetical model for contraction and scission of the cell envelope during cell division in E. coli. (B) E. coli cells expressing GFP (green) and TorA-mCherry (red) were imaged by confocal fluorescence microscopy. The green fluorescence was confluent throughout the cell, indicating a cytoplasmic localization of GFP, whereas the red fluorescence was in a halo formation, indicating a periplasmic localization of mCherry. (C) E. coli cells deleted for the Tat translocation pathway expressing GFP (green) and TorA-mCherry (red) were imaged by confocal fluorescence microscopy. Both the green and red fluorescence were confluent throughout the cell, indicating a cytoplasmic localization of GFP and mCherry in this cell strain. Scale bars, 2 μm.
When inspecting images of cells undergoing division (i.e., cells that were elongated and that contained a visible division septum), we noted that there were some cells with what appeared to be a sealed cytoplasm and a continuous periplasm (Fig. 2A), suggesting that the cytoplasm is sealed prior to the periplasm. Intriguingly, the division septum was difficult to visualize from the fluorescence of mCherry alone, suggesting that the invagination of the outer membrane lagged behind that of the inner membrane. These images were taken with a larger pinhole, which was compatible with fluorescence recovery after photobleaching (FRAP) measurements (see the methods in the supplemental material), therefore it was not possible to image mCherry in a halo formation.
Fig 2.

(A) E. coli cells expressing cytoplasmic GFP (green) and periplasmic mCherry (red) were imaged by confocal fluorescence microscopy. In cells undergoing division, we could detect cases where the cytoplasmic compartment appeared closed and the periplasmic compartment open. Due to the size of the pinhole needed to obtain enough fluorescence for FRAP, the mCherry halo was not visible in these images. The quantification of the fluorescence intensity across the septum confirmed the visual observations. (B to D) FRAP of the fluorescent molecules in one half of the dividing cell was monitored over time. Images were taken before photobleaching (t = −2 s), immediately after photobleaching (t = 0 s), and after a recover period of 8 s (t = 8 s). Fluorescence recovery in the bleached half of the cell was normalized to the total amount of remaining fluorescence (graph on the right). (B) Cells that have both a continuous cytosol and periplasm. (C) Cells that are completely sealed. (D) Cells that have an open periplasm and a closed cytoplasm. Scale bars, 2 μm. a.u., arbitrary units.
To substantiate the observation that the cytoplasmic compartment is sealed prior to the periplasm, we used a FRAP approach (14). The cytoplasmic GFP and the periplasmic mCherry were simultaneously irreversibly bleached on one side of the division septum, and the equilibration of the remaining unbleached GFP and mCherry molecules through the septum was followed over time. The rationale behind this experiment is that a closed compartment will not enable fluorescence recovery, whereas an open compartment will. Based on an analysis of 121 dividing cells, we observed three distinct behaviors: (i) in 67% of cells, both the cytoplasmic and the periplasmic compartments were open across the septum as fluorescence for GFP and mCherry recovered (Fig. 2B); (ii) in 23% of cells, both the periplasmic and the cytoplasmic compartments were closed as fluorescence for both mCherry and GFP did not recover (Fig. 2C); (iii) in 10% of cells, the periplasmic compartment was open as fluorescence for mCherry recovered, whereas the cytoplasmic compartment was closed as GFP fluorescence did not recover (Fig. 2D). In contrast to cells where both compartments were open, we did not see the complete fluorescence recovery of mCherry in those cells where the cytoplasm had already closed (compared Fig. 2B to D). Further experimentation is required to determine the significance of this observation. Significantly, no cells were found in which the cytoplasmic compartment was open but the periplasmic compartment was closed. We thus can discard the null hypothesis that there is no preferential order in which the periplasm and the cytoplasm lose continuity (the probability [p] of seeing 12 cells with a given compartment closing before the other and no cells where the opposite is true, under the null hypothesis that both compartments are equally likely to close first, is p = 2 · 0.512 = 5 · 10−4). Assuming that the cells we observed represent a snapshot of a steady-state population of dividing cells, we estimate that the state where only the periplasm is open represents ∼10% of the division process (i.e., the total time from the appearance of a visible septum to the formation of two visibly separated cells).
The data presented here show unambiguously that the divisome seals the cytoplasm prior to the periplasm during cell division in E. coli. Although most models of cell division in E. coli assume this situation, it has not previously been demonstrated. The same fundamental principle has been proposed for Caulobacter crescentus based on cryoelectron microscopic tomography and a two-color FLIP experiment (10). However, the fluorescence loss in photobleaching (FLIP) data in that study included only three cells with an open periplasm and a closed cytoplasm, which did not allow a statistically significant conclusion to be drawn. Our observations provide a framework for understanding and modeling the latter stages of cell division in E. coli. Further work is required to visualize other intermediate stages of division and thereby fully understand the timing and mechanism of cell envelope contraction.
Supplementary Material
ACKNOWLEDGMENTS
We thank Jan Willem de Gier (Stockholm University) for the pSB3398 vector, Colin Robinson (University of Warwick) for the strain MC4100 ΔtatABCDΔtatE, and the ALM Bioimaging platform at the Science for Life Laboratory, Stockholm, Sweden.
This work was supported by grants from the Swedish Foundation for Strategic Research to G.V.H. and the Swedish Research Council to G.V.H. and D.O.D.
Footnotes
Supplemental material for this article may be found at http://jb.asm.org/.
Published ahead of print 18 November 2011
REFERENCES
- 1. Adams DW, Errington J. 2009. Bacterial cell division: assembly, maintenance and disassembly of the Z ring. Nat. Rev. Microbiol. 7:642–653 [DOI] [PubMed] [Google Scholar]
- 2. Bi EF, Lutkenhaus J. 1991. FtsZ ring structure associated with division in Escherichia coli. Nature 354:161–164 [DOI] [PubMed] [Google Scholar]
- 3. Buddelmeijer N, Beckwith J. 2002. Assembly of cell division proteins at the E. coli cell center. Curr. Opin. Microbiol. 5:553–557 [DOI] [PubMed] [Google Scholar]
- 4. Burdett ID, Murray RG. 1974. Electron microscope study of septum formation in Escherichia coli strains B and B-r during synchronous growth. J. Bacteriol. 119:1039–1056 [DOI] [PMC free article] [PubMed] [Google Scholar]
- 5. de Boer PA. 2010. Advances in understanding E. coli cell fission. Curr. Opin. Microbiol. 13:730–737 [DOI] [PMC free article] [PubMed] [Google Scholar]
- 6. Erickson HP, Anderson DE, Osawa M. 2010. FtsZ in bacterial cytokinesis: cytoskeleton and force generator all in one. Microbiol. Mol. Biol. Rev. 74:504–528 [DOI] [PMC free article] [PubMed] [Google Scholar]
- 7. Gerding MA, Ogata Y, Pecora ND, Niki H, de Boer PA. 2007. The trans-envelope Tol-Pal complex is part of the cell division machinery and required for proper outer-membrane invagination during cell constriction in E. coli. Mol. Microbiol. 63:1008–1025 [DOI] [PMC free article] [PubMed] [Google Scholar]
- 8. Goehring NW, Beckwith J. 2005. Diverse paths to midcell: assembly of the bacterial cell division machinery. Curr. Biol. 15:R514–526 [DOI] [PubMed] [Google Scholar]
- 9. Goehring NW, Gonzalez MD, Beckwith J. 2006. Premature targeting of cell division proteins to midcell reveals hierarchies of protein interactions involved in divisome assembly. Mol. Microbiol. 61:33–45 [DOI] [PubMed] [Google Scholar]
- 10. Judd EM, et al. 2005. Distinct constrictive processes, separated in time and space, divide caulobacter inner and outer membranes. J. Bacteriol. 187:6874–6882 [DOI] [PMC free article] [PubMed] [Google Scholar]
- 11. Lutkenhaus J. 1993. FtsZ ring in bacterial cytokinesis. Mol. Microbiol. 9:403–409 [DOI] [PubMed] [Google Scholar]
- 12. Margolin W. 2005. FtsZ and the division of prokaryotic cells and organelles. Nat. Rev. Mol. Cell Biol. 6:862–871 [DOI] [PMC free article] [PubMed] [Google Scholar]
- 13. Mingorance J, Rivas G, Velez M, Gomez-Puertas P, Vicente M. 2010. Strong FtsZ is with the force: mechanisms to constrict bacteria. Trends Microbiol. 18:348–356 [DOI] [PubMed] [Google Scholar]
- 14. Strömqvist J, Skoog K, Daley DO, Widengren J, von Heijne G. 2010. Estimating Z-ring radius and contraction in dividing Escherichia coli. Mol. Microbiol. 76:151–158 [DOI] [PMC free article] [PubMed] [Google Scholar]
- 15. Thomas JD, Daniel RA, Errington J, Robinson C. 2001. Export of active green fluorescent protein to the periplasm by the twin-arginine translocase (Tat) pathway in Escherichia coli. Mol. Microbiol. 39:47–53 [DOI] [PubMed] [Google Scholar]
- 16. Typas A, et al. 2010. Regulation of peptidoglycan synthesis by outer-membrane proteins. Cell 143:1097–1109 [DOI] [PMC free article] [PubMed] [Google Scholar]
Associated Data
This section collects any data citations, data availability statements, or supplementary materials included in this article.