Abstract
Using an enhanced RNA-Seq pipeline to analyze Epstein-Barr virus (EBV) transcriptomes, we investigated viral and cellular gene expression in the Akata cell line following B-cell-receptor-mediated reactivation. Robust induction of EBV gene expression was observed, with most viral genes induced >200-fold and with EBV transcripts accounting for 7% of all mapped reads within the cell. After induction, hundreds of candidate splicing events were detected using the junction mapper TopHat, including a novel nonproductive splicing event at the gp350/gp220 locus and several alternative splicing events at the LMP2 locus. A more detailed analysis of lytic LMP2 transcripts showed an overall lack of the prototypical type III latency splicing events. Analysis of nuclear versus cytoplasmic RNA-Seq data showed that the lytic forms of LMP2, EBNA-2, EBNA-LP, and EBNA-3A, -3B, and -3C have higher nuclear-to-cytoplasmic accumulation ratios than most lytic genes, including classic late genes. These data raise the possibility that at least some lytic transcripts derived from these latency gene loci may have unique, noncoding nuclear functions during reactivation. Our analysis also identified two previously unknown genes, BCLT1 and BCRT2, that map to the BamHI C-region of the EBV genome. Pathway analysis of cellular gene expression changes following B-cell receptor activation identified an inflammatory response as the top predicted function and ILK and TREM1 as the top predicted canonical pathways.
INTRODUCTION
Epstein-Barr virus (EBV) is a human pathogen that causes malignancies including Burkitt's lymphoma, Hodgkin's disease, and nasopharyngeal carcinoma (13). EBV has a complex infection cycle involving a number of different viral gene expression programs. These individual programs facilitate distinct tasks that are required for specific infection stages. Like all herpesviruses, EBV utilizes both latent gene expression programs, in which only limited numbers of viral genes are expressed, and a replicative gene expression program, in which the bulk of EBV genes are expressed to produce infectious virus.
Efficient and synchronous virus reactivation can be modeled by activating the B-cell receptor (BCR) in the EBV-positive Burkitt's lymphoma cell line Akata (15). In this system, reactivation leads to an ordered induction of immediate-early (e.g., BZLF1 and BRLF1), early (e.g., BMRF1), and late genes, with immediate-early genes peaking at approximately 2 to 6 h and late genes peaking at approximately 6 to 24 h postinduction (6, 15, 20). Interestingly, Yuan et al. (20) found that EBV latency genes were induced following reactivation, suggesting a role for these genes in the lytic cycle (20).
Second-generation RNA-Seq technology allows the simultaneous interrogation of gene expression and transcript structure at a high level of accuracy and at a single-nucleotide resolution. We have recently shown the application of RNA-Seq to the interrogation of EBV transcriptomes in two type I latency cell lines, Akata and Mutu I (11). Here we have improved our RNA-Seq pipeline and have applied it to the analysis of the EBV transcriptome during viral reactivation in the synchronous Akata BCR-mediated reactivation system.
MATERIALS AND METHODS
Cell culture.
All cells were grown in RPMI 1640 (Thermo Scientific, catalog no. SH30027) plus 10% fetal bovine serum (FBS; Invitrogen-Gibco, catalog no. 16000-069) with 0.5% penicillin and streptomycin (pen/strep; Invitrogen-Gibco, catalog no. 15070). Cells were grown at 37°C in a humidified, 5% CO2 incubator.
Lytic cycle induction.
Akata and Mutu I cells were grown to near saturation, at which time an equal volume of fresh RPMI (plus 10% FBS and 0.5% pen/strep) was added. The following day, cells were spun down and resuspended in an equal volume of freshly warmed RPMI (plus 10% FBS and 0.5% pen/strep) with or without 10 μg of anti-IgG (Akata) or anti-IgM (Mutu I)/ml. The cells were harvested 24 h after treatment and subjected to RNA extraction or protein isolation (for Western blot analysis).
RNA extraction.
Total RNA was prepared using an RNeasy minikit (Qiagen, catalog no. 74104) according to the vendor's protocol. Cytoplasmic and nuclear RNA were extracted with a Norgen Biotek cytoplasmic and nuclear RNA purification kit (catalog no. 21000) according to the vendor's protocol.
Western blot analysis.
After a single 1× phosphate-buffered saline (PBS) wash, the cells were immediately suspended in five pellet volumes of sodium dodecyl sulfate-polyacrylamide gel electrophoresis (SDS-PAGE) loading buffer (125 mM Tris [pH 6.80], 10% glycerol, 2% SDS, 5% 2-mercaptoethanol, 0.05% bromophenol blue) and boiled for 20 min to shear the genomic DNA. Protein concentrations were measured using a Bio-Rad protein assay kit (catalog no. 500-0006) according to the manufacturer's instructions. Equal weights of cell lysates were subjected to SDS-PAGE electrophoresis and transferred to nitrocellulose membranes. The blots were blocked for 30 min in a blocking buffer (0.05 M Tris, 0.138 M NaCl, 0.0027 M KCl [pH 8.0], and 0.1% Tween 20 at pH 8.0) containing 5% Bio-Rad blotting grade blocker nonfat dry milk (catalog no. 170-6404) and 1% FBS and then incubated with the primary antibody (in blocking buffer) overnight at 4°C. The blots were washed four times with PBS, incubated with the secondary antibody for 1 h, washed four more times with PBS, and then analyzed using a Li-Cor Odyssey infrared imaging system. Primary antibodies used were mouse anti-Zta (Argene, catalog no. 11-007), mouse anti-Rta (Angene, catalog no. 11-008), mouse anti-BMRF1 (Capricorn, catalog no. EBV-018-48180), and goat anti-Actin (Santa Cruz Biotechnology, Inc., catalog no. sc-1615). The secondary antibodies used were goat anti-mouse (Li-Cor/Odyssey, catalog no. 926-32220) and donkey anti-goat (Li-Cor/Odyssey, catalog no. 926-32224).
RNA sequencing.
RNA samples were poly(A) selected, and libraries were prepared using the Illumina TruSeq RNA sample preparation protocol (catalog no. RS-930-2001). Poly(A) selection was carried out on cytoplasmic RNA fractions prior to sequencing, while nuclear RNA fractions did not undergo poly(A) selection prior to sequencing. Two × 100-base paired-end sequencing was performed using an Illumina HiSeq instrument.
Real-time RT-PCR analysis.
First-strand synthesis was carried out with RNA samples using the SuperScript III first-strand synthesis system (Invitrogen, catalog no. 18080-051) using oligo(dT) primers. All real-time reverse transcription-PCR (RT-PCR) analyses were performed using an SsoFast EvaGreen Supermix (Bio-Rad, catalog no. 172) on a Bio-Rad CFX96 machine. PCRs were carried out using the following conditions: 95°C for 30 s, followed by 40 cycles of 95°C for 3 s and 60°C for 3 s. The expression of EBV transcripts was determined by the 2ΔΔCT method, in which CT is the threshold cycle. All primer sequences are shown in Table S1 in the supplemental material.
5′ RACE.
5′ RACE (rapid amplification of cDNA ends) was performed using a SMARTer RACE cDNA amplification kit from Clontech (catalog no. 634923) according to the manufacturer's protocol. Two primers were designed corresponding to different positions within each of the BCLT1 and BCRT2 loci (the primers are listed in Table S1 in the supplemental material). PCR products from reactions were cloned into the pCR4-TOPO vector and the inserts were Sanger sequenced to identify the start sites of BCLT1 and BCRT2.
Data analysis.
RNA-Seq reads were aligned to a human (hg19 assembly) plus EBV genome [B95-8-Raji (National Center for Biotechnology Information [NCBI] accession number NC_007605) index using Novoalign). Splice junctions were identified using TopHat (17) run on a human plus EBV genome Bowtie index. RPKM calculations (i.e., reads per kilobase of exon per million mapped reads) and genome coverage files (wiggle files) were generated using SAMMate (19). The Integrative Genomics Viewer (IGV) (14) was used to visualize sequence alignments, genomic annotations, and splice junctions. In the cytoplasmic fractions, the percentage of EBV or human reads were calculated by dividing the total number of EBV or human mapped reads by the sum of EBV and human mapped reads and then multiplying that value by 100. The numbers of reads mapping to exonic, intronic, and intragenic were determined using SAMMate with annotation files containing the coordinates of all human exons, all human introns, and all human intragenic blocks. The percentage of reads in each category was determined by dividing exonic, intronic, or intragenic regions mapped read numbers by the total number of mapped reads and multiplying by 100). Ingenuity pathway analysis (IPA; Ingenuity Systems, Inc.) was performed by inputting all cellular genes showing a >4-fold increase or decrease in expression following BCR activation. Input values were the log2 of relative expression.
Sequencing data accession number.
RNA-Seq data are available from the NCBI Short Read Archive under accession no. SRA047981.2.
RESULTS
We have previously reported a pipeline for EBV transcriptome analysis in the context of the human transcriptome using RNA-Seq (11). The pipeline was applied to whole-cell RNA preps from the type I latency cell lines Mutu I and Akata to illustrate the quantitative and qualitative value of RNA-Seq in assessing viral transcription. For the work described here, we have enhanced our approach to gain greater clarity in EBV transcriptome analysis. First, we have used 100-base sequencing reads (versus 50-base reads), and the sequencing was carried out on an Illumina HiSeq instrument (versus an Illumina GA2X) to increase the overall sequencing depth. Second, we have now adapted the pipeline to the EBV type I strain B95-8/Raji genome assembly (2) (versus the type II strain AG876 [3]) to achieve a more accurate read alignment for cells harboring this more common strain of virus. Third, for alignment purposes we have split the circular EBV genome between the BBLF2/3 and the BGLF3.5 lytic genes rather than at the terminal repeats so that LMP2 splicing events spanning the terminal repeats can be captured. Lastly, we have carried out nuclear and cytoplasmic fractionation to specifically isolate and analyze compartmentalized RNAs.
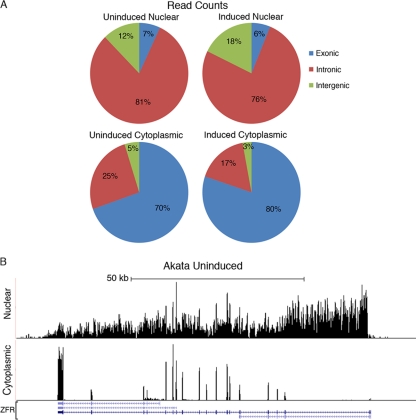
Nuclear and cytoplasmic RNAs were isolated from parallel cultures of Akata cells in which one culture was treated with an anti-human-IgG antibody (24 h) to induce BCR-mediated viral reactivation. Nuclear and cytoplasmic enrichment was considered good in all cases since we observed an ∼30-fold enrichment of the nuclear U2sn transcripts and the cytoplasmic actin transcripts by real-time RT-PCR (data not shown). Mapping of the sequencing reads from uninduced or induced Akata cells to the human genome showed that 81% and 76% of the nuclear reads mapped to introns and that 7% and 6% of the reads mapped to exonic regions, respectively (Fig. 1A). This is consistent with an abundance of unprocessed coding transcripts in the nucleus (note that for any single cellular gene, the total length of intron sequences is typically much greater than the total length of exon sequences). In contrast, 70% and 80% of the uninduced and induced cytoplasmic reads mapped to exons (Fig. 1A), indicating an abundance of completely processed transcripts. Figure 1B illustrates this difference in coverage across an individual cellular gene, ZFR.
Fig 1.
(A) Human exonic, intronic, and intragenic read distributions for uninduced and induced nuclear and cytoplasmic sequencing data. (B) Nuclear and cytoplasmic RNA-Seq coverage data at the human ZFR locus. The y axis is the number of reads spanning each genomic coordinate (x axis). Four known isoforms for ZFR are shown at the bottom of the figure. Thick lines represent coding sequences, medium thickness lines represent untranslated regions, and thin lines with leftward arrows represent introns.
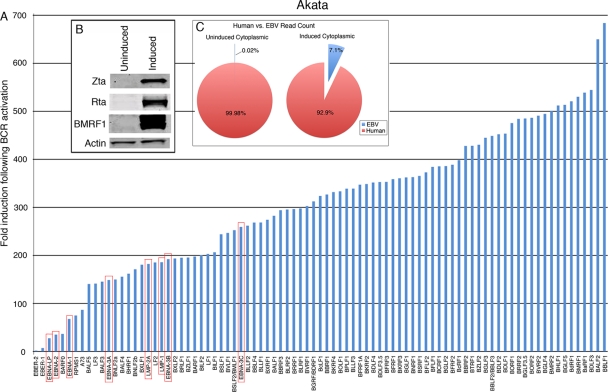
Prior to sequencing, we had determined that the level of induction was reasonable as assessed by Western blot analysis of the immediate-early and early Zta, Rta, and BMRF1 proteins (Fig. 2B). Quantitative analysis of the cytoplasmic RNA-Seq data showed robust induction of most viral genes, with the bulk of viral genes being induced 200- to 700-fold (Fig. 2). Consistent with previous microarray studies (20), we also observed the induction of latency genes, although the level of induction tended to be somewhat less than for most lytic genes (red-boxed genes in Fig. 2). Despite the high level of viral gene induction, we were still surprised to find that viral transcripts account for 7% of all polyadenylated cytoplasmic transcripts following induction (Fig. 2C). This is especially significant in light of the fact that the EBV genome is 1/25,000 the size of the human genome. These results are a testament to the significant redirection of the cellular transcriptional machinery to viral genes during reactivation.
Fig 2.
(A) Fold induction of EBV genes in cytoplasmic Akata fractions. Red boxes indicate latency genes. (B) Western blot analysis of the immediate-early and early Zta, Rta, and BMRF1 proteins performed as a quality control prior to sequencing of RNAs. (C) Percentages of human and EBV reads in uninduced and induced cytoplasmic Akata fractions.
Alternative splicing analysis of BZLF1 and BLLF1 lytic genes.
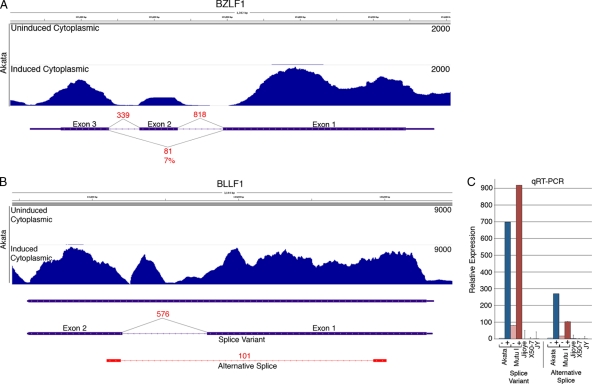
Following BCR activation, the immediate-early gene BZLF1 was induced 196-fold (Fig. 2). This level of induction is reflected in the coverage data showing nearly 2000 reads spanning some regions of the BZLF1 gene locus under induced conditions (Fig. 3A). Eight hundred eighteen and three hundred thirty-nine junction reads were found to span introns 1 and 2 of the BZLF1 gene, respectively. Eighty-one reads mapped to the exon 1-exon 3 junction, reflecting splicing of the BZLF1 inhibitory variant RAZ (7). Based on the relative numbers of junction spanning reads, we estimate that RAZ is expressed at ca. 7% of wild-type BZLF1 under these induced conditions.
Fig 3.
(A) Read coverage data (Novoalign) from uninduced and induced Akata cells and splicing evidence (from TopHat) from induced Akata cells are shown for the BZLF1/Zta locus. The y axis is the number of reads spanning each genomic coordinate (x axis). Thick lines represent coding sequences, medium thickness lines represent untranslated regions, and thin lines with leftward arrows represent introns. Evidence for the canonical BZLF1 splicing are represented by 818 and 339 reads spanning intron 1 and intron 2, respectively. Eighty-one reads spanning the exon 1-exon 3 splicing event correspond to the dominant-negative variant RAZ. (B) Coverage data and splicing evidence at the BLLF1 (gp350/gp220) locus show 101 reads spanning a novel splicing event. The peak within the annotated BLLF1 intron probably does not represent a stand-alone exon since no junction-spanning reads were identified at the peak edges. Instead, these reads are likely attributable to the unspliced version of BLLF1. (C) Relative expression of the BLLF1 splice variant and the alternative splice as determined by quantitative RT-PCR. RNAs from uninduced or induced Akata or Mutu I cells and from the type III latency cell lines Jijoye, X50-7, and JY are shown.
The lytic transcript BLLF1 encodes the glycoprotein 350/220, which binds to CR2/CD21 on the surface of B cells to initiate infection (9, 12, 16). After BCR activation, BLLF1 transcripts are increased 269-fold (Fig. 2), with coverage data showing nearly 9,000 reads across some regions of the BLLF1 locus following induction (Fig. 3B). Junction data showed ample evidence of the splice variant that gives rise to the gp220 isoform with 576 junction-spanning reads (Fig. 3B). High expression of this splice variant was also detected by quantitative RT-PCR following BCR-mediated reactivation in both Akata and Mutu I cells (Fig. 3C). In addition to the previously annotated splice variant, we also detected evidence of a new splice junction within the BLLF1 locus which is represented by 101 junction reads (Fig. 3B and see Fig. S1 in the supplemental material). Quantitative RT-PCR validated the expression of this new alternative splicing event in induced Akata and Mutu I cells (Fig. 3C). Consistent with this transcript originating from the BLLF1 promoter, splice donor/acceptor analysis of these junction reads by TopHat predicts this splicing event to occur in the leftward direction. The resulting transcript is therefore likely to encode a truncated BLLF1 variant encoding a 126-amino-acid protein product (see Fig. S2 in the supplemental material).
Alternative splicing of latency genes LMP1 and LMP2 following reactivation.
LMP1 transcript levels were increased 186-fold following induction (Fig. 2). Previous studies have shown the existence of a lytic promoter within intron 1 (8), and the RNA-Seq data shown in Fig. 4 nicely illustrates the existence of this alternative promoter following induction. Whereas in JY cells (type III latency), there is robust coverage throughout exon 1, and there are high numbers of junction reads spanning intron 1 and intron 2, there is only low coverage across exon 1 in induced Akata cells and substantially fewer junction reads (Fig. 4). These Akata data are consistent with activation of the lytic LMP1 RNA, with transcription initiated in intron 1 and low but detectable splicing of intron 2 (8) (Fig. 4). Notably, this lytic LMP1 transcript is noncoding in most EBV isolates, including Akata cells (4), and may therefore have a unique function in the EBV infection cycle.
Fig 4.
(A) Read coverage across the LMP1 locus illustrates the lytic LMP1 transcript structure in induced Akata cells and the classic type III latency LMP1 transcript structure in JY cells. The y axis is the number of reads spanning each genomic coordinate (x axis). Thick lines represent coding sequences, medium thickness lines represent untranslated regions, and thin lines with leftward arrows represent introns. Red values are the number of reads that span the indicated junctions. Coverage data were derived from Novoalign, and junction evidence was taken from TopHat. (B) Quantitative RT-PCR was used to determine the ratio of transcripts spanning exon 2 to exon 3 versus exon 1 to 2 in cytoplasmic fractions from uninduced or induced Akata cells and the type III latency cell lines JY, Jijoye, and X50-7.
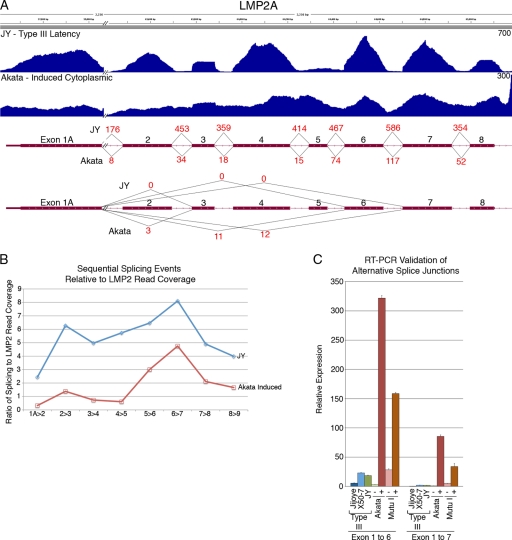
Following BCR activation in Akata cells, LMP2A transcript levels increase 182-fold (Fig. 2), as represented by the induced cytoplasmic coverage data (Fig. 5A). Nevertheless, there was relatively low evidence of classic splicing events compared to the type III latency JY cells (Fig. 5A). Consistent with this observation, there is substantial read coverage across the LMP2 introns in Akata compared to JY cells which show read coverage drop-offs across the introns (Fig. 5A). The low sequential splicing values observed in Akata cells is not due solely to a slightly lower read coverage, because quantification of splicing reads/LMP2 coverage reads shows greater values in JY cells than in Akata cells at each splice junction (Fig. 5B). These data indicate that while classic LMP2 splicing does occur in induced Akata cells, there is an abundance of incompletely spliced, polyadenylated LMP2 transcripts in the cytoplasmic RNA fraction. We also noted evidence of alternative splicing within the LMP2 locus that was not observed in JY cells (Fig. 5A). Splicing from exons 1 to 6 and exons 1 to 7 were validated by quantitative RT-PCR in induced Akata and Mutu I cells, and little evidence of these splicing events was observed in the type III cell lines Jijoye, X50-7, and JY (Fig. 5C). This indicates that these alternative splicing events are specific to lytic conditions and that they are not represented well in type III latency.
Fig 5.
(A) Unique coverage and splicing of LMP2 transcripts in induced Akata cells versus the type III cell line JY. The y axis is the number of reads spanning each genomic coordinate (x axis). Thick lines represent coding sequences, medium thickness lines represent untranslated regions, and thin lines with leftward arrows represent introns. Red values are the number of reads that span the indicated junctions. Coverage data were derived from Novoalign, and junction evidence was taken from TopHat. (B) Ratio of sequential splicing events to total coverage across LMP2 locus in induced Akata cells and JY cells. Total coverage calculation excluded regions of LMP2 which overlaps with BMRF1. (C) Real-time RT-PCR validation of alternative splicing in induced Akata and induced Mutu I cells.
Latency transcripts induced during reactivation have lower cytoplasmic-to-nuclear read ratios than most lytic genes.
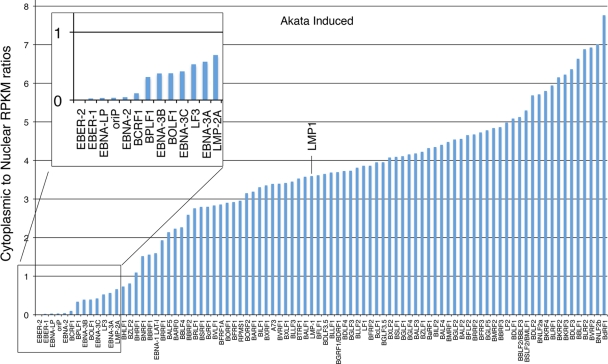
Considering the possibility that some of the latency transcripts, like LMP2, may have distinct functions during reactivation, we investigated the ratio of cytoplasmic-to-nuclear reads of all lytic and latent EBV genes following reactivation. Strikingly, while LMP1's cytoplasmic-to-nuclear RPKM ratios were similar to the bulk of lytic transcripts, the cytoplasmic-to-nuclear RPKM ratios for the latency transcripts LMP2A, EBNA-3A, EBNA-3B, EBNA3C, EBNA-2, and EBNA-LP were comparatively low (Fig. 6). This raises the possibility that some of these transcripts may have nuclear functions during reactivation.
Fig 6.
Higher nuclear retention of latency genes (sans EBNA1 and LMP1) than lytic genes following B-cell receptor activation in Akata cells.
Identification of the lytic transcripts BCLT1 and BCRT2.
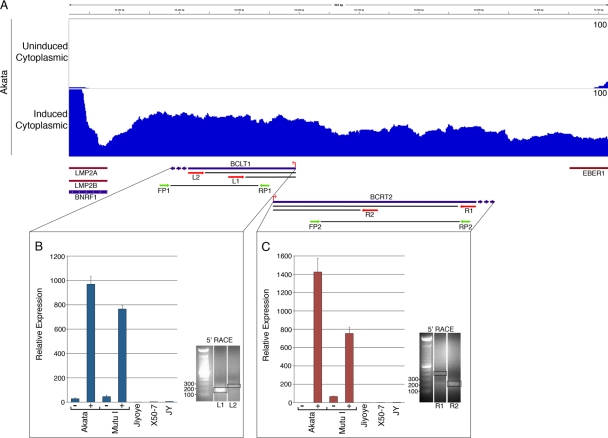
Although most of the EBV genome is annotated with gene structures, there remain a few regions with no known genes. We have noted that some of these regions are, in fact, transcribed following induction, as evidenced by the presence of reads. For example, we observed an abundance of reads between the end of the LMP2 gene and the beginning of the EBER1 gene (Fig. 7A). 5′ RACE identified two start sites in opposite orientations (Fig. 7B and C and see Fig. S3 in the supplemental material), indicating that there are at least two overlapping divergent transcripts in this region. Real-time RT-PCR analysis detected expression of both of these transcripts in induced Akata and Mutu I cells and not in Jijoye, X50-7, or JY cells (Fig. 7B and C). Analysis of the coding capacity of the leftward transcript shows no reading frames encoding more than 34 amino acids long, suggesting that this transcript is noncoding. The longest predicted reading frame for the rightward transcript is 72 amino acids. Based on this analysis, we are tentatively calling these transcripts BCRT2 (for BamHI C-fragment right transcript 2, therby distinguishing it from another rightward transcript, BCRF1) and BCLT1 (for BamHI C-fragment left transcript 1).
Fig 7.
(A) Coverage across new transcript region in induced Akata cells. Red arrows represent primers used for 5′ RACE. Green arrows represent PCR primers used for quantitative RT-PCR. (B) Real-time RT-PCR analysis (values are relative to the no-RT control in uninduced and induced conditions) of BCLT1 expression (B) and BCRT2 (C) and 5′ RACE identification of start sites. 5′ RACE products were cloned and sequenced. The start site was determined to be identical using either primer.
Cellular gene expression changes following BCR activation.
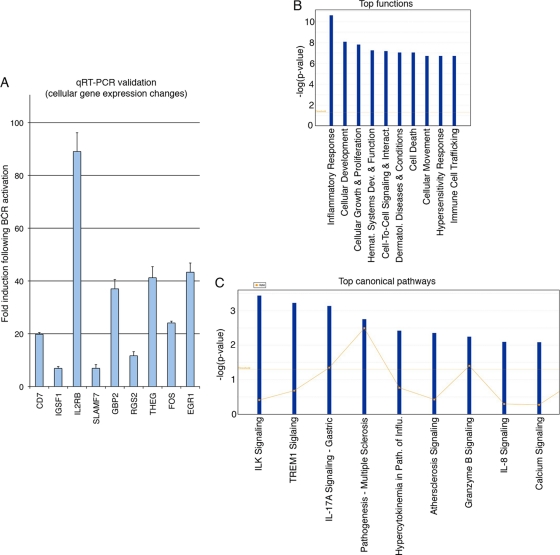
Cellular gene expression was analyzed in uninduced and induced Akata cells using cytoplasmic reads. A total of 148 expressed cellular genes were found to increase or decrease by 4-fold or more (for genes with RPKM values of 1 or more in at least one condition) (see Table S2 in the supplemental material). Nine of these were selected for validation by quantitative RT-PCR (Fig. 8A). A relatively good correspondence was observed between RNA-Seq data and quantitative RT-PCR, indicating that the RNA-Seq data were generally reliable. It should be noted, however, that quantitative RT-PCR measures levels of only a portion of the gene, whereas RNA-Seq measures an average of all isoforms of a gene which may account for some amplitude differences in the changes observed by the two methods. Notably, many early response genes, such as Fos and EGR1, are induced (see Table S2 in the supplemental material), consistent with BCR activation responses. In addition, there are a substantial number of immune regulatory factors whose levels change by >4-fold, including the quantitative RT-PCR-validated membrane signaling proteins CD7, IGSF1, IL2RB, SLAMF7, and GBP2 (Fig. 8A and see Table S2 in the supplemental material). Consistent with this finding, IPA of this 148-gene set found inflammatory response to have the highest significance (Fig. 8B). The pathways with the greatest predicted significance in this data set were ILK (integrin linked kinase) and TREM1 (triggering receptor expressed on myeloid cells 1) (Fig. 8C), indicating the alteration of these signaling pathways in BCR-activated B cells.
Fig 8.
(A) Quantitative RT-PCR validation of selected cellular gene changes following BCR activation. (B) Top cellular functions predicted to be influenced by expressed cellular genes with changes of >4-fold. (C) Top canonical pathways predicted to be influenced by expressed cellular genes with changes of >4-fold.
DISCUSSION
For the analysis performed here, we have generated the necessary tools to perform alignments and to visualize the data against the more common strain of EBV, type I. Accessory files required for the analysis of both type I and type II virus sequence data are available at www.flemingtonlab.com (files include fasta files, Bowtie index files, genome viewer annotation files, and annotation files for EBV RPKM analysis [for the analysis of either EBV alone or the analysis of EBV in the context of the human genome]). The development of these tools for the analysis of the type I EBV strain is important since it is a more common strain observed in tissue culture models and in vivo. For most of the EBV genome, reasonable alignment data can be obtained even when using sequencing data from a type I strain and aligning to a type II strain genome (11). Nevertheless, the capture of sequences from less well-conserved regions, such as the EBNA2 locus, requires the use of the appropriate genome strain during the alignment process (11; data not shown). Whether sequence variations within strains pose any alignment difficulties has not yet been tested, but since most alignment approaches allow for a limited number of mismatches, this is not likely to be a significant problem. Nevertheless, we have ongoing studies to sequence the Mutu I and Akata genomes to determine whether intrastrain differences cause inaccuracies at subregions of the EBV genome.
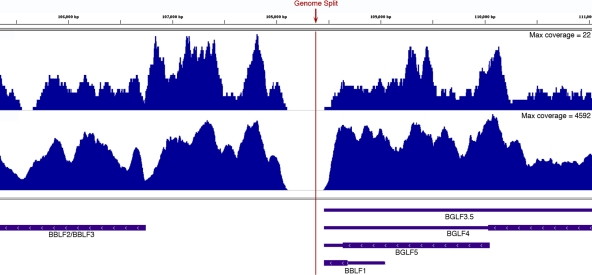
Nearly all RNA-Seq analysis tools have been developed for linear genomes since they are generally designed for the analysis of eukaryotic cellular organisms. The implementation of these tools to the analysis of circular genomes requires the artificial linearization of the respective genome at an arbitrary genome position. Although the terminal repeats represent a logical breakpoint for representation of EBV genome features in the NCBI database, it poses a problem for the analysis of reads spanning the terminal repeats and, more importantly, the LMP2 splicing events that span this region. For our analysis, we split the genome between the BBLF2/3 and BGLF3.5 genes. From our preliminary studies aligning against a genome that was split at the terminal repeats, we noted a natural depletion of reads between these two genes, and we did not detect any bona fide splicing events across this region in either uninduced or induced Akata cells (Fig. 9). We therefore tentatively recommend utilizing this genome configuration in EBV transcriptome analysis pipelines.
Fig 9.
Illustration of EBV genome coverage gap where the genome has been split for subsequent EBV RNA-Seq analysis.
Outside of the lytic LMP1 RNA, the structures of lytic transcripts derived from latency gene loci have not been previously probed in detail. Our more detailed analysis of lytic transcripts from the LMP2 loci shows a limited level of classic consecutive splicing events and an abundance of intron-spanning reads compared to type III latency cells. We also observed alternative splicing that was not observed in type III latency cells. Analysis of the exon 1-exon 6 splice and the exon 1-exon 7 splicing events reveals frameshifts at the splice junctions with termination codons located soon after the splice junctions (see Fig. S2 in the supplemental material). Assuming these transcripts are translated, they are predicted to encode 171- and 145-amino-acid peptides, respectively. These two alternative splicing events are also detected in BCR-activated Mutu I cells, indicating that these splicing events are not spurious anomalies specific to Akata cells. It is also interesting that the number of junction reads capturing the exon 1-exon 6 and the exon 1-exon 7 splicing events is slightly greater than the number of junction reads capturing the classic consecutive exon 1-exon 2 splicing event. Further, transcripts bearing these alternative splice junctions are localized in the cytoplasm and are polyadenylated, further indicating a function for these isoforms.
Considering the enriched localization of EBNA-3A, EBNA-3B, EBNA-3C, EBNA-2, EBNA-LP, and LMP2 transcripts in the nucleus (Fig. 6), we need to consider the possibility that some of these transcripts may perform noncoding functions in the nucleus. Cellular encoded long noncoding cellular RNAs (lncRNAs) have been shown to have profound influences on cellular reprogramming through their interactions with lineage specific promoters (10, 18). Many late genes do not contain response elements for the immediate-early transactivators Zta or Rta, but they are induced to very high levels through relatively unknown mechanisms. It is not hard to imagine the possible involvement of at least some of these nuclear latency transcripts in helping facilitate the high level of EBV promoter activation that is observed during reactivation. Another possible role for one or more of these nuclear transcripts could be to help facilitate lytic DNA replication and/or linking replication to late gene expression.
It is important to note that our analysis was performed using a 24-h time point. These data therefore represent a snapshot in the lytic cycle. We need to consider the possibility that some of the nuclear transcripts derived from at least some of these latency gene loci are simply late genes that have not yet been fully processed and exported to the cytoplasm. If this is the case, however, their localization is not representative of the bulk of late genes, such as BFRF2/3, BcLF1, BLLF1, BXLF2, and BKRF2, which clearly have high cytoplasmic-to-nuclear transcript ratios (Fig. 6). Yuan et al. (20) have shown that EBNA2, EBNA-3A, and EBNA-3C proteins are detected 2 days after BCR activation in Akata cells. This suggests the presence of enough appropriately processed and transported transcripts to be translated due to a high level of these latent transcripts at these time points or that there is a substantial delay in processing, possibly allowing for nuclear functions to occur before they become utilized as protein coding transcripts.
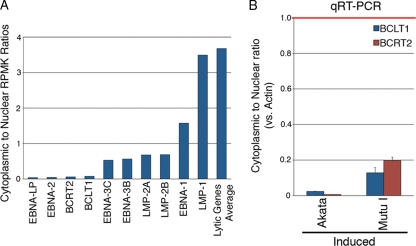
We have identified read coverage across a region between the end of the LMP2 gene and the EBER1 gene in induced Akata cells (Fig. 7). Using quantitative RT-PCR, we also detected evidence of transcription across this region in induced Mutu I cells but not in uninduced Akata or Mutu I cells or in the type III latency cell lines Jijoye, X50-7, or JY. Using 5′ RACE, we were able to determine that there are at least two overlapping, inversely oriented RNAs transcribed from this region (Fig. 7). We did not detect any significant reading frames for these predicted transcripts, so we tentatively assumed that they are of the long noncoding class of RNA transcripts. These transcripts are polyadenylated since our PCR and sequencing reactions detected them in poly(A)-selected RNA fractions (Fig. 7 and data not shown). We have analyzed these transcripts primarily using cytoplasmic RNA to help ensure that our results represent fully matured transcripts. However, the cytoplasmic-to-nuclear RPKM ratios for these transcripts are significantly lower than the average ratio for coding lytic genes (Fig. 10A). On the other hand, the cytoplasmic-to-nuclear ratios for BCRT2 and BCLT1 are in line with or lower than the ratios observed for most of the induced latency genes. Finally, we readily detect both BCRT2 and BCLT1 using oligo(dT)-primed RNA from the nuclear fraction, which is consistent with the presence of processed BCRT2 and BCLT1 in the nucleus (Fig. 10B). We therefore hypothesize that these newly identified transcripts play a noncoding role in the nucleus during reactivation.
Fig 10.
(A) Higher nuclear retention of BCRT2 and BCLT1 than the average of lytic genes following B-cell receptor activation in Akata cells. (B) Real-time RT-PCR validation of cytoplasmic to nuclear BCLT1 and BCRT2 transcript detection relative to actin RNA in induced Akata and Mutu I cells.
Analysis of anti-IgG-mediated changes in cellular genes identified a significant number of factors involved in regulating immune cell signaling and phenotype (Fig. 8; see also Table S2 and Fig. S4 in the supplemental material). This is consistent with a role of BCR signaling in facilitating cellular reprogramming. It is noteworthy, however, that although there are a substantial number of cellular genes that change by >4-fold, the level of induction of most of these are significantly below the level of induction of most viral lytic genes. This may partly explain the substantial fraction of reads mapping to EBV compared to the cellular genome following reactivation (Fig. 2). We can assume that some, if not many or most, of the induced cellular genes are induced through BCR-initiated signaling events rather than through virally encoded transcriptional activators. This is a testament to the clear bias that the virus has in the effective production of viral factors over the production of cellular factors.
From a practical standpoint, however, this observation is a little surprising given that the immediate-early transcription factor Zta can efficiently bind to cellular AP-1 sites (5). The relatively inefficient induction of cellular genes may be due to the lack of synergistically configured response elements to the second immediate-early transcription factor, Rta, which may cooperate with Zta in activating viral promoters. On the other hand, the viral chromatin may be modified in a more suitable configuration to accommodate robust induction of lytic genes (1). We suggest the possibility that there are chromatin-associated long noncoding viral RNAs that may help facilitate the recruitment of activating transcription complexes that may bind viral promoters through sequence complementarity. BCRT2 and BCLT1 are possible candidates in such processes and warrant further investigation.
Supplementary Material
ACKNOWLEDGMENTS
This study was supported by National Institutes of Health grants R01CA124311, R01CA130752, and R01CA138268 to E.K.F. and by a grant from the Ladies Leukemia League (http://ladiesleukemialeague.org/) to E.K.F.
Footnotes
Published ahead of print 16 November 2011
Supplemental material for this article may be found at http://jvi.asm.org/.
REFERENCES
- 1. Bhende PM, Seaman WT, Delecluse HJ, Kenney SC. 2004. The EBV lytic switch protein, Z, preferentially binds to and activates the methylated viral genome. Nat. Genet. 36:1099–1104 [DOI] [PubMed] [Google Scholar]
- 2. de Jesus O, et al. 2003. Updated Epstein-Barr virus (EBV) DNA sequence and analysis of a promoter for the BART (CST, BARF0) RNAs of EBV. J. Gen. Virol. 84:1443–1450 [DOI] [PubMed] [Google Scholar]
- 3. Dolan A, Addison C, Gatherer D, Davison AJ, McGeoch DJ. 2006. The genome of Epstein-Barr virus type 2 strain AG876. Virology 350:164–170 [DOI] [PubMed] [Google Scholar]
- 4. Erickson KD, et al. 2003. Unexpected absence of the Epstein-Barr virus (EBV) lyLMP-1 open reading frame in tumor virus isolates: lack of correlation between Met129 status and EBV strain identity. J. Virol. 77:4415–4422 [DOI] [PMC free article] [PubMed] [Google Scholar]
- 5. Farrell PJ, Rowe DT, Rooney CM, Kouzarides T. 1989. Epstein-Barr virus BZLF1 transactivator specifically binds to a consensus AP-1 site and is related to c-fos. EMBO J. 8:127–132 [DOI] [PMC free article] [PubMed] [Google Scholar]
- 6. Flemington EK, Goldfeld AE, Speck SH. 1991. Efficient transcription of the Epstein-Barr virus immediate-early BZLF1 and BRLF1 genes requires protein synthesis. J. Virol. 65:7073–7077 [DOI] [PMC free article] [PubMed] [Google Scholar]
- 7. Furnari FB, Zacny V, Quinlivan EB, Kenney S, Pagano JS. 1994. RAZ, an Epstein-Barr virus transdominant repressor that modulates the viral reactivation mechanism. J. Virol. 68:1827–1836 [DOI] [PMC free article] [PubMed] [Google Scholar]
- 8. Hudson GS, Farrell PJ, Barrell BG. 1985. Two related but differentially expressed potential membrane proteins encoded by the EcoRI Dhet region of Epstein-Barr virus B95-8. J. Virol. 53:528–535 [DOI] [PMC free article] [PubMed] [Google Scholar]
- 9. Hummel M, Thorley-Lawson D, Kieff E. 1984. An Epstein-Barr virus DNA fragment encodes messages for the two major envelope glycoproteins (gp350/300 and gp220/200). J. Virol. 49:413–417 [DOI] [PMC free article] [PubMed] [Google Scholar]
- 10. Khalil AM, et al. 2009. Many human large intergenic noncoding RNAs associate with chromatin-modifying complexes and affect gene expression. Proc. Natl. Acad. Sci. U. S. A. 106:11667–11672 [DOI] [PMC free article] [PubMed] [Google Scholar]
- 11. Lin Z, et al. 2010. Quantitative and qualitative RNA-Seq-based evaluation of Epstein-Barr virus transcription in type I latency Burkitt's lymphoma cells. J. Virol. 84:13053–13058 [DOI] [PMC free article] [PubMed] [Google Scholar]
- 12. Nemerow GR, Mold C, Schwend VK, Tollefson V, Cooper NR. 1987. Identification of gp350 as the viral glycoprotein mediating attachment of Epstein-Barr virus (EBV) to the EBV/C3d receptor of B cells: sequence homology of gp350 and C3 complement fragment C3d. J. Virol. 61:1416–1420 [DOI] [PMC free article] [PubMed] [Google Scholar]
- 13. Robertson ES. (ed). 2005. Epstein-Barr virus. Caister Academic Press, Norfolk, United Kingdom [Google Scholar]
- 14. Robinson JT, et al. Integrative genomics viewer. Nat. Biotechnol. 29:24–26 [DOI] [PMC free article] [PubMed] [Google Scholar]
- 15. Takada K, Ono Y. 1989. Synchronous and sequential activation of latently infected Epstein-Barr virus genomes. J. Virol. 63:445–449 [DOI] [PMC free article] [PubMed] [Google Scholar]
- 16. Thorley-Lawson DA, Geilinger K. 1980. Monoclonal antibodies against the major glycoprotein (gp350/220) of Epstein-Barr virus neutralize infectivity. Proc. Natl. Acad. Sci. U. S. A. 77:5307–5311 [DOI] [PMC free article] [PubMed] [Google Scholar]
- 17. Trapnell C, Pachter L, Salzberg SL. 2009. TopHat: discovering splice junctions with RNA-Seq. Bioinformatics 25:1105–1111 [DOI] [PMC free article] [PubMed] [Google Scholar]
- 18. Wang X, Song X, Glass CK, Rosenfeld MG. 2011. The long arm of long noncoding RNAs: roles as sensors regulating gene transcriptional programs. Cold Spring Harbor Perspect. Biol. 3:a003756. [DOI] [PMC free article] [PubMed] [Google Scholar]
- 19. Xu G, et al. 2011. SAMMate: a GUI tool for processing short read alignments in SAM/BAM format. Source Code Biol. Med. 6:2. [DOI] [PMC free article] [PubMed] [Google Scholar]
- 20. Yuan J, Cahir-McFarland E, Zhao B, Kieff E. 2006. Virus and cell RNAs expressed during Epstein-Barr virus replication. J. Virol. 80:2548–2565 [DOI] [PMC free article] [PubMed] [Google Scholar]
Associated Data
This section collects any data citations, data availability statements, or supplementary materials included in this article.


