

Abstract
Night Eating Syndrome is a common disorder in severely obese individuals and may be associated with hypothalamic pituitary adrenal (HPA) axis dysregulation. This study compared night eaters (NE) and comparably obese controls (C) pre- and post-Roux-en-Y Gastric Bypass surgery at 2 and 5 months, following an overnight fast on hormonal measures associated with HPA axis and related appetite and psychological measures. There were 24 (10 NE, 14 C) clinically severely obese participants (body mass index =47.0±8.4 SD). At pre-surgery baseline, afternoon fasting hunger ratings differed significantly and were lower for NE than for C (p=0.01). Eight of the participants (4 NE, 4C) returned for all 3 study visits. At 5 months post-surgery, NE and C did not differ in weight loss, reductions in waist circumference, insulin levels, and insulin resistance (homeostasis model assessment). However, NE as compared to C, did not improve in self ratings of body image (p<0.05), and had significant increases in fasting afternoon cortisol levels 5 months after surgery (p=0.01).
Keywords: Cortisol, insulin, body image, HPA-axis, weight loss surgery
INTRODUCTION
Night Eating Syndrome (NES) is multifaceted with disordered patterns of appetite, sleep, and hormones, as well as psychological symptoms that may involve the hypothalamic-pituitary-adrenal (HPA) axis (1). Plasma cortisol levels are higher in the evening in NES than in controls (C) (2), and may lead to an increase hunger (3, 4) and food intake (5). Chronically elevated cortisol levels are associated with elevated blood glucose and insulin levels (6), insulin resistance, increased abdominal fat (7, 8), higher waist circumference (WC) and waist-to-hip ratio (WHR), as well as increased visceral fat (9). However, NES itself has not been associated with elevated glucose, insulin, or insulin resistance (2), and it is not known whether NES is associated with higher WC and WHR. NES pre-bariatric surgery has been associated with eating-related cognitive disturbances (10). NES has also been associated with less weight loss in clinical programs (11, 12) and may not remit after bariatric surgery (13, 14).
In the current study, NE and C groups were compared prior to and following Roux-en-Y Gastric Bypass (RYGB) at 2 and 5 months on measures of body weight, WC, WHR, body image as well as the hormones, cortisol and insulin, associated with the HPA axis.
METHODS
Participants
Participants were 24 [22 females (f), 2 males (m)] severely obese patients [body mass index (BMI) of 40-70], aged 18-52, with only pre-menopausal women, under-going obesity surgery. None had diabetes mellitus, cardiac, liver, renal, or thyroid disease, serious mental disabilities or disorders, or binge eating disorder, and did not report abusing drugs, alcohol, or cigarettes. All were sedentary except for walking.
Night eating was assessed by the Night Eating Diagnostic Questionnaire (NEDQ) (12), based mainly on Stunkard’s criteria (2). Scoring distinguished between Normals, without any night eating criteria; N (mild sub-threshold NES) reporting 50% or more of food intake after the evening meal or after 7 p.m.; NE (sub-threshold NES) reporting 50% or more of food intake after the evening meal or after 7 p.m., and also reporting morning anorexia, or eating breakfast no more than 3 days/week; and those with NES, who exhibited these eating behaviors and reported night-time awakenings to eat. The 12 Normals and 2 N were combined as Controls (14 C), and the 8 NE and 2 NES were combined as night eaters (10 NE). Eight participants [4 C (4 f), 4 NE (1 m, 3 f)] returned for both post-surgical visits.
Procedures
All patients had RYGB by the same surgeon (LF), and the measures were collected following an overnight fast at 3 p.m., at pre-surgery baseline, then at 2 and 5 months post-operatively. These measures included body weight, waist and hip circumference, plasma cortisol (μg/dl), insulin (μU/ml), and glucose (mg/dl). Insulin resistance was calculated by homeostasis model assessment (HOMA) [fasting plasma glucose (mmol/l) × fasting serum insulin (mU/l)/22.5]. Hunger was rated from 1-100 using a Visual Analogue Scale (VAS). In addition, body image was estimated with a modified version of the Figure Rating Scale (FRS) (15) containing 9 silhouettes ranging in size from very thin to very obese, by extending the rating line for larger body images. Participants rated by number (10-90) their current body size (Current Body Image) and their ideal body size (Ideal Body Image). The difference between Current Body Image and Ideal Body Image was considered Discrepancy and provided an index of dissatisfaction. A linear regression equation was obtained between BMI (x) and Current Body Image ratings (y): y=0.465x+9.93. This equation was then used to calculate Distortion [Current Body Image in BMI (y)–actual BMI].
Statistical analysis
Analysis of covariance, controlling for gender, was used to determine the effect of night eating status on baseline variables. Mixed model analysis of variance between groups (NE vs. C) with repeated measures over the 3 time points: pre-operative baseline (T1), 2 months (T2), and 5 months (T3), was performed to assess change. The planned contrasts were (T1-T2) and (T1-T3). All statistical tests assumed a 2-sided Type 1 error of α=0.05, and 0.05<p<0.10 was reported as a trend.
RESULTS
In the initial sample, at pre-surgery baseline, age and BMI did not differ between NE and C, nor did any psychological or biological measure, except hunger ratings, which were significantly lower for NE than for C (p=0.01). The remaining results are for those participants who returned 3 and 5 months post-surgery. Again, pre-surgery baseline hunger ratings were significantly lower for NE than for C (p=0.04) in this subgroup. Additionally, Current Body Image showed a trend to be larger for NE than for C (p=0.06) (Table 1).
Table 1.
Measures at pre-surgery baseline (T1), at 2 months (T2), and 5 months (T3) post-surgery in the Night Eaters (NE) and Controls (C) (mean±standard error) as well as comparisons between T1-T2 and between T1-T3 (F and p values shown).
| Measures | T1 | T2 | T3 | Changes over periods |
Across all periods |
T1-T2 | T1-T3 | ||||
|---|---|---|---|---|---|---|---|---|---|---|---|
| F | P | F | P | F | P | ||||||
| BMI | All | 44.2±4.2 | 38.1±3.4 | 33.8±3.5 | All | 153.0 | <0.0005* | 280.2 | <0.0005* | 163.0 | <0.0005* |
| NE | 46.0±4.5 | 39.1±3.4 | 34.7±3.4 | NE vs. C | 1.3 | 0.31 | 4.0 | 0.092 | 1.21 | 0.31 | |
| C | 42.4±3.4 | 37±3.5 | 32.9±3.9 | ||||||||
| WC (cm) | All | 121.3±9.8 | 112.7±10.7 | 101.7±12.3 | All | 33.8 | <0.0001* | 8.8 | 0.03* | 50.2 | <0.0001* |
| NE | 122.8±11.7 | 112.5±11.3 | 101.9±12.9 | NE vs. C | 0.3 | 0.75 | 0.11 | 0.75 | 0.29 | 0.61 | |
| C | 119.7±8.9 | 113.0±11.7 | 101.5±13.8 | ||||||||
| WHR | All | 0.90±0.10 | 0.88±0.08 | 0.85±0.09 | All | 2.2 | 0.156 | 1.0 | 0.35 | 5.0 | 0.06** |
| NE | 0.86±0.07 | 0.84±0.09 | 0.81±0.10 | NE vs. C | 0.10 | 0.93 | 0.05 | 0.82 | 0.07 | 0.79 | |
| C | 0.94±0.12 | 0.92±.05 | 0.88±0.05 | ||||||||
| Cortisol (μg/dl) | All | 3.9±1.5 | 3.8±1.2 | 5.1±3.3 | All | 2.4 | 0.13 | 0.01 | 0.94 | 4.5 | 0.08 |
| NE | 4.1±1.9 | 3.7±1.4 | 7.4±3.4 | NE vs. C | 7.1 | 0.01* | 0.4 | 0.56 | 12 | 0.01* | |
| C | 3.7±1.3 | 3.9±1.1 | 2.9±0.8 | ||||||||
| Glucose (mg/dl) | All | 85.6±12 | 85.2±12.1 | 89.8±12 | All | 3.9 | 0.05* | 0.03 | 0.87 | 8.6 | 0.03* |
| NE | 90.5±13 | 86.2±14.5 | 90.3±12.6 | NE vs. C | 3.5 | 0.06** | 3.8 | 0.10 | 9.4 | 0.02* | |
| C | 80.7±9.1 | 84.3±11.3 | 89.3±13.2 | ||||||||
| Insulin (μU/ml) | All | 22.1±13 | 11.6±5.2 | 11.4±6.5 | All | 9.5 | 0.05* | 10.1 | 0.03* | 10 | 0.02* |
| NE | 26.5±15 | 12.3±7.0 | 12.1±8.2 | NE vs. C | 1.7 | 0.23 | 1.9 | 0.23 | 1.8 | 0.24 | |
| C | 16.3±7.5 | 10.7±2.4 | 10.4±4.8 | ||||||||
| Insulin resistance | All | 89.6±65 | 45.9±28.8 | 48.2±34.7 | All | 6.9 | 0.01* | 7.7 | 0.04 | 6.9 | 0.05* |
| NE | 112.7±80.0 | 50.3±38.5 | 51.7±42.1 | NE vs. C | 2.2 | 0.16 | 2.2 | 0.2 | 2.5 | 0.18 | |
| C | 58.9±25.0 | 40.0±13.1 | 43.6±28.2 | ||||||||
| Hunger | All | 53.6±27.0 | 58.6±29.1 | 25.7±16.2 | All | 5.1 | 0.03* | 0 | 0.97 | 22.0 | 0.01* |
| NE | **38.8±12.0 | 70.0±18.3 | 25±20.9 | NE vs. C | 3.9 | 0.06** | 4.7 | 0.08 | 6.5 | 0.05 | |
| C | **73.3±31.0 | 43.3±37.9 | 26.7±11.6 | ||||||||
| Current Body Image | All | 78.4±13.0 | 72.5±5.2 | 62.9±11.7 | All | 26 | <.0005* | 4.4 | 0.08 | 86 | <0.001* |
| NE | *86.8±9.6 | 74.5±6.4 | 70.8±8.3 | NE vs. C | 5.3 | 0.02* | 5.2 | 0.06** | 0.1 | 0.78 | |
| C | *70.0±11.0 | 70.5±3.3 | 55±9.1 | ||||||||
| Ideal Body Image | All | 40.6±9.8 | 40.9±8 | 39.6±9.9 | All | 0.30 | 0.77 | 0.32 | 0.059** | 1.6 | 0.24 |
| NE | 45±11 | 40±10.8 | 39.3±12.7 | NE vs. C | 5.0 | 0.03* | 8.7 | 0.03* | 4.1 | 0.09 | |
| C | 36.3±7.5 | 41.8±5.7 | 40±8.2 | ||||||||
| Body Image Discrepancy | All | 37.8±11 | 31.6±5.8 | 23.3±11.8 | All | 21 | <.0001* | 6.2 | 0.05* | 31.2 | 0.001* |
| NE | 41.8±13 | 34.5±7.1 | 31.5±11.4 | NE vs. C | 3.1 | 0.08 | 0.20 | 0.66 | 2.7 | 0.15 | |
| C | 33.8±7.5 | 28.8±2.5 | 15±4.1 | ||||||||
| Body Image Distortion | All | 2.17±5.6 | 5.57±2.88 | 5.39±4.37 | All | 5.1 | 0.03* | 5.6 | 0.06** | 5.9 | 0.05* |
| NE | 4.28±6.3 | 5.46±3.8 | 8.17±3.72 | NE vs. C | 3.2 | 0.08 | 2.4 | 1.7 | 0.30 | 0.63 | |
| C | 0.06±4.7 | 5.69±2.14 | 2.6±3.19 | ||||||||
BMI: body mass index; WC: waist circumference; WHR: waist/hip ratio.
Values of p≤0.05.
Values of p=0.06.
BMI decreased significantly for the whole cohort from T1-T2 and T1-T3 (p<0.0005) as did WC (p<.0001) without differing by group. However, WHR did not change significantly following surgery for the cohort and did not differ between groups (Table 1).
Plasma cortisol levels did not change significantly for the entire cohort; however from T1-T3, cortisol levels decreased for C, but increased for NE (p=0.01) (Fig. 1). Insulin levels (p=0.05) and insulin resistance (HOMA) (p=0.01) declined significantly for the cohort for both T1-T2 and T1-T3 without differing by group. Hunger decreased significantly for the cohort from T1-T3 (p=0.01), and differed between the groups (p=0.05) decreasing more in C than in NE (Table 1).
FIGURE 1.
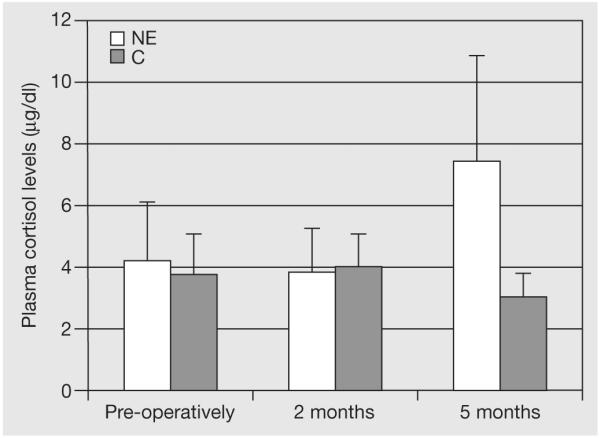
Fasting plasma cortisol levels (μg/dl) decreased in the controls (C) but increased in the Night Eaters (NE) between 2 and 5 months post-surgery (p=0.01). Mean±standard error.
Body Image Discrepancy (dissatisfaction) ratings decreased significantly for the cohort from T1-T2 and T1-T3 (p<0.001), with a trend toward decreasing more in C than in NE over the whole period (p=0.08). Body Image Distortion ratings increased significantly for the cohort (p=0.03), but showed a trend to differ between groups over the whole period, with Distortion increasing in NE and declining in C (p=0.08) (Table 1).
DISCUSSION
Pre-surgery, hunger ratings were lower in NE than C, consistent with a previous finding by our group (12), which appears to reflect reduced appetite in night eaters during the day, including the afternoon. Post-surgery, NE and C decreased similarly in weight and WC, and no longer differed in hunger, but differed in hormonal measures. The similarity in weight loss is consistent with Powers et al.’s (10) finding of comparable weight loss in night eaters and controls at 6 months post-operatively. Given similar weight loss, it was not surprising that insulin levels and insulin resistance, which decreased significantly for the whole cohort, also improved similarly in NE and in C post-surgery.
From 2 to 5 months post-surgery, cortisol levels declined in C but increased in NE. NE may have experienced weight loss as a stressor, which can elevate cortisol levels. Although daytime hunger declined for NE from 2 to 5 months post-operatively, a rise in cortisol may eventually lead to greater food intake (5) especially at night (10, 11).
Although body weight and WC reduction post-surgery did not differ between groups, perceptions of body image improved less in NE than C. From 2 to 5 months post-operatively, NE individuals had an increase in Body Image Distortion, viewing themselves as heavier than they really were. The NE failure to improve in Discrepancy (dissatisfaction) from 2-5 months post-operatively, despite similar reduction in weight and WC as C, may be related to the increasing body image distortion.
A limitation of the study is the small sample sizes, and therefore the findings should be considered preliminary. Overall, only C continued to improve in body image perception from 2-5 months post-surgery. The increase in cortisol levels in NE post-surgery may have been secondary to the stress of weight loss and also related to the greater body image distortion and discrepancy 2-5 mo post-op which can be a source of stress. This study suggests that increased cortisol levels and body dissatisfaction persist in those with NES following RYGB.
REFERENCES
- 1.Geliebter A. Night-eating syndrome in obesity. Nutrition. 2001;17:483–484. doi: 10.1016/s0899-9007(01)00550-0. [DOI] [PubMed] [Google Scholar]
- 2.Birketvedt GS, Florholmen J, Sundsfjord J, Osterud B, Dinges D, Bilker W, Stunkard A. Behavioral and neuroendocrine characteristics of the night-eating syndrome. J. Am. Med. Ass. 1999;282:657–663. doi: 10.1001/jama.282.7.657. [DOI] [PubMed] [Google Scholar]
- 3.Gluck ME, Geliebter A, Hung J, Yahav E. Cortisol, hunger, and desire to binge eat following a cold stress test in obese women with binge eating disorder. Psychosom. Med. 2004;66:876–881. doi: 10.1097/01.psy.0000143637.63508.47. [DOI] [PubMed] [Google Scholar]
- 4.Tataranni PA, Larson DE, Snitker S, Young JB, Flatt JP, Ravussin E. Effects of glucocorticoids on energy metabolism and food intake in humans. Am. J. Physiol. 1996;271:E317–E325. doi: 10.1152/ajpendo.1996.271.2.E317. [DOI] [PubMed] [Google Scholar]
- 5.Epel E, Lapidus R, McEwen B, Brownell K. Stress may add bite to appetite in women: a laboratory study of stress-induced cortisol and eating behavior. Psychoneuroendocrinology. 2001;26:37–49. doi: 10.1016/s0306-4530(00)00035-4. [DOI] [PubMed] [Google Scholar]
- 6.Dallman MF, Akana SF, Strack AM, Hanson ES, Sebastian RJ. The neural network that regulates energy balance is responsive to glucocorticoids and insulin and also regulates HPA axis responsivity at a site proximal to CRF neurons. Ann. N. Y. Acad. Sci. 1995;771:730–742. doi: 10.1111/j.1749-6632.1995.tb44724.x. [DOI] [PubMed] [Google Scholar]
- 7.Jayo JM, Shively CA, Kaplan JR, Manuck SB. Effects of exercise and stress on body fat distribution in male cynomolgus monkeys. Int. J. Obes. Relat. Metab. Disord. 1993;17:597–604. [PubMed] [Google Scholar]
- 8.BjÖrntorp P, Rosmond R. Neuroendocrine abnormalities in visceral obesity. Int. J. Obes. Relat. Metab. Disord. 2000;24(Suppl. 2):S80–S85. doi: 10.1038/sj.ijo.0801285. [DOI] [PubMed] [Google Scholar]
- 9.BjÖrntorp P. Abdominal fat distribution and disease: an overview of epidemiological data. Ann. Med. 1992;24:15–18. doi: 10.3109/07853899209164140. [DOI] [PubMed] [Google Scholar]
- 10.Powers PS, Perez A, Boyd F, Rosemurgy A. Eating pathology before and after bariatric surgery: a prospective study. Int. J. Eat. Disord. 1999;25:293–300. doi: 10.1002/(sici)1098-108x(199904)25:3<293::aid-eat7>3.0.co;2-g. [DOI] [PubMed] [Google Scholar]
- 11.Stunkard AJ, Grace WJ, Wolff HG. The night-eating syndrome; a pattern of food intake among certain obese patients. Am. J. Med. 1955;19:78–86. doi: 10.1016/0002-9343(55)90276-x. [DOI] [PubMed] [Google Scholar]
- 12.Gluck ME, Geliebter A, Satov T. Night eating syndrome is associated with depression, low self-esteem, reduced daytime hunger, and less weight loss in obese outpatients. Obes. Res. 2001;9:264–267. doi: 10.1038/oby.2001.31. [DOI] [PubMed] [Google Scholar]
- 13.Adami GF, Gandolfo P, Dapueto R, Jurich D, Scopinaro N. Eating behavior following biliopancreatic diversion for obesity: study with a three-factor eating questionnaire. Int. J. Eat. Disord. 1993;14:81–86. doi: 10.1002/1098-108x(199307)14:1<81::aid-eat2260140111>3.0.co;2-b. [DOI] [PubMed] [Google Scholar]
- 14.Rand CS, Macgregor AM, Stunkard AJ. The night eating syndrome in the general population and among postoperative obesity surgery patients. Int. J. Eat. Disord. 1997;22:65–69. doi: 10.1002/(sici)1098-108x(199707)22:1<65::aid-eat8>3.0.co;2-0. [DOI] [PubMed] [Google Scholar]
- 15.Stunkard AJ, SØrensen T, Schulsinger F. Use of the Danish Adoption Register for the study of obesity and thinness. Res. Publ. Assoc. Res. Nerv. Ment. Dis. 1983;60:115–120. [PubMed] [Google Scholar]