Abstract
The goal of preclinical fluorescence-enhanced optical tomography (FEOT) is to provide three-dimensional fluorophore distribution for a myriad of drug and disease discovery studies in small animals. Effective measurements, as well as fast and robust image reconstruction, are necessary for extensive applications. Compared to bioluminescence tomography (BLT), FEOT may result in improved image quality through higher detected photon count rates. However, background signals that arise from excitation illumination affect the reconstruction quality, especially when tissue fluorophore concentration is low and/or fluorescent target is located deeply in tissues. We show that near-infrared fluorescence (NIRF) imaging with an optimized filter configuration significantly reduces the background noise. Model-based reconstruction with a high-order approximation to the radiative transfer equation further improves the reconstruction quality compared to the diffusion approximation. Improvements in FEOT are demonstrated experimentally using a mouse-shaped phantom with targets of pico- and subpico-mole NIR fluorescent dye.
Keywords: fluorescence-enhanced optical tomography, excitation light rejection, simplified spherical harmonics approximations, finite element methods, reconstruction algorithm, parallel computation
Fluorescence-enhanced optical tomography (FEOT) can be confounded by effects of autofluorescence and a high “noise floor,” which arises from excitation light leakage through optical rejection filters. This high noise floor can obscure signals from low-concentration fluorophores in tissues and impact reconstruction quality. Because tissue autofluorescence peaks at visible wavelengths [typically, for example, the peak of mouse skin is 500 nm (Ref. 1)] and exponentially reduces with increase of wavelength, excitation in near-infrared (NIR) FEOT (excitation wavelengths ⩾750 nm) effectively removes the confounding artifact of tissue autofluorescence.2 Nonetheless, NIR FEOT is not immune to high noise floors owing to excitation light leakage. The performance deterioration of optical filters, including reduced and blueshifted optical densities of the interference filters, occurs when scattered excitation light is incident at non-normal directions.3 In addition to accurate measurements, model-based reconstruction methods require precise mathematical models to describe photon propagation and generation in tissues. Although the radiative transfer equation (RTE) is the choice of method, it is complicated and can impose severe time constrains for directly obtaining solutions in complex geometries as required for a rodent. Although the diffusion approximation (DA) has been extensively applied in optical tomography at its early stages in development, it becomes increasingly inaccurate in small volumes (such as a mouse) and under conditions of high absorption (such as in the rodent liver).
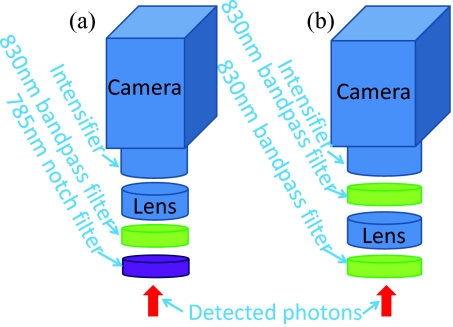
In this paper, we demonstrate that (i) experimental measurements optimized by simple filter configurations to reduce background signals and (ii) accurate models of light propagation together improve NIR FEOT. The measurement sensitivity and overall quality of NIR FEOT begins with the detector. Over the past decade, our group developed an intensified charge-coupled device (ICCD) camera system to realize frequency-domain, time-dependent, and continuous wave noncontact fluorescence measurements. In these experiments, one 785-nm notch filter and one 830-nm bandpass filter [Fig. 1a] were used to reject excitation light leakage while allowing collection of emission photons from human subjects under noninvasive imaging conditions following microdosing (<100 and >10 μg of ICG administrated to humans).4 Herein, we employed an optimized filter configuration, that is two 830-nm bandpass filters located before and after a 28-mm NIKKOR focusing lens [Fig. 1b] to further reduce background signal owing to excitation light leakage.
Figure 1.
(a) Unoptimized and (b) optimized filter configurations in the gain-modulated intensified detection system.
Using both configurations, phantom FEOT studies were conducted using a mouse-shaped solid phantom (Caliper Life Sciences, Hopkinton, Massachusetts). The scattering and absorption coefficients, anisotropic factor, and refractive factor of the phantom were taken to be 9.5 mm−1, 0.0066 mm−1, 0.9, 1.5 at 785 nm and 7.4 mm−1, 0.0077 mm−1, 0.9, 1.5 at 830 nm, respectively as provided by the manufacturer. ICG of 2 μmol/l, 0.5 μmol/l, and 0.125 μmol/l was sealed in plastic volumes of 2.35 mm3, and total molar quantities range from 4.7 to 0.29 pmol. The absorption coefficient of ICG was measured (Spectrophotometer DU800, Beckman Coulter, Brea, California), and for fluorescent targets in the phantom, we computed the absorption ratio of fluorophore to surrounding tissue (AR) to range 29.54–0.51. The ICG targets were then placed into a predrilled hole within the mouse phantom, and a rod comprised of the same material as the phantom was used to fill the remaining volume of the hole. Excitation light of 8.1 mW first illuminated an area of 2.0 × 2.0 mm2 on the dorsal surface while transmission fluorescence measurements were taken on the ventral view and, secondly, on the ventral surface while transmission fluorescence measurements were taken on the dorsal surface. The exposure times were fixed at 800 ms, and the gain of the intensifier (the voltage relevant to the gain ranges from 6.51 to 8.77 V) was adjusted to reach equivalent maximum fluorescent counts for each view. It is noteworthy that the increase of the gain does not affect the detected photon distribution, although it improves the sensitivity and reduces detectable dynamic range.
Using the simplified spherical harmonics approximation (SPN),5, 6 we previously developed a fully parallel linear reconstruction algorithm for bioluminescence tomography (BLT).7 In the algorithm developed herein, the reconstruction is significantly accelerated using parallel implementation in the cluster. The linear reconstruction framework is easily used in the combination of multispectral and multiview measurements to improve the reconstruction quality. In addition, we also extend our parallel reconstruction framework for NIR FEOT. In this reconstruction algorithm, we solve the following linear least-squares problem:
| (1) |
where J+, m, b is the measurable exiting partial current for emission (W mm−2); is the absorption coefficient (mm−1) of the fluorophore; is the upper bound constraint; and A denotes the linear relationship between J+, m, b and . When multiple emission measurements obtained from multiple excitations are used in reconstruction, J+, m, b and A consist of and where Nm denotes the total number of emission measurements and T is a transpose operator. In order to acquire , we use similar methods found in the literature7 for the SP3 emission approximation,
| (2) |
where is the submatrix corresponding to in the i-th SP3 equation when the finite element method is used and Bm is obtained by its components
| (3) |
where Ω is the domain for reconstruction; r is the location in Ω; vp, q are the shape functions; Q is the quantum efficiency of the fluorophore; and ϕx is the fluence of the excitation and is obtained by directly solving the SP3 excitation approximation when omitting the absorption coefficient of the fluorophore. After a series of matrix deductions from Eq. 2, can be obtained.7 Because of the ill-posed nature of A, several factors, such as measurement noise and mathematical model errors, significantly affect the reconstruction quality. Regularization methods have become popular to reduce the effect. In this work, we need to evaluate the effect of mathematical models in the reconstruction. Therefore, regularization term is not used in Eq. 1.
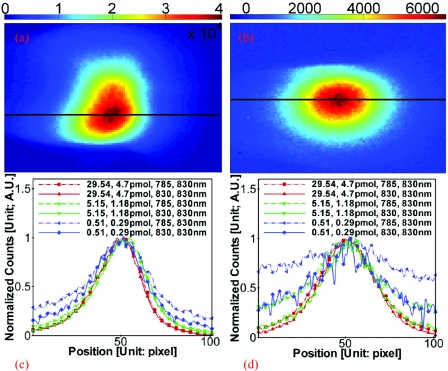
Figures 2a, 2b show the measured surface emission photon distribution from the dorsal and ventral projections, respectively, when the inclusion contained 4.7 pmol of ICG and two 830 nm filters were used. The profiles extracted along the lines shown in the top panels of Fig. 2 are shown in Figs. 2c (dorsal) and 2d (ventral) for the data from different filters and ICG target concentrations. Because of the nonlinear relationship between the intensifier gain and the count number on the camera and measurement noise, it is difficult to make the maximum photon count number of different measurements absolutely consistent. The intensity profiles were normalized to their respective maximal count number for comparison. One can find that the photon distribution changes with the reduction of the target concentration of ICG. Because of the fluorophore inclusion is closer to the dorsal side than the ventral side, the changes of the measured photon distribution on the latter are more distinct because more excitation photons compared to emission photons were detected. Note that the normalized intensity profiles arising from different target ICG concentrations and measured using the optimized filter configuration are more similar as compared to the counterparts from unoptimized filter configurations, showing the effectiveness of excitation light leakage rejection.
Figure 2.
Surface emission photon distribution measured from the (a) dorsal and (b) ventral projections when 4.7 pmol of ICG comprised the target within the mouse phantom. (c) and (d), corresponding to (a) and (b) respectively, are the photon distribution comparisons between different ARs, molar quantities, and filters. The profiles were through the peak of the emission photon distribution along the surface line shown in the top panels.
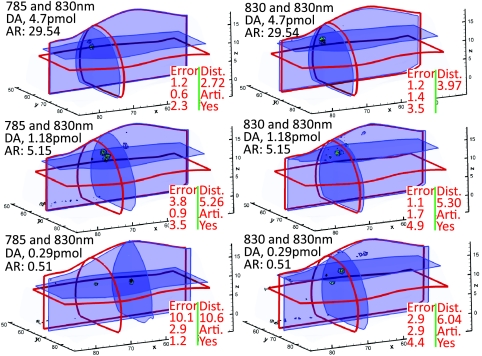
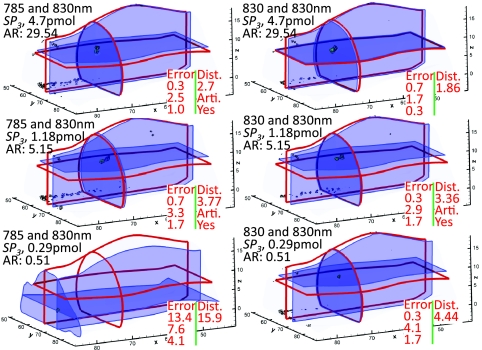
MicroCT scanning was performed to obtain phantom volume and position of the fluorescent target. The volumetric mesh of the phantom was generated for the reconstruction using the Amira 5.0 software (Mercury Computer Systems, Inc., Chelmsford, Massachusetts) and was composed of ∼25, 000 discretized points. Using a similar registration method in the literature,8 the measured surface emission distribution and incident excitation light were mapped onto the surface of the volumetric mesh. Reconstructions were performed on a cluster of eight nodes (8 CPU cores of 3.0 GHz and 16 GB RAM at each node), and 3000 data points (about 1300 and 1700 for the ventral and dorsal sides, respectively) were used in reconstruction and reconstruction iteration number was set to 3000. Figures 34 show the results from the DA- and SP3-based reconstruction, respectively. The DA-based reconstruction time reduced from 108.0 to 19.0 min, when the number of the CPU cores used increased from 1 to 45. It is noteworthy that the SP3-based reconstruction failed on one single node with one CPU core due to memory insufficiency. When 45 CPU cores were used, the reconstruction time was 30.0 min, close to the time required for the DA-based reconstruction, and showed good performance of the fully parallel reconstruction framework. Because of the noise factors, there are some reconstructed artifacts, as shown in Figs. 34. However, when the maximum reconstructed values were used to localize the fluorophore target, localization errors of the SP3-based reconstruction were found to be smaller than those obtained from DA, as shown in Figs. 34. When 0.29 pmol of ICG and 785 and 830-nm filters were used, the position of the ICG target was not localized using either of DA- and SP3-based results due to very large errors. However, when we used the optimized filter combination and SP3-based reconstruction, we obtained better localization of the target containing 0.29 pmol ICG.
Figure 3.
DA-based reconstruction comparisons between different filter configurations at varying target fluorophore molar quantities and ARs. Cross sections with thick and thin boundaries are the center positions of the actual (70.0, 65.5, 5.5) and reconstructed fluorophore targets (maximal values), respectively. The volumetric mesh denotes the top 80% of the contour levels of reconstructed fluorophore distribution. “Error” and “Dist.” denote relative errors (x, y, z in column) and distance (in column) between the actual and reconstructed positions. “Arti. Yes” denotes whether there are artifacts inside the phantom. (units: mm).
Figure 4.
SP3-based reconstruction comparisons between different filters, molar quantities, and ARs. The display settings are the same as those in Fig. 3.
In FEOT, the localization accuracy of the fluorophore target is decided by the photon distribution on the tissue surface and model-based reconstruction. In noncontact collection mode with moderately large fields of view where the optical filtering components are subjected to light with large incident angles, excitation light leakage has significant effect on the sensitivity of fluorescence detection and tomographic reconstruction. Because of the blueshifted characteristics, the single 785-nm notch filter in the unoptimized detection scheme did not effectively reject excitation light leakage. When the excitation photon leakage is comparable to the fluorescence signal as in the case of the fluorophore with low molar quantities and ARs, the reduction of the detection performance becomes distinct. In the optimized detection system, the 830-nm bandpass filter after the lens effectively reduces the blueshifted effect because of the collection of the focused light. In addition, because of the interference phenomena between two adjoining filters, the performance of two bandpass filters cannot be improved with a direct sum of their optical density (OD). Some loss materials are needed between filters to reduce the multiple-path interference. The focus lens plays this role, improving the performance of the combined filters. Although another potential solution to remove excitation light leakage is to obtain excitation photon distribution from the same settings before and after the fluorophore is injected, such an approach complicates the experiments since gain settings are not known until after fluorescent agent is injected. The approach becomes impossible when gene-encoded fluorescent reporters are used. With the optimized optical filtering, improved localization is obtained from the SP3-based image reconstruction. The reconstruction time is significantly reduced from the fully parallel reconstruction framework. The improved FEOT is particularly important for targeted molecular imaging as tissue disease markers are typically present in pico- to femto-molar quantities with low target-to-tissue absorption ratios. Although the tissue absorption has an important effect in emission photon detection, our results have shown that sub-pmol molar quantities of ICG with a little more than half the absorption of the surrounding tissues can be reconstructed using the improved FEOT. The work shows the potential of FEOT in the future applications.
Acknowledgments
This work is supported by NIH Grants No. R01CA135673 and No. U54CA136404, and a training fellowship from the Keck Center Computational Cancer Biology Training Program of the Gulf Coast Consortia (CPRIT Grant No. RP101489).
References
- Drakaki E., Borisova E., Makropoulou M., Avramov L., Serafetinides A. A., and Angelov I., “Laser induced autofluorescence studies of animal skin used in modeling of human cutaneous tissue spectroscopic measurements,” Skin Res. Technol. 13(4), 350–359 (2007). 10.1111/j.1600-0846.2007.00237.x [DOI] [PubMed] [Google Scholar]
- Adams K. E., Ke S., Kwon S., Liang F., Fan Z., Lu Y., Hirschi K., Mawad M. E., Barry M. A., and Sevick-Muraca E. M., “Comparison of visible and near-infrared wavelength-excitable fluorescent dyes for molecular imaging of cancer,” J. Biomed. Opt. 12, 024017 (2007). 10.1117/1.2717137 [DOI] [PubMed] [Google Scholar]
- Zhu B., Rasmussen J. C., Lu Y., and Sevick-Muraca E. M., “Reduction of excitation light leakage to improve near-infrared fluorescence imaging for tissue surface and deep tissue imaging,” Med. Phys. 37, 5961 (2010). 10.1118/1.3497153 [DOI] [PMC free article] [PubMed] [Google Scholar]
- Sevick-Muraca E. M., Sharma R., Rasmussen J. C., Marshall M. V., Wendt J. A., Pham H. Q., Bonefas E., Houston J. P., Sampath L., Adams K. E., Blanchard D. K., Fisher R. E., Chiang S. B., Elledge R., and Mawad M. E., “Imaging of lymph flow in breast cancer patients after microdose administration of a near-infrared fluorophore: feasibility study,” Radiology 246 (3), 734–741 (2008). 10.1148/radiol.2463070962 [DOI] [PMC free article] [PubMed] [Google Scholar]
- Klose A. D. and Larsen E. W., “Light transport in biological tissue based on the simplified spherical harmonics equations,” J. Comput. Phys. 220(1), 441–470 (2006). 10.1016/j.jcp.2006.07.007 [DOI] [Google Scholar]
- Chu M., Vishwanath K., Klose A. D., and Dehghani H., “Light transport in biological tissue using three-dimensional frequency-domain simplified spherical harmonics equations,” Phys. Med. Biol. 54, 2493−2509 (2009). 10.1088/0031-9155/54/8/016 [DOI] [PubMed] [Google Scholar]
- Lu Y., Machado H. B., Douraghy A., Stout D., Herschman H., and Chatziioannou A. F., “Experimental bioluminescence tomography with fully parallel radiative-transfer-based reconstruction framework,” Opt. Express 17, 16681–16695 (2009). 10.1364/OE.17.016681 [DOI] [PMC free article] [PubMed] [Google Scholar]
- Lu Y., Machado H. B., Bao Q., Stout D., Herschman H., and Chatziioannou A. F., “In vivo mouse bioluminescence tomography with radionuclide-based imaging validation,” Mol. Imaging Biol. 13, 53–58 (2011). 10.1007/s11307-010-0332-y [DOI] [PMC free article] [PubMed] [Google Scholar]


