

Abstract
In mammals, xanthine oxidoreductase can exist as xanthine dehydrogenase (XDH) and xanthine oxidase (XO). The two enzymes possess common redox active cofactors, which form an electron transfer (ET) pathway terminated by a flavin cofactor. In spite of identical protein primary structures, the redox potential difference between XDH and XO for the flavin semi-quinone/hydroquinone pair (Esq/hq) is ~170 mV, a striking difference. The former greatly prefers NAD+ as ultimate substrate for ET from the iron-sulfur cluster FeS-II via flavin while the latter only accepts dioxygen. In XDH (without NAD+), however, the redox potential of the electron donor FeS-II is 180 mV higher than that for the acceptor flavin, yielding an energetically uphill ET. Based on new 1.65, 2.3, 1.9 and 2.2 Å resolution crystal structures for XDH, XO, the NAD+- and NADH- complexed XDH, Esq/hq were calculated to better understand how the enzyme activates an ET from FeS-II to flavin. The majority of the Esq/hq difference between XDH and XO originates from a conformational change in the loop at positions 423-433 near the flavin binding site, causing the differences in stability of the semiquinone state. There was no large conformational change observed in response to NAD+ binding at XDH. Instead, the positive charge of NAD+ ring, deprotonation of Asp429 and the capping of the bulk surface of the flavin by the NAD+ molecule all contribute to alter Esq/hq upon NAD+ binding to XDH.
Xanthine oxidoreductase catalyzes the hydroxylation of either hypoxanthine to xanthine or xanthine to uric acid. In mammals, the enzyme is synthesized as xanthine dehydrogenase (XDH), its most prevalent form. It can, however, be converted to its xanthine oxidase (XO) form, either reversibly by disulfide formation or irreversibly by proteolytic cleavage, a transformation that plays important roles in physiological and pathological processes. In both forms, the enzyme is a homodimer of 290 kD and contains a variety of redox active cofactors, which line up to form the ET pathway. Electrons enter at the molyb-dopterin center and proceed via two Fe2S2 type iron-sulfur clusters, FeS-I and FeS-II, to the flavin adenine dinucleotide (FAD) cofactor (Figure 1).
Figure 1.

Cofactor arrangements in xanthine oxidoreductase. The 423-433 loops in the neighborhood of the flavin binding sites are depicted as pink (XDH) and green (XO) threads, respectively.
The most pronounced difference between XDH and XO is their terminal electron acceptor. XDH strongly prefers NAD+ over molecular oxygen, O2, while XO cannot bind NAD+ and therefore can only use O2 1, 2. Indeed, of all the redox active cofactors in the ET pathway, flavin is the only one that changes its redox properties significantly during the conversion from XDH to XO; in particular, the redox potential for the flavin semiquinone (sq)/hydroquinone (hq) pair (Esq/hq) is notably different. The Esq/hq values are −410 mV for XDH (at pH 7.5 3) and −234 mV for XO (at pH 7.7 4), thus resulting in an Esq/hq upshift of ~170 mV. The resulting ~170 mV difference implies that the flavin electrostatic environment is considerably different in the two enzymes. On the other hand, the apparently different protein environments of the two enzymes yield quite a similar value with regards to the redox potential for the oxidized flavin (ox)/semi-quinone pair (Eox/sq): −270 mV for XDH (at pH 7.5 3) and −332 mV for XO (at pH 7.7 4). Crystal structures of XDH and XO revealed that the two proteins differ in particular in the orientation of a loop region (Gln423-Lys433) near the flavin binding moiety 5. However, no additional highly refined information to the flavin energetics in the protein environment is available yet.
In XDH, the reduction of NAD+ occurs through the hq form of the flavin in a two electron (hydride) transfer process. To facilitate the formation of NADH, it is necessary to favour the hq form over the sq form. To achieve this goal, efficient ET from FeS-II to the flavin is also required. However, the Esq/hq value of −410 mV is much lower than the Em value of −235 mV for the electron donor FeS-II 3, yielding an energetically uphill ET (+175 meV). Note that ΔGET = −nFΔE ≈ − [Em(acceptor) − Em(donor)] [meV] where ΔGET < 0 or >0 describe an energetically downhill or uphill ET process, respectively (e.g., Ref. 6).
One way to achieve this goal could be that NAD+ binding to XDH changes the energetics of ET (reviewed in Ref. 7), e.g. by triggering a conformational change similar to the one observed in the 423-433 loop near the flavin binding site upon conversion from XDH to XO 5. Such a change might upshift Esq/hq from −410 mV to −230 mV (i.e., 180 mV upshift) and make ET from FeS-II (Em = −235 mV 3) to the flavin isoenergetic. The lack of crystal structures of nicotinamide dinucleotide complexes of XDH or XO, however, has left this question unanswered.
We now report the 1.65, 2.3, 1.9 and 2.2 Å resolution crystal structures of the bovine XDH, XO, and NAD+ and NADH complexes of XDH. One of the aims of the present study was to better understand the aspects of flavin-protein interaction, namely the factors that increase the Esq/hq difference up to ~170 mV as well as those that eliminate the Eox/sq difference in XDH and XO. The present crystal structures also provide the structural implication how NAD+ can bind close to FAD in a π-stacking geometry, which enables NAD+ to serve as an electron acceptor to FAD. Another major aim of the present study is, thus, to elucidate how the protein achieves an energetically uphill ET 7, 8 (based on the Em values for FeS-II and flavin in ligand-free XDH 3). To specifically focus on this point, although we had been able before to investigate the pH-dependence of the Em sufficiently well (for instance, see Refs. 9, 10), the present study describes the contributions of protein residues and cofactors to Esq/hq at pH 7.8, the pH value at which most biochemical measurements were performed (reviewed in Ref 11). The computational conditions and procedures used in our previous studies on flavin-containing proteins (e.g. flavodoxin 12, 13 and the BLUF domain 14) were also applied in the present study.
EXPERIMENTAL PROCEDURES
Crystallography
Bovine XDH and XO were purified from milk and crystallized as published 15. The XDH-NADH complex was prepared by soaking native XDH crystals for 1.5 h at room temperature in mother liquor containing 33 mM NADH. The XDH-NAD+ complex was generated by crystallizing XDH in the presence of 667 μM NAD+. Data for the XDH crystal were collected in two passes, a high- and a low-resolution pass, at beamline BL40B2 of the Spring-8 synchrotron, and in single passes for XO and the XDH-NADH complex on beamlinesBL17A and NW12A of the Photon Factory (Tsukuba), and for the XDH-NAD+ complex on beamline 14-BM-C at the Advanced Photon Source. Data were reduced using the program package HKL2000 16. The starting atomic model of XDH for refinement by CNS 17 was the one deposited in the PDB under access code 1FO4 5. The same structure was used as search model to determine the structures of the XDH complexes using the molecular replacement program EPMR 18. For the structure of the XO dimer the model 1FIQ and the program MOLREP 19 were used. Refinements were performed employing CCP4, version 6.1 20. Model building was done with the help of the programs O 21 and Coot 22. Atomic coordinates and structure factors have been deposited in the RCSB PDB under the access codes 3UNC for XDH, 3AX9 for XO, 3UNA for NAD+-bound XDH, and 3UNI for NADH-bounded XDH.
Atomic coordinates and charges
As basis for the computations, the high-resolution crystal structure of ligand-free bovine milk XDH (PDB) code 3UNC) and the structure of ligand-free XO (PDB code 3AX9) as well as the NADH- (PDB code 3UNA) and NAD+-complexed XDH (PDB code 3UNI) were used. The NADH-complexed XDH structure had to serve as a geometry template to model the NAD+ complex because when NAD+ is bound to oxidized XDH only the adenine half of the molecule is visible in the electron density map with the nicotinamide half highly mobile and invisible. Although the model of XDH complexed to NAD+ is missing the atoms of the nicotinamide, its ribose and the adjacent phosphate group, the two crystal structures essentially did not differ in the position/orientation of the flavin ring, the remaining parts of the NAD+/NADH molecules, and the loop 423-433 (backbone as well as side chains). Using the crystal structure of XDH complexed to NADH for calculations of the XDH structure complexed to NAD+ is, therefore, the best possible starting point and in part justified by structural evidence. Since under physiological conditions, NAD+ will not bind properly to XDH as long as the flavin is oxidized, the present procedure should be used only for calculations of the flavin sq/hq form.
The positions of the H atoms were energetically optimized with CHARMM 23 by using the CHARMM22 force field. During this procedure, the positions of all non-H atoms were fixed, and the standard charge states of all the titratable groups were maintained, i.e., basic and acidic groups were considered to be protonated and deprotonated, respectively. The two iron-sulfur Fe2S2 centers, FeS-I and FeS-II, were in the oxidized state and the flavin isoalloxazine ring was in the neutral charge state. All the other atoms whose coordinates were available in the crystal structure were not geometrically optimized.
Atomic partial charges of the amino acids were adopted from the all-atom CHARMM22 23 parameter set. The charges of the Fe2S2 iron-sulfur clusters were taken from Ref. 24 and the same as in our previous studies 25. The charges of the isoalloxazine ring of flavin were taken from our previous studies of flavin mononucleotide (FMN, FMN•−, and FMNH•: that correspond to FAD, FAD•−, and FADH•, respectively) in flavodoxins 12, 13 and the BLUF domains 14. The charges of the adenosine part of flavin were adopted from the all-atom CHARMM22 parameter set. The pyrophosphate parts of FAD and NAD+/NADH were treated as comprised of two independent phosphate titratable sites (Table S1 in the Supporting Information). For each titratable site, we prepared for both protonated and deprotonated states of the charges by referring to the diphosphate charge of the ATP and ADP entries in CHARMM. The charges of the molybdopterin center and nicotinamide NAD+/NADH were determined from the electronic wave functions by fitting the resulting electrostatic potential in the neighborhood of these molecules by using the restrained electrostatic potential (RESP) procedure 26. The electronic wave functions were calculated with the density functional (DFT) module in Gaussian03 27 by using the B3LYP functional with the LANL2DZ and 6-31+G** basis sets for Mo and other atoms, respectively (Tables S2 and S3 in the Supporting Information). The charges of the titratable phosphate group of the molybdopterin center were taken from our previous studies 12–14. All presented results were obtained in the presence of the Mo(VI) state.
Protonation pattern, redox potential, and pKa
The present computation is based on the electrostatic continuum model created by solving the linear Poisson-Boltzmann (LPB) equation with the MEAD program 28. To facilitate a direct comparison with previous computational results, we used identical conditions and parameters such as atomic partial charges and dielectric constants. To obtain the absolute redox midpoint potential values of the protein, we calculated the electrostatic energy difference between the two redox states in a reference model system using a known experimental Em value. The difference in the Em value of the protein relative to the reference system was added to the known Em value (see below). All other titratable sites, including the flavin pyrophosphate group, were fully equilibrated to the flavin redox state during the titration. The ensemble of the protonation patterns was sampled by the Monte Carlo (MC) method with Karlsberg 29 (Rabenstein, B. Karlsberg online manual, http://agknapp.chemie.fuberlin.de/karlsberg/ (1999)). The dielectric constants were set to εp = 4 inside the protein and εw = 80 for water. All computations were performed at 300 K, pH 7.8, and an ionic strength of 100 mM. The LPB equation was solved using a three-step grid-focusing procedure at resolutions of 2.5 Å, 1.0 Å, and 0.3 Å. The MC sampling yielded the probabilities [Aox] and [Ared] of the two redox states of molecule A. Em was evaluated using the Nernst equation. A bias potential was applied to obtain an equal amount of both redox states ([Aox] = [Ared]), thereby yielding the redox midpoint potential Em as the resulting bias potential. From this analogy, using the Henderson-Hasselbalch equation, the pKa can be calculated as the pH at which the concentrations of the protonated and deprotonated residue species are equal (Henderson-Hasselbalch pKa). For convenience, the computed Em value is given with mV accuracy, without implying that the last digit is significant. In general, an Em value of approximately 10 mV is a sufficiently reproducible range for the computational method used (e.g., 12–14, 25, 30).
pKa value in the reference model system
FAD•− forms FADH• upon protonation at the N5 nitrogen in FAD. The value of 8.6 31 was taken as the pKa(N5) value in the reference model system of FADH•/FAD•− equilibrium in aqueous solution. Experimentally measured pKa values of the pyrophosphate part of FAD and NAD+/NADH are not known. The values should be close to the values for pyrophosphoric acid; 0.85, 1.49, 5.77, and 8.22 (Stryer, L., (1988) Biochemistry 3rd edition, Appendix C). In the present study, the pyrophosphate parts of FAD and NAD+/NADH were treated as comprised of two independent phosphate titratable sites (Table S1 in the Supporting Information). Accordingly, we tentatively used the pKa value of 1.5 for each phosphate titratable site as the value in the reference system (i.e., isolated aqueous solution), derived from the pKa values of dimethyl- or dipropyl- phosphate 32. In XO, the two phosphate titratable sites of FAD were deprotonated. In XDH, however, phosphate titratable sites of the FAD diphosphate region distal and proximal to the flavin ring (distal and proximal phosphates) were deprotonated and protonated, respectively. In the NAD+ diphosphate region, one titratable site was deprotonated but the other largely protonated (by ~0.7 H+). The influence of the phosphate on Esq/hq in XDH and XO will be discussed in detail later. The value of 6.4 33 was considered as the pKa value in the molybdopterin-phosphate group (−H2PO3−/−HPO32−).
Calculation of Esq/hq as Em(FADH•/FADH−)
The Esq/hq value of −172 mV for free flavin measured by Draper and Ingraham with potentiometry 31 was used as the reference model system. Since protonation/deprotonation at the N1 nitrogen of the flavin isoalloxazine ring occurs at pKa = 6.7 in aqueous solution 31), the N1 site was considered to be deprotonated under the condition investigated. Note that the redox process for quinone is the simple addition of an electron in the pH-independent region where the protonation process can be ignored 34.
Calculation of Eox/sq as Em(FAD/FADH•)
The reaction involving FAD yielding FADH• that has an Em(FAD/FADH•) is the process in which one-electron reduction of FAD to FAD•− is coupled with protonation at the N5 nitrogen atom. Contribution of protonation/deprotonation at the N5 atom to Eox/sq cannot be ignored since pKa(N5) = 8.6 31. Indeed, Eox/sq shows a pH dependence of −60 mV/pH unit around pH 7.5 35. Therefore, one has to consider the energetics of both the “one-electron redox process” and the “one-proton protonation process” to accurately estimate the net energetics.
The potential of proton-coupled one-electron reduction can be written as follows:
| (eq. 1) |
where R is the gas constant, T is the temperature, and F is the Faraday constant (see Ref. 36).
To use eq. 1, the Em(FAD/FAD•−) value in aqueous solution as the reference model system is needed. By using Em(FAD/FADH•) = −238 mV at pH 7 and pKa(N5) = 8.6 31 (summarized in ref. 37), Em(FAD/FAD•−) = −333 mV was obtained from eq. 1. This value was used as the reference model system of Em(FAD/FAD•−) in aqueous solution.
Protein dielectric volume and treatment of water
The dielectric volume of a protein complex is the spatial area and shape of molecular components of the protein and includes the polypeptide backbone, side chains, and cofactors. As a general and uniform strategy, all of the crystallized water molecules were removed for our computations due to the lack of experimental information regarding the H atom positions. Cavities that formed after removal of the crystallized water molecules were uniformly filled with a dielectric solvent (εw = 80). By doing such, the effect of the removed water molecules was considered implicitly and a high value for the dielectric constant was assigned to these cavities (for evaluation of the dielectric constant in the protein, see discussion in the Supporting Information).
RESULTS AND DISCUSSION
1. XDH and XO
High-resolution crystal structure of XDH
The 1.65 Å resolution structure confirms the overall fold of the dimeric protein, the location of the cofactors and the mobile stretches of the polypeptide chain 5. The greatly improved quality of the new electron density map, however, allowed the placement of a total of 1966 water molecules, 24 glycerol molecules and 2 Ca2+ ions (Table 1). Also, multiple conformations were identified for side chains and their respective occupancies assigned.
Table 1.
Data collection and refinement statistics of bovine XDH/XO crystal structures.
| XDH | XO | XDH+NAD+ | XDH+NADH | |
|---|---|---|---|---|
| Space group | C2 | P21 | C2 | P21 |
| Unit cell axes (Å) | a=167.6 b=124.4 c=148.2 |
a=133.2 b=73.0 c=142.3 |
a=166.0 b=123.2 c=147.6 |
a=100.0 b=146.7 b=107.0 |
| Unit cell angle β (°) | 91.1 | 98.8 | 91.0 | 106.0 |
| Resolution limits (Å) | 20–1.65 | 38.1–2.30 | 20.0–1.90 | 20.0–2.20 |
| I/σ I (Last Shell) | 25.5 (2.9)* | 9.5 (3.7) | 23.6 (3.8) | 14.8 (3.6) |
| Linear R-factor (%) | 5.3 (45.4) | 11.7 (34.7) | 6.4 (38.0) | 9.0 (37.7) |
| Completeness All Data (%) | 99.9 (99.9) | 99.3 (96.1) | 99.8 (98.9) | 99.9 (99.9) |
| Overall redundancy | 4.27 | 3.40 | 5.33 | 3.08 |
| R-cryst (%) | 17.7 | 21.8 | 18.1 | 19.8 |
| R-free (%) | 19.6 | 27.9 | 21.4 | 24.0 |
| Number of atoms (All) | 22322 | 19797 | 21842 | 21497 |
| Number of water molecules | 1966 | 651 | 1509 | 1140 |
| Number of glycerol molecules | 24 | 5 | 13 | 10 |
| Number of Ca2+ ions | 2 | 2 | 2 | 2 |
Numbers in brackets refer to the highest resolution shell.
Esq/hq in XDH and XO
The calculated Esq/hq values were −407 mV for XDH and −268 mV for XO (Table 2), resulting in the significant Esq/hq difference of ~140 mV. These values are close to the experimentally measured values of −410 mV for XDH 3 and −234 mV for XO 4. During titration experiments to determine Esq/hq, some titratable sites change their protonation states in response to the flavin redox state. Since, in XDH, the carboxyl O atom of Asp429 is 4.6 Å away from the flavin N5 atom, the protonation state of Asp429 is strongly coupled with the flavin redox state (Figure 3). In contrast, the corresponding titration curve of XO is considerably different from that of XDH. In response to changes in the flavin redox state, there were no residues that strongly coupled with regards to their protonation states. The absence of coupling of the Asp429 protonation state with the flavin redox state in XO is due to the fact that the OAsp429-N5FAD distance in XO has increased to 11.9 Å (Figure 2).
Table 2.
Analysis of Esq/hq in mV.
| XDH | XO | Difference a | XDH+NAD+ | XDH+NADH | ||
|---|---|---|---|---|---|---|
| Esq/hq | experimental | −410b | −234c | −176 | n.d. | n.d. |
| calculated | −407 | −268 | −139 | −226 | −346 | |
| uncharged proteind | −343 | −347 | 4 | −406 | −400 | |
| reference (water)e | −172 | −172 | 0 | −172 | −172 | |
| Esq/hq shift (from water to protein) | Total | −235 | −96 | −139 | −54 | −174 |
| ΔEsq/hq(charge)f | −64 | 79 | −143 | 180 | 54 | |
| ΔEsq/hq(dielectric volume)g | −171 | −175 | 4 | −234 | −228 |
Em(XDH) − Em(XO).
At pH 7.5 3.
At pH 7.7 4.
Prepared by setting atomic charges of all atoms in the protein to zero.
See Ref. 31.
Influence of atomic charge of all atoms in the protein.
Influence of uncharged protein dielectric volume (i.e., the space covered by the merged van der Waals volumes of protein atoms).
Figure 3.


(a) Redox titration for the flavin Esq/hq value (■) versus solvent potential (Esolv) in XDH and XO. Associated changes in the protonation state of Asp429 as deprotonation state (i.e., 1.0 for fully deprotonated ionized state and 0.0 for fully protonated neutral state) are also shown (○). (b) Shift in the titration curves upon NAD+ binding (solid black arrow). The NAD+ redox state is fixed while titrating Esq/hq. For definitions of protonation and redox probabilities, see Ref. 53.
Figure 2.

Structural overview of the location of the flavin ring of FAD and the iron-sulfur clusters (FeS-I and FeS-II) in XDH (left) and XO (right). The 423-433 loops in the neighborhood of the flavin binding sites are depicted as pink (XDH) and green (XO) threads, respectively.
Contribution of protein dielectric volume to the Esq/hq difference in XDH and XO
The protein dielectric volume (i.e., the space obtained by merging the volumes of the van der Waals spheres of all protein atoms) is a main part of what provides so-called “protein hydrophobicity” to the flavin: the protein dielectric volume prevents access of water molecules to the flavin, and thus decreases the availability of solvation energy. In particular, the loss of solvation energy 38 destabilizes the flavin reduced state significantly, leading to the decrease in the redox potential.
By comparing the Esq/hq value of the flavin in water (−172 mV) with the Esq/hq value of the “uncharged” protein (i.e., where all the atomic partial charges in the protein except the flavin part (flavin = isoalloxazine ring and ribitol region) are set to zero, −343 mV for XDH and −347 mV for XO), the influence of protein dielectric volume on Esq/hq is calculated as −171 mV and −175 mV, respectively (Table 2). In the two enzymes, the protein dielectric volume destabilizes the flavin reduced state significantly.
The difference in the protein dielectric volume for the two enzymes is essentially zero, indicating that the influence of the protein dielectric volume is not a main factor that differentiates the Esq/hq values for XDH and XO (relative to the entire Esq/hq difference of ~170 mV).
Influence of the atomic charge on the Esq/hq difference for XDH and XO
From comparison between the calculated Esq/hq value for the protein and the calculated Esq/hq value for the “uncharged” protein, the influence of the protein atomic charge on Esq/hq can be obtained. In the present study, the Esq/hq values are shifted by −64 mV for XDH and 79 mV for XO due to the atomic partial charges on the entire protein (Table 2). The difference in the atomic charge contribution (143 mV) accounts for a majority of the Esq/hq difference (139 mV) for XDH and XO. The influence of atomic charge of the protein on Esq/hq is a sum of influences from each atom of the entire protein molecule. This enables us to clarify the influence of each residue/group on Esq/hq.
A number of residues located in/near the loop of Gln423-Lys433 significantly influence the Esq/hq for both XDH and XO (Table 3a). For the two enzymes, Lys422 (160–260 mV), Arg426 (90–130 mV), and Lys433 (40–150 mV) are notable with regard to the Esq/hq upshift. Lys1228 (80–130 mV) and Lys343 (70–90 mV) near the flavin binding site also increase the Esq/hq values in the two enzymes, although the two residues do not belong to the loop. For the Esq/hq downshift, Asp360 (190–240 mV, 2.7 Å from the flavin N3 atom in XDH and 2.6 Å for XO, Figure 2) and a negatively charged iron-sulfur cluster, FeS-II (130–150 mV), have the largest impact.
Table 3(a).
Protein components differentiating the Esq/hq value for XDH/XO in mV. Protein components that increase/decrease the Esq/hq difference by ≥ 20 mV are listed. For clarity, other residues are omitted from the table. For further information (side chain/backbone contributions), see Table S4 in Supporting Information.
| Esq/hq(XDH) | Esq/hq(XO) | Difference a | location | |
|---|---|---|---|---|
| increasing the Esq/hq Difference between XDH and XO | ||||
| Lys433 | 40 | 152 | −112 | loop b |
| Glu263 | −177 | −104 | −73 | |
| Asp429 | −137 | −66 | −71 | loop b |
| Asp430 | −108 | −46 | −62 | loop b |
| Asp360 | −236 | −190 | −46 | |
| Arg426 | 88 | 125 | −37 | loop b |
| Asn71 | −14 | 15 | −29 | |
| Glu267 | −32 | −10 | −22 | |
| FeS-IIc | −151 | −129 | −22 | |
| Gln144 | −14 | 7 | −21 | |
| decreasing the Esq/hq Difference between XDH and XO | ||||
| Lys422 | 261 | 155 | 106 | loop b |
| P (proximal)d | 14 | −81 | 95 | |
| Lys1228 | 127 | 80 | 47 | |
| Lys271 | 53 | 22 | 31 | |
| Lys343 | 90 | 67 | 23 | |
| Ala338 | 30 | 10 | 20 | |
Esq/hq(XDH) − Esq/hq(XO). A negative value here indicates an increased difference between Esq/hq in the two enzymes, while a positive value indicates a decreased difference.
The loop region (Gln423–Lys433) close to the flavin ring 5.
The iron-sulfur cluster proximal to the flavin ring.
A phosphate titratable site of the FAD diphosphate region proximal to the flavin ring.
We found that the 423-433 loop is important for the large influence on Esq/hq and the resulting Esq/hq difference between the two enzymes. Especially, Lys433, Asp429, Asp430, and Arg426 are key residues that differentiate the Esq/hq for XDH and XO significantly: each residue contributes to increasing the Esq/hq difference by 40–100 mV in XDH and XO. As a consequence, residues that are part of the stretch from position 422 to 433 are responsible for the Esq/hq difference of 137 mV for XDH and XO (Table 3b). Indeed, the protein conformations differ dramatically in this loop as revealed in the crystal structures 5 (Figure 2), confirming that redox potential is determined by the protein geometry alone 12.
Table 3(b).
Influence of the atomic charges of residues in the 423-433 loop (including Lys422) on the Esq/hq value for XDH/XO in mV. For further information (side chain/backbone contributions), see Table S4 in Supporting Information.
| Esq/hq(XDH) | Esq/hq(XO) | Difference a | |
|---|---|---|---|
| Lys422 | 261 | 155 | 106 |
| Gln423 | −2 | −5 | 3 |
| Ala424 | 4 | −1 | 5 |
| Ser425 | 5 | 1 | 4 |
| Arg426 | 88 | 125 | −37 |
| Arg427 | 21 | 23 | −2 |
| Glu428 | −39 | −26 | −13 |
| Asp429 | −137 | −66 | −71 |
| Asp430 | −108 | −46 | −62 |
| Ile431 | 9 | −6 | 15 |
| Ala432 | 10 | −2 | 12 |
| Lys433 | 40 | 152 | −112 |
|
| |||
| total | 152 | 304 | −152 |
Esq/hq(XDH) − Esq/hq(XO). A negative value here indicates an increased difference between Esq/hq in the two enzymes, while a positive value indicates a decreased difference.
FeS and Mo
In general, iron sulfur clusters lower the redox potential of a redox active group. For instance, in Photosystem I, the three iron sulfur clusters FX, FA and FB are located near the two quinones and responsible for downshifts of the quinone redox potentials: for FX by 240–260 mV, for FA by 30–50 mV, and for FB by 10–20 mV (edge-to-edge distances to the quinones are ~7, 20, and 30 Å, respectively) 25. In XDH and XO, the flavin ring is ~7 Å from FeS-II as is the case with FX and the quinones in Photosystem I. Indeed, the influence of FeS-II’s atomic charge on Esq/hq is significant for XDH and XO. FeS-II and FeS-I are responsible for quite large Esq/hq downshifts of 130–150 mV and 40 mV, respectively (Table 3).
Since the Mo center is ~30 Å away from the FAD binding site, its influence (including that of its phosphate region) on Esq/hq is quite marginal, downshifting Esq/hq by only 13 mV (5 mV due to the phosphate region and 8 mV due to the remaining parts) in both XDH and XO. In agreement with the present computational result, experimental measurements clearly demonstrate that the molybdopterin part does not have a significant influence on the redox potentials of the flavin or the iron-sulfur clusters (e.g. Refs. 39, 40).
Ribitol phosphate
The influence of the proximal phosphate region on Esq/hq is calculated to be 14 mV for XDH but −81 mV in XO, a significant difference (Table 3), which seems to cover the entire Esq/hq difference of ~170 mV between XDH and XO. Note that the proximal phosphate was protonated in XDH but deprotonated in XO. However, if we also consider the influence of Glu263 (−177 mV for XDH and −104 mV for XO, Table 3) and Glu267 (−32 mV and −10 mV), the influence of the [phosphate-Glu263-Glu267] group on Esq/hq is at the same level for XDH and XO, downshifting −194 and −196 mV, respectively. The difference in the phosphate contribution to Esq/hq is due to the considerably different Glu263 position and the H-bond network (Figure 4). Glu263 is at H-bond distance from the ribitol O3 atom (2.5 Å) in XDH while the corresponding H bond is absent in XO (4.5 Å from the ribitol O2 atom). Instead, Glu263 forms an H bond with Arg394 (2.8 Å) in XO with the corresponding H bond absent in XDH (4.3 Å distance). Thus, Glu263 is more tightly involved in the H-bond network around/holding the FAD moiety in XDH whereas it interacts more strongly with the Gln423-Lys433 loop (via Arg394) in XO. In conclusion, the net influence of the [phosphate-Glu263-Glu267] group on Esq/hq is essentially the same in the two proteins.
Figure 4.
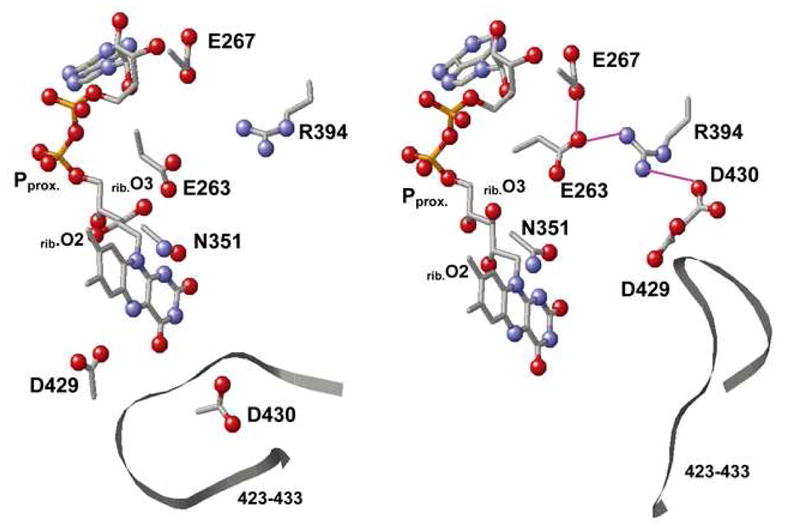
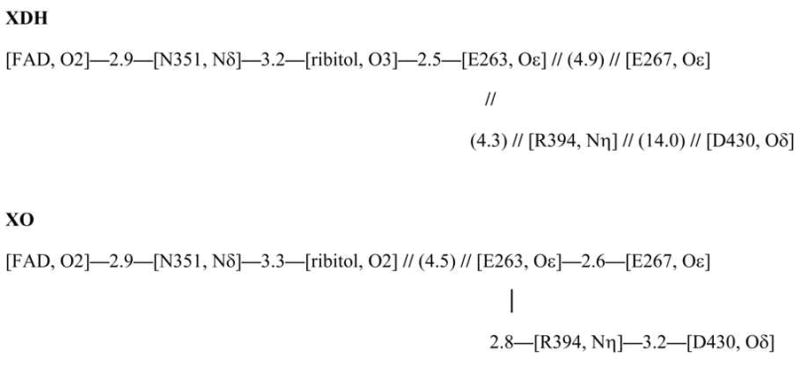
Protein environment of the FAD binding site of XDH (left) and XO (right) and the H-bond network (bottom). N and O atoms are depicted as blue and red balls, respectively. Possible H-bonds, in particular those among Glu263, Glu267, Arg394, and Asp430 are indicated by pink solid lines. Pproximal stands for the proximal phosphate atom of the diphosphate region. — — and // // indicate the presence and absence of an H-bond, respectively, with the numbers giving its length in Ångstrom units.
Calculated values of pKa(N5) in XDH and XO
The pKa(N5) values for FADH•/FAD•− deprotonation were calculated as 12.1 for XDH and 9.6 for XO (Table 4), indicating that the protein environment shifts the pKa(N5) by 3.5 and 1.0 units, respectively (pKa(N5) = 8.6 for flavin in aqueous solution) 31. In previous experimental reconstitution studies using 8-hydroxy FAD, it was demonstrated that pKa(N5) values were upshifted by 3.5 for XDH and 0.1 for XO with respect to their values in aqueous solution 41. Similar pKa(N5) shifts were also obtained when the enzyme was reconstituted with other artificial flavins 42, 43. Thus, the measured and calculated pKa(N5) shifts for the two enzymes compare very well.
Table 4.
Eox/sq and pKa(N5) in mV and pKa units, respectively. Eox/sq are discussed in “Calculated values of Eox/sq in XDH and XO”.
| XDH | XO | ||||
|---|---|---|---|---|---|
| Em | pKa | Em | pKa | ||
| Eox/sq (= Em(FAD/FAD−) + RT/F ln10 log(1+10 − (pH − pKa(N5))) c | experimental | −270a | −332b | ||
| calculated | −296 | −322 | |||
| uncharged protein d | −298 | −301 | |||
| reference (water) e | −238 | −238 | |||
| Eox/sq shift (from water to protein) | Total | −14 | −40 | ||
| ΔEm(charge) g | 1 | −21 | |||
| ΔEm (dielectric volume) h | −16 | −19 | |||
|
| |||||
| a) Em (FAD/FAD−) | experimental | n.d. f | n.d. f | ||
| calculated | −550 | −429 | |||
| uncharged protein d | −520 | −502 | |||
| reference (water) e | −333 | −333 | |||
| Em shift (from water to protein) | Total | −217 | −96 | ||
| ΔEm(charge) g | −30 | 73 | |||
| ΔEm (dielectric volume) h | −187 | −169 | |||
|
| |||||
| b) pKa(N5) for FADH•/FAD•− | experimental | n.d. | n.d. | ||
| calculated | 12.1 | 9.6 | |||
| uncharged protein d | 11.6 | 11.2 | |||
| reference (water) e | 8.6 | 8.6 | |||
| pKa shift (from water to protein) | Total | 3.5 | 1.0 | ||
| ΔpKa(charge) g | 0.5 | −1.6 | |||
| ΔpKa(dielectric volume) h | 3.0 | 2.6 | |||
|
| |||||
| b′) corresponding Em term i.e., RT/F ln10 log(1+10− (pH − pKa(N5))) | experimental | n.d. f | n.d. f | ||
| calculated | 254 | 107 | |||
| uncharged protein d | 222 | 201 | |||
| reference (water) e | 51 | 51 | |||
| Em shift (from water to protein) | Total | 203 | 56 | ||
| ΔEm(charge) g | 31 | −94 | |||
| ΔEm (dielectric volume) h | 171 | 150 | |||
At pH 7.5 3.
At pH 7.7 4.
See Ref. 12.
Prepared by setting atomic charges of all atoms in the protein to zero.
See Ref. 31.
Not determined.
Influence of atomic charge of all atoms in the protein.
Influence of uncharged protein dielectric volume (i.e., the space covered by the merged van der Waals volumes of protein atoms).
Influence of the protein dielectric volume on pKa(N5)
The protein dielectric volumes almost equally upshift the pKa(N5) values of the native flavin by 3.0 for XDH and 2.6 for XO with respect to the values in aqueous solution (Table 4). The pKa(N5) upshifts are due to the loss of solvation energy in the flavin binding site with respect to bulk aqueous solution: thus the protein environments destabilize the charged FAD•− form and facilitate formation of the uncharged FADH• state. The similar amount of the pKa(N5) upshifts calculated in both XDH and XO imply that the protein dielectric volume (or “protein hydrophobicity” in terms of the loss of solvation energy) does not differ considerably. (Note: in the protein inner core, the major contributor toward destabilizing charged groups is, in many cases, loss of solvation energy, rather than repulsive interactions 38)
Influence of the protein atomic charge on pKa(N5)
The pKa(N5) difference between XDH and XO is dominated by the influence of the protein atomic charges. The atomic charge influence on pKa(N5) is −1.6 in XO whereas 0.5 in XDH (Table 4). As a consequence, the anionic FAD•− form can be more effectively stabilized in XO than in XDH (although the native flavin is in the neutral charge FADH• form in both enzymes due to their high pKa(N5) values of >8).
In agreement with the calculated lower pKa(N5) value in XO than XDH, it is experimentally observed that artificial flavins reconstitute with apoprotein in their uncharged, neutral forms for XDH but in their anionic forms for XO 41–44. Hence the anionic FAD•− state in XO is more effectively stabilized by charged residues than in XDH. For instance, the positively charged Lys433 stabilizes the FAD•− state more effectively in XO than XDH, contributing to the increase in the pKa(N5) difference for the two enzymes (Table S6 in the Supporting Information). Many residues that contribute to the difference of the pKa(N5) values between XDH and XO are located in the 423-433 region, namely Asp430, Asp429, and Arg426. Again, as seen in the analysis of the Esq/hq difference, the loop region is likely the most crucial part that characterizes the flavin electrostatic environment for XDH and XO.
In previous studies, the apparently different pKa(N5) values were considered to be due to the presence/absence of a strong negative charge in XDH/XO (reviewed in Ref. 2). However, the present computation suggests that the difference in the flavin electrostatics can not be attributed to a specific single residue but is well understood as caused by the sum of contributions from a number of charged residues, including the proximal phosphate.
Calculated values of Eox/sq in XDH and XO
By calculating Em(FAD/FAD•−) and pKa(N5) and by using eq. 1, the Eox/sq values (i.e., Em(FAD/FADH•)) of −296 mV for XDH and −322 mV for XO were obtained (Table 4). These values are in good agreement with the experimentally measured Eox/sq values of −270 mV 3 and −332 mV 4 for XDH and XO, respectively. In contrast to the significant Esq/hq difference of ~170 mV for XDH and XO, the Eox/sq values are essentially at the same level for XDH and XO. A similar tendency, where Eox/sq values are less correlated with protein electrostatic environment (e.g. mutation of charged residues), has been observed before in other proteins containing flavin cofactors 45, 46.
The reason for the resulting similar Eox/sq values of the two enzymes irrespective of the different protein environment (e.g., see Esq/hq values) can be understood as follows:
| (eq. 2) |
The FAD/FADH• equilibrium proceeds via the FAD•− state as presented in eq. 2. In the initial FAD/FAD•− redox process, XO stabilizes the reduced FAD•− state due to the more positively charged flavin binding site, leading to an increase in the Em(FAD/FAD•−) term in eq. 1. This also holds true for the next FAD•−/FADH• protonation process: the positively charged environment of the flavin binding site in XO (relative to XDH) energetically favors the deprotonated FAD•− state with respect to the uncharged FADH• state; thus, the pKa(N5) value in XO is lower than in XDH (Table 4). As a consequence, the RT/F ln10 log(1 + 10−pH/10−pKa(N5)) term in eq. 1 decreases. Thus, the increased Em(FAD/FAD•−) term is compensated for by the decreased RT/F ln10 log(1 + 10−pH/10−pKa(N5)) term.
In contrast, the charge neutral environment in XDH does not energetically favor the charged FAD•− state in comparison with XO, resulting in a decrease in the Em(FAD/FAD•−) term and an increase in the RT/F ln10 log(1 + 10−pH/10−pKa(N5)) term. Here, the decreased Em(FAD/FAD•−) term is compensated for by the increased RT/F ln10 log(1 + 10−pH/10−pKa(N5)) term (Table 4).
Although the protein environments have almost opposite influences on the shift of the flavin energetics for the two enzymes, they result in almost equal Eox/sq values for the two enzymes, since changes in the Em(FAD/FAD•−) and RT/F ln10 log(1 + 10−pH/10−pKa(N5)) terms practically cancel out each other.
2. NAD+/NADH binding to XDH
Crystal structures of the NAD+ and NADH complexes of bovine XDH
The 1.9 and 2.2 Å resolution crystal structures of the NAD+ and NADH complexes of bovine XDH, respectively, confirm the overall fold of the dimeric proteins, the location of the cofactors and the mobile stretches of the polypeptide chains 5. In both structures, the adenine half of the NAD(H) molecules binds at the surface of the protein surrounded by residues Glu263, Ser356, Tyr393, Arg394, and Pro501. The remainder of the dinucleotide extends into an open cavity leading towards the flavin ring. While the electron density for the oxidized dinucleotide only extends to the first half of the pyrophosphate group, the full molecule of NADH is clearly visible and well defined in the electron density map (Figure 5a and b). The nicotinamide ring lies parallel to the flavin ring undergoing a π-stacking interaction as found in many other structurally characterized NAD-flavin complexes 47–52.
Figure 5.


Electron density maps of the FAD and NAD(H) binding sites in (a) ligand-free XDH, (b) ligand-free XO, (c) the XDH-NADH complex, and (d) the XDH-NAD+ complex. For clarity, only the FAD, NAD(H), and Asp429 are shown in atom representation. The backbone trace of the 423-433 loop is indicated by a green thread. Although the loop seems to swing away from the flavin ring in XO it does interfere with dinucleotide access in its new location.
The two crystal structures complexed with NAD+ and NADH did not significantly differ in the position/orientation of the flavin ring, the adenine half of the NAD(H), and the loop 423-433 (backbone and side chains).
Esq/hq upshift due to NAD+ binding
The calculated Esq/hq value for XDH complexed to NAD+ was −226 mV, resulting in a ~180 mV upshift relative to the calculated Esq/hq value of −407 mV for ligand-free XDH (Table 2, EFigure 3b). Since the m value for the electron donor FeS-II is −235 mV 3, ET from FeS-II to sq/hq would be energetically uphill (+175 meV, dotted arrow in Figure 6) before NAD+ binding. The ligand binding also induces an upshift in Em(FeS-II) but this one is considerably smaller (+35 mV). Thus, the ET was transformed into an almost isoenergetic process (+20 meV), facilitating the forward ET dramatically (Figure 6): this result confirms a scheme previously proposed for ET from FeS-II to sq/hq 7, 8.
Figure 6.

Shift in the redox potential levels and energetics for ET from FeS-II to flavin (sq/hq) in response to NAD+ binding. The solid black arrows indicate the redox potential shifts due to the NAD+ binding.
Interestingly, the change in Esq/hq of ~180 mV is about the same as the Esq/hq difference between XDH (Esq/hq = −410 mV 3) and XO (−234 mV 4). In the present study, we found that the 423-433 loop, which changes its conformation drastically when XDH is transformed into XO (Figure 2), is the major cause for the Esq/hq difference of ~140 mV between XDH and XO (Table 3b). In contrast, we did not observe significant structural changes for this loop upon NAD(H) binding, denying the possibility that the same loop might be responsible for both Em differentials.
Contribution of the atomic charge of NAD+ to the Esq/hq shift
From a comparison between the calculated Esq/hq value for the protein and the calculated Esq/hq value for the “uncharged” protein (i.e., the protein dielectric volume where all the atomic partial charges in the protein except for the flavin part (flavin = isoalloxazine ring and ribitol region) are set to zero), the influence of the protein atomic charge on Esq/hq can be obtained. In the present study, the Esq/hq values are shifted down by 64 mV for ligand-free XDH but shifted up by 180 mV for XDH with NAD+ bound due to the atomic partial charges on the entire protein (Table 2). Since the two states, ligand-free XDH and the NAD+-complex of the enzyme differ only in the absence or presence of the NAD+ molecule, the resulting Esq/hq upshift of 240 mV should be caused by the positive charge on the NAD+ ring region (note, the net charge of the entire NAD+ molecule is not +1 due to the diphosphate region).
However, further analysis revealed that the total effect of the NAD+-ring charge on Esq/hq is 358 mV (Table 5a), which is much larger than the observed Esq/hq difference of 240 mV. Thus, there must exist other contributions that partially compensate for the Esq/hq effect of NAD+ binding. Asp429 has been identified as the factor that predominantly compensates for the influence of the positive NAD+-ring charge on Esq/hq. In response to NAD+ binding, it alters its protonation state (Figure 3b), becoming less protonated after complex formation (0.4 H+ for the FADH− state) than in the ligand-free enzyme (0.8 H+ for the FADH− state).
Table 5(a).
Esq/hq for XDH; (a) protein components increasing the Esq/hq value in response to NAD+ binding in mV. Protein components that increase/decrease the Esq/hq difference by ≥ 20 mV are listed. For clarity, other residues are omitted from the table. For further information (side chain/backbone contributions), see Table S5 in Supporting Information.
| Esq/hq(XDH) | Esq/hq(XDH with NAD+) | Difference a | |
|---|---|---|---|
| NAD+ | 358 | 358 | |
| Lys422 | 261 | 323 | 62 |
| P (NAD+, proximal)b | 36 | 36 | |
| Arg394 | 60 | 90 | 30 |
| Lys343 | 90 | 114 | 24 |
Esq/hq(XDH with NAD+) − Esq/hq(XDH). A positive value here indicates an increased difference between Esq/hq in the two enzymes, while a negative value indicates a decreased difference.
A phosphate titratable site of the NAD+ diphosphate region proximal to the nicotinamide ring.
Since Asp429 is located only ~3 Å away from the flavin ring, its ionization state impacts Esq/hq significantly. In particular, the carboxyl O atom of Asp429 is not only close to the flavin (OAsp429-C6flavin = 3.2 Å) but also to the nicotinamide region (OAsp429-O7NAD+ = 3.6 Å). Thus, the more deprotonated Asp429 induced by the binding of the positively charged NAD+ ring destabilizes the anionic FADH− state, thus downshifting Esq/hq. In contrast to the strong coupling with the flavin redox state observed in ligand-free XDH and the NAD+-complex of XDH, Asp429 did not change its protonation state in response to the flavin redox state in XO (Figure 3a). The absence of such a coupling between Asp429 protonation state and flavin redox state in XO implies that Asp429 is not required in XO function, probably reflecting its inability to utilize NAD+ as a substrate due to steric hindrance (Figure 5b).
Interestingly, Glu59 in Clostridium beijerinckii flavodoxin and Asp62 in Desulfovibrio vulgaris flavodoxin are located at corresponding positions: the two acidic residues also change their protonation states in response to the redox state of their flavin 12, 13. The presence of acidic residues that change their protonation states near the flavin might be a common feature, which might be useful to keep Esq/hq values constant by buffering changes in any external electrostatic influence.
Contribution of NAD+ volume to the Esq/hq shift
The protein dielectric volume (i.e., the space obtained by merging the volumes of the van der Waals spheres of all protein atoms) is a main contributor to so-called “protein hydrophobicity” affecting the flavin cofactor: it prevents access of water molecules to the flavin, and thus decreases the availability of solvation energy. In particular, the loss of solvation energy 38 destabilizes the FADH− state significantly, leading to the decrease in Esq/hq.
By comparing the Esq/hq value of flavin in water (−172 mV) with the Esq/hq value of the “uncharged” (i.e., where all the atomic partial charges in the protein except for the flavin part (flavin = isoalloxazine ring and ribitol region) are set to zero) protein (−343 mV for ligand-free XDH and −406 mV for the NAD+-complex of XDH), we determined that the protein dielectric volume shifts the Esq/hq value by −171 mV for the ligand-free enzyme and by −234 mV for the NAD+-complex (Table 2). The larger Esq/hq downshift indicates that the flavin molecule is less exposed to the bulk solvent in the NAD+-complex of XDH (Figure 7) and that XDH with NAD+ bound cannot stabilize the anionic FADH− state effectively. As a result, the NAD+ volume that now covers the water accessible surface of the flavin (Figure 7) contributes to the Esq/hq downshift of 63 mV, counteracting the Esq/hq upshift caused by the positive charge of NAD+ ring.
Figure 7.
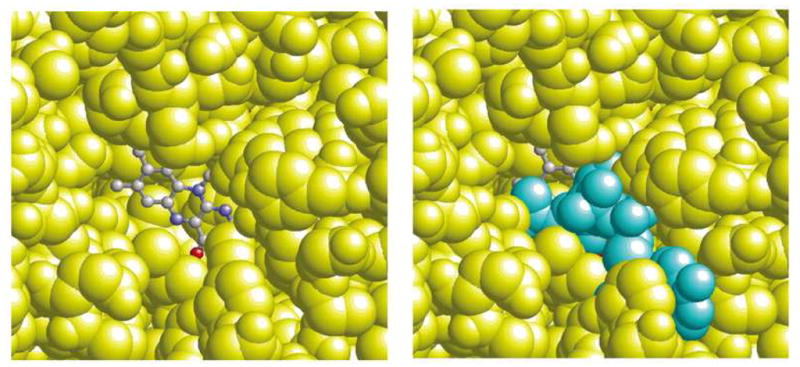
Representation of the FAD site of XDH. In the left hand figure, the NADH molecule has been removed to indicate the water-accessible area of the flavin ring. In the right hand figure, the same view is given but with the NADH molecule included to show how well the NADH molecule covers the flavin ring. The FAD atoms are depicted as ball-and-stick while the NADH molecule (cyan) and the protein atoms (yellow) are depicted as space-filling models.
CONCLUSIONS
The new 1.65 and 2.3 Å resolution crystal structures for XDH and XO, respectively, confirmed the side chain orientation in details. In particular the two crystal structures revealed the difference in the protein environment of the FAD binding site and the H-bond network for XDH and XO (Figure 4). This enabled us to precisely determine the protonation states of the titratable residues including those in the 423-433 loop, reproduce Esq/hq values, and thus pinpoint the factors that differentiate Esq/hq values between the two enzymes. The highly charged loop near the flavin-binding site is the main factor that differentiates the Esq/hq between XDH and XO. The difference in the Esq/hq between XDH and XO is 150 mV when calculated over the region of residues 422-433 (Table 3b). The influence of the protein dielectric volume (that prevents access to the flavin from water) on Esq/hq is equal in XDH and XO.
The crystal structures of the NAD(H) complexes of XDH revealed that, given the proper oxidation states, the nicotinamide rings of the dinucleotides locate at van der Waals distance to the flavin ring. A conformational change in the 423-433 loop region was not observed in response to NAD(H) binding. Instead, NAD+ binding to XDH is the switch that facilitates the forward ET from FeS-II to flavin, by upshifting Esq/hq by ~180 mV to yield an isoenergetic ET. The influence of the positive NAD+-ring charge on Esq/hq (upshifting by 360 mV) is partly compensated by (i) deprotonation of Asp429 (downshifting Esq/hq by 120 mV, Table 5) and (ii) the van der Waals volume of the NAD+ molecule. In XDH, the protonation state of Asp429 changes significantly in response to the flavin redox change during titration for Esq/hq but not in XO (Figure 3). This is of no consequence in the latter because of XO’s inability to bind NAD+ due to steric interference by the 423-433 loop.
Whether the 423-433 loop locates away from the flavin ring but still interfering with NAD(H) binding (i.e. in XO) or approaches the flavin part of FAD and thereby contributing to the binding site of NADH (i.e. in XDH) discriminates the Esq/hq by ~170 mV. The former is advantageous for the forward ET from FeS-II to flavin but cannot host NAD+/NADH as the successive electron acceptor for the flavin due to the obstructed binding pocket. On the other hand, the XDH form is apparently of disadvantage for the ET from FeS-II due to the quite low Esq/hq, but it can host NAD+/NADH in the neighborhood of the flavin. Employing the external NAD+ as an electron acceptor of the flavin upshifts Esq/hq significantly by ~180 mV, simultaneously reducing the energetic barrier for the successive ET. The similar Esq/eq differences of ~180 mV for XDH/XO and XDH/XDH-NAD+ imply the energetic compensation for Esq/hq of the different conformations of the 423-433 loops by NAD+ binding.
Supplementary Material
Table 5(b).
Protein components compensating for the Esq/hq upshift in response to NAD+ binding in mV. For further information (side chain/backbone contributions), see Table S5 in Supporting Information.
| Esq/hq(XDH) | Esq/hq(XDH with NAD+) | Difference a | |
|---|---|---|---|
| Asp429 | −137 | −253 | −116 |
| Glu263 | −177 | −257 | −80 |
| Asp360 | −236 | −312 | −76 |
| FeS-IIb | −151 | −183 | −32 |
| Asp430 | −108 | −134 | −26 |
| P (FAD, distal)c | −75 | −97 | −22 |
Esq/hq(XDH with NAD+) − Esq/hq(XDH). A positive value here indicates an increased difference between Esq/hq in the two enzymes, while a negative value indicates a decreased difference.
The iron-sulfur cluster proximal to the flavin ring.
A phosphate titratable site of the FAD diphosphate region distal to the flavin ring.
Acknowledgments
This research was supported by the JST PRESTO program (H.I), Grant-in-Aid (H.I. 21770163 and T.N. 18570137) for Scientific Research from the Ministry of Education, Culture, Sports, Science and Technology (MEXT) of Japan, Special Coordination Fund (H.I) for Promoting Science and Technology of MEXT, the Takeda Science Foundation (H.I.), Kyoto University Step-up Grant-in-Aid for young scientists (H. I.), and Grant for Basic Science Research Projects from The Sumitomo Foundation (H. I.). We also thank the Canadian Institutes for Health Research (MOP-64392) and the Canada Research Chairs Program for support (E.F.P.). The synchrotron radiation experiments were performed at beamline BL40B2 of SPring-8 with the approval of the Japan Synchrotron Radiation Research Institute (JASRI), at beamlines BL17A and NW12A of the Photon Factory (Tsukuba), and at the Argonne National Laboratory, BioCARS at the Advanced Photon Source. Argonne is operated by the University of Chicago, LLC, for the U.S. Department of Energy, Office of Biological and Environmental Research, under contract DE-AC02-06CH11357. Use of the BioCARS sector was supported by the National Institutes of Health, National Center for Research Resources, under grant No. RR007707. We are most grateful to the beamline staff at all three beamlines for their kind support and to Prof. Tanokura, The University of Tokyo, for use of equipment. This research was funded in part by the Ontario Ministry of Health and Long Term Care.
ABBREVIATIONS
- Em
redox (midpoint) potential
- Esq/hq
redox potential for the FAD semiquinone/hydroquinone states
- Eox/sq
redox potential for the FAD oxidized/semiquinone states
- ET
electron transfer
- FAD
flavin adenine dinucleotide
- FMN
flavin mononucleotide
- hq
flavin hydroquinone form
- LPB equation
linear Poisson-Boltzmann equation
- NAD+
oxidized form of nicotinamide adenine dinucleotide
- NADH
reduced form of nicotinamide adenine dinucleotide
- PDB
protein data bank
- sq
flavin semiquinone form
- XDH
xanthine dehydrogenase
- XO
xanthine oxidase
Footnotes
Supporting Information Available
Complete Ref. 27, atomic charges, discussion about dielectric constant, and residues/groups that shift Em or pKa of flavin. This information is available free of charge via the Internet at http://pubs.acs.org.
References
- 1.Saito T, Nishino T. J Biol Chem. 1989;264:10015–10022. [PubMed] [Google Scholar]
- 2.Nishino T, Okamoto K, Eger BT, Pai EF, Nishino T. FEBS J. 2008;275:3278–89. doi: 10.1111/j.1742-4658.2008.06489.x. [DOI] [PubMed] [Google Scholar]
- 3.Hunt J, Massey V, Dunham WR, Sands RH. J Biol Chem. 1993;268:18685–91. [PubMed] [Google Scholar]
- 4.Barber MJ, Siegel LM. Biochemistry. 1982;21:1638–47. doi: 10.1021/bi00536a026. [DOI] [PubMed] [Google Scholar]
- 5.Enroth C, Eger BT, Okamoto K, Nishino T, Pai EF. Proc Natl Acad Sci U S A. 2000;97:10723–8. doi: 10.1073/pnas.97.20.10723. [DOI] [PMC free article] [PubMed] [Google Scholar]
- 6.Rabenstein B, Ullmann GM, Knapp EW. Biochemistry. 2000;39:10487–10496. doi: 10.1021/bi000413c. [DOI] [PubMed] [Google Scholar]
- 7.Nishino T, Okamoto K. J Inorg Biochem. 2000;82:43–9. doi: 10.1016/s0162-0134(00)00165-3. [DOI] [PubMed] [Google Scholar]
- 8.Nishino T, Nishino T. J Biol Chem. 1989;264:5468–5473. [PubMed] [Google Scholar]
- 9.Ishikita H, Knapp EW. FEBS Lett. 2005;579:3190–3194. doi: 10.1016/j.febslet.2005.05.004. [DOI] [PubMed] [Google Scholar]
- 10.Ishikita H, Knapp EW. Biochemistry. 2005;44:14772–14783. doi: 10.1021/bi051099v. [DOI] [PubMed] [Google Scholar]
- 11.Hille R. Chem Rev. 1996;96:2757–2816. doi: 10.1021/cr950061t. [DOI] [PubMed] [Google Scholar]
- 12.Ishikita H. J Biol Chem. 2007;282:25240–25246. doi: 10.1074/jbc.M702788200. [DOI] [PubMed] [Google Scholar]
- 13.Ishikita H. Biochemistry. 2008;47:4394–4402. doi: 10.1021/bi702151k. [DOI] [PubMed] [Google Scholar]
- 14.Ishikita H. J Biol Chem. 2008;283:30618–30623. doi: 10.1074/jbc.M803864200. [DOI] [PMC free article] [PubMed] [Google Scholar]
- 15.Eger BT, Okamoto K, Enroth C, Sato M, Nishino T, Pai EF. Acta Crystallogr D Biol Crystallogr. 2000;56:1656–8. doi: 10.1107/s0907444900012890. [DOI] [PubMed] [Google Scholar]
- 16.Otwinowski Z, Minor W. Methods Enzymol. 1997;276:307–326. doi: 10.1016/S0076-6879(97)76066-X. [DOI] [PubMed] [Google Scholar]
- 17.Brunger AT, Adams PD, Clore GM, DeLano WL, Gros P, Grosse-Kunstleve RW, Jiang JS, Kuszewski J, Nilges M, Pannu NS, Read RJ, Rice LM, Simonson T, Warren GL. Acta Crystallogr D Biol Crystallogr. 1998;54:905–21. doi: 10.1107/s0907444998003254. [DOI] [PubMed] [Google Scholar]
- 18.Kirschbaum MUF, Farquhar GD. Aust J Plant Physiol. 1984;11:519–538. [Google Scholar]
- 19.Vagin A, Teplyakov A. J Appl Cryst. 1997;30:1022–1025. [Google Scholar]
- 20.Collaborative Computational Project. Acta Crystallogr D Biol Crystallogr. 1994;50:760–763. [Google Scholar]
- 21.Jones TA. J Appl Cryst. 1978;11:268–272. [Google Scholar]
- 22.Emsley P, Lohkamp B, Scott WG, Cowtan K. Acta Crystallogr D Biol Crystallogr. 2010;66:486–501. doi: 10.1107/S0907444910007493. [DOI] [PMC free article] [PubMed] [Google Scholar]
- 23.Brooks BR, Bruccoleri RE, Olafson BD, States DJ, Swaminathan S, Karplus MJ. Comput Chem. 1983;4:187–217. [Google Scholar]
- 24.Mouesca J, Chen JL, Noodleeman L, Bashford D, Case DA. J Am Chem Soc. 1994;116:11898–11914. [Google Scholar]
- 25.Ishikita H, Knapp EW. J Biol Chem. 2003;278:52002–52011. doi: 10.1074/jbc.M306434200. [DOI] [PubMed] [Google Scholar]
- 26.Bayly CI, Cieplak P, Cornell WD, Kollman PA. J Phys Chem. 1993;97:10269–10280. [Google Scholar]
- 27.Frisch MJ, et al. Gaussian 03. Gaussian, Inc; Wallingford CT: 2004. [Google Scholar]
- 28.Bashford D, Karplus M. Biochemistry. 1990;29:10219–10225. doi: 10.1021/bi00496a010. [DOI] [PubMed] [Google Scholar]
- 29.Rabenstein B, Knapp EW. Biophys J. 2001;80:1141–1150. doi: 10.1016/S0006-3495(01)76091-2. [DOI] [PMC free article] [PubMed] [Google Scholar]
- 30.Ishikita H, Knapp EW. J Biol Chem. 2005;280:12446–12450. doi: 10.1074/jbc.M413531200. [DOI] [PubMed] [Google Scholar]
- 31.Draper RD, Ingraham LL. Arch Biochem Biophys. 1968;125:802–808. doi: 10.1016/0003-9861(68)90517-1. [DOI] [PubMed] [Google Scholar]
- 32.Kumler WD, Eiler JJ. J Am Chem Soc. 1943;65:2355–2361. [Google Scholar]
- 33.McElroy WD, Glass B. Phosphorus Metabolism. I. Baltimore: Johns Hopkins University Press; 1951. [Google Scholar]
- 34.Swallow AJ. In: Function of Quinones in Energy Conserving Systems. Trumpower BL, editor. Academic Press; New York: 1982. pp. 59–72. [Google Scholar]
- 35.Porras AG, Palmer G. J Biol Chem. 1982;257:11617–26. [PubMed] [Google Scholar]
- 36.Tommos C, Skalicky JJ, Pilloud DL, Wand AJ, Dutton PL. Biochemistry. 1999;38:9495–9507. doi: 10.1021/bi990609g. [DOI] [PubMed] [Google Scholar]
- 37.Ludwig ML, Schopfer LM, Metzger AL, Pattridge KA, Massey V. Biochemistry. 1990;29:10364–10375. doi: 10.1021/bi00497a011. [DOI] [PubMed] [Google Scholar]
- 38.Kato M, Pisliakov AV, Warshel A. Proteins. 2006;64:829–844. doi: 10.1002/prot.21012. [DOI] [PubMed] [Google Scholar]
- 39.Cammack R, Barber MJ, Bray RC. Biochem J. 1976;157:469–478. doi: 10.1042/bj1570469. [DOI] [PMC free article] [PubMed] [Google Scholar]
- 40.Nishino T, Amaya Y, Kawamoto S, Kashima Y, Okamoto K, Nishino T. J Biochem. 2002;132:597–606. doi: 10.1093/oxfordjournals.jbchem.a003262. [DOI] [PubMed] [Google Scholar]
- 41.Massey V, Schopfer LM, Nishino T. J Biol Chem. 1989;264:10567–10573. [PubMed] [Google Scholar]
- 42.Hunt J, Massey V. J Biol Chem. 1992;267:21479–85. [PubMed] [Google Scholar]
- 43.Saito T, Nishino T, Massey V. J Biol Chem. 1989;264:15930–15935. [PubMed] [Google Scholar]
- 44.Ghisla S, Massey V. Biochem J. 1986;239:1–12. doi: 10.1042/bj2390001. [DOI] [PMC free article] [PubMed] [Google Scholar]
- 45.Zhou Z, Swenson RP. Biochemistry. 1995;34:3183–3192. doi: 10.1021/bi00010a007. [DOI] [PubMed] [Google Scholar]
- 46.McCarthy AA, Walsh MA, Verma CS, O’Connell DP, Reinhold M, Yalloway GN, d’Arcy D, Higgins TM, Voordouw G, Mayhew SG. Biochemistry. 2002;41:10950–10962. doi: 10.1021/bi020225h. [DOI] [PubMed] [Google Scholar]
- 47.Pai EF, Karplus PA, Schulz GE. Biochemistry. 1988;27:4465–74. doi: 10.1021/bi00412a038. [DOI] [PubMed] [Google Scholar]
- 48.Stehle T, Claiborne A, Schulz GE. Eur J Biochem. 1993;211:221–6. doi: 10.1111/j.1432-1033.1993.tb19889.x. [DOI] [PubMed] [Google Scholar]
- 49.Senda T, Yamada T, Sakurai N, Kubota M, Nishizaki T, Masai E, Fukuda M, Mitsuidagger Y. J Mol Biol. 2000;304:397–410. doi: 10.1006/jmbi.2000.4200. [DOI] [PubMed] [Google Scholar]
- 50.Chiu HJ, Johnson E, Schroder I, Rees DC. Structure. 2001;9:311–9. doi: 10.1016/s0969-2126(01)00589-5. [DOI] [PubMed] [Google Scholar]
- 51.van den Heuvel RH, Westphal AH, Heck AJ, Walsh MA, Rovida S, van Berkel WJ, Mattevi A. J Biol Chem. 2004;279:12860–7. doi: 10.1074/jbc.M313765200. [DOI] [PubMed] [Google Scholar]
- 52.Pudney CR, Hay S, Levy C, Pang J, Sutcliffe MJ, Leys D, Scrutton NS. J Am Chem Soc. 2009;131:17072–3. doi: 10.1021/ja908469m. [DOI] [PubMed] [Google Scholar]
- 53.Ullmann GM, Knapp EW. Eur Bophys J. 1999;28:533–551. doi: 10.1007/s002490050236. [DOI] [PubMed] [Google Scholar]
Associated Data
This section collects any data citations, data availability statements, or supplementary materials included in this article.