

Abstract
Background
Notch pathway signaling has critical roles in differentiation, proliferation and survival, and has oncogenic or tumor suppressor effects in a variety of malignancies. The goal of this study was to evaluate the effects of Notch activation on human neuroblastoma cells.
Procedure
Quantitative RT-PCR, immunoblots, and immunohistochemistry were used to determine the expression of Notch receptors (Notch1–4), cleaved Notch1 (ICN1), and downstream targets (HES1–5) in human neuroblastoma cell lines and patient tumor samples. Notch pathway signaling was induced using intracellular Notch (ICN1–3) and HES gene constructs or direct culture on Notch ligands. Quantitative methylation-specific PCR was used to quantify methylation of the HES gene promoters, and the effects of treatment with decitabine were measured.
Results
Neuroblastoma cells express varying levels of Notch receptors and low levels of HES genes at baseline. However, no endogenous activation of the Notch pathway was detected in neuroblastoma cell lines or patient tumor samples. Expression of activated Notch intracellular domains and HES gene products led to growth arrest. The HES2 and HES5 gene promoters were found to be heavily methylated in most neuroblastoma lines, and HES gene expression could be induced through treatment with decitabine.
Conclusions
We report that neuroblastoma cell lines express multiple Notch receptors, which are inactive at baseline. Activation of the Notch pathway via ligand binding or downstream HES gene expression consistently resulted in growth arrest. HES gene expression appears to be regulated epigenetically and could be induced with decitabine. These findings support a tumor suppressor role for Notch signaling in neuroblastoma.
Keywords: neuroblastoma, Notch, ICN, HES
Introduction
Children with high-risk neuroblastoma have very poor outcomes, with 5-year disease-free survival rates between 25 and 35% [1–3], and novel therapies based on biologically relevant pathways are critically needed for children with high-risk and recurrent neuroblastoma. Recent studies have identified the Notch signaling pathway as a possible mediator of neuroblastoma pathogenesis. In mammals, the Notch signaling pathway consists of five ligands (Jagged1, Jagged2, Delta-like ligand1 (DLL1), DLL3, DLL4) which bind to and activate four Notch receptors (Notch1–4). Upon ligand binding, these receptors are cleaved at the transmembrane domain by a gamma secretase complex, which releases their active intracellular Notch domains (ICNs). ICNs are then translocated to the nucleus where they form a transcriptional complex with CSL and Mastermind-like proteins, leading to the transactivation of Notch target genes such as the Hairy/Enhancer of Split (HES) family of basic helix-loop-helix (bHLH) transcriptional repressors (HES1–7) [4]
The Notch signaling pathway has been reported to play multiple roles in neural proliferation, differentiation and survival [5]. The Notch pathway has been shown to play an oncogenic role in a variety of cancers, while in other tumors, such as skin cancer, small cell lung cancer and medullary thyroid cancer, Notch signaling induces growth arrest and/or apoptosis, suggesting a role as a tumor suppressor [reviewed in 6,7]. The precise role of the Notch signaling pathway in neuroblastoma pathogenesis remains unclear. The Notch signaling pathway has been shown to inhibit neuroblastoma tumor cell differentiation [8–11], and Notch1 receptor expression has been shown to be associated with high-risk tumor features and poor prognosis in a cohort of children with neuroblastoma [11]. However, previous studies in neuroblastoma cell lines have shown that, despite expression of Notch receptors, HES genes were only expressed at low levels in a few cell lines, suggesting a lack of intrinsic Notch pathway activity [8,12–14].
To further explore the role of the Notch signaling pathway in the pathogenesis of neuroblastoma, we evaluated the expression patterns and activation status of the components of the Notch signaling pathway in neuroblastoma tumor cells and patient samples, the effects of activated Notch signaling on neuroblastoma tumor cells, and the role of DNA methylation in the regulation of Notch pathway signaling.
Methods
Cells and Culture Conditions
The characteristics of neuroblastoma cell lines SK-N-SH, SH-EP, SH-SY5Y, NGP, CHP-134, LA1–55N, SK-N-AS, SMS-KCNR, NBL-S, IMR-32, and NB12 used in this study have been previously described [15–19], and were generously provided by Susan Cohn (The University of Chicago Children’s Hospital, Chicago, IL), John Maris (Children’s Hospital of Philadelphia, Philadelphia, PA), and David Kaplan (University of Toronto, Toronto, CA). Neuroblastoma cell lines were grown at 37°C in 5% CO2 in RPMI 1640 (Invitrogen, Carlsbad, CA) supplemented with 10% heat-inactivated fetal bovine serum (FBS) (USB, Minneapolis, MN), 2mM L-glutamine, 1nM sodium pyruvate, 100nM non-essential amino acids, and penicillin/streptomycin (100U/mL, 100mcg/mL, Sigma, St. Louis, MO). All cell lines were routinely tested for mycoplasma using MycoAlert Mycoplasma Detection Kit (Lonza, Rockland, ME).
Plasmids/Transductions
The coding regions of the human ICN1, ICN2, ICN3, dominant-negative mastermind (dnMAM), HES1, HES2, HES4 and HES5 genes were PCR amplified, cloned into the MSCV-based retroviral vector MigR1 co-expressing green fluorescent protein (GFP) as an expression marker (kind gifts from Jon Aster and Warren Pear) and confirmed by sequencing as described previously [20]. Retroviral transduction procedures were described previously [21]. Approximately 6 hours after transduction, fresh media was added and GFP expression was subsequently measured by serial flow cytometry for FL1 (FACS Calibur, Becton Dickinson, San Jose, CA), starting 1–2 days from transduction.
Immunohistochemistry, Immunofluorescence, and Immunoblotting
Please see Supplemental Appendix for methods
Cell Proliferation and Cell Cycle Analyses
Neuroblastoma cells were plated on 6-well plates at the density of 0.5 × 10⁶ cells/well. The following day cells were either transduced or transfected as described above and returned to 37°C for 1–2 days. 10 μM bromo-deoxyuridine (BrdU, BD Biosciences, Franklin Lakes, NJ) was added to neuroblastoma cells for one hour at 37°C. Cells were then detached from plates, washed and fixed with 4% paraformaldehyde. Cells were incubated with 0.1% Triton X-100 and DNAse (0.05 units/μL, Promega, Madison, WI) for one hour at 37°C. Cells were then incubated with 5% fetal bovine serum in 0.05% Tween-20 in PBS for one hour at RT. Cells were incubated with mouse anti-BrdU antibodies (ab8039, Abcam, 1:1000, Cambridge, MA) overnight at 4°C, followed by washing and incubation with PE-conjugated anti-mouse antibodies (550589, BD Pharmingen, San Diego, CA) for one hour. 25μg/mL 7-amino-actinomycin (7-AAD, Calbiochem, San Diego, CA) was then added for one hour. GFP expression, 7-AAD staining (DNA content), and BrdU incorporation (DNA synthesis) were quantitatively measured by flow cytometry using a FACS Calibur (Becton Dickinson) and data were analyzed with the FlowJo software (TreeStar, Ashland, OR).
Plate-bound ligand assays were performed as described previously [23]. Briefly, tissue culture wells were coated with 50 μg/ml protein G (Prospec, Rehovot, Israel), washed and blocked 2 hours with Bovine Serum Albumin (BSA, IgG-free, protease-free, Jackson ImmunoResearch Laboratories, West Grove, PA) and then incubated overnight either with ChromPure Human IgG, Fc fragment (Jackson ImmunoResearch Laboratories, West Grove, PA) or with the human Jag1 Fc chimera (R&D, Minneapolis, MN), both at the concentration of 2 μg/ml.
Quantitative-PCR Analysis
RNA was prepared from neuroblastoma tumor cells using the RNeasy mini kit (Qiagen, Valencia, CA) and primed with a mixture of random and oligo(dT) primers to synthesize cDNAs using Omniscript reverse transcriptase (Qiagen) following the manufacturer’s instructions. The cDNA products were used for reverse transcription–PCR and quantitative PCR analysis. TaqMan polymerase chain reaction (PCR) primers and probes specific for human Notch pathway genes and controls were purchased commercially and used per manufacturer’s instructions (Applied Biosystems, Foster City, CA). Human GAPDH and actin were used as internal controls. Real-time PCR analysis was done using the iCycler iQ quantitative PCR system (Bio-Rad) using 2x SYBR Green PCR Master Mix (Bio-Rad) following manufacturer’s protocol. Data were analyzed according to the comparative Ct method and were normalized to actin expression in each sample [24].
To study DNA methylation, we employed the previously described quantitative methylation-sensitive polymerase chain reaction assay (Q-MSPCR) [25]. DNA extraction, bisulfite modification and pyro-sequencing were performed as previously described [see supplemental appendix].
Results
Notch pathway expression in neuroblastoma cell lines
Given the previous findings suggesting a possible role for Notch signaling in neuroblastoma pathogenesis [8–14], we first sought to establish the expression levels of Notch receptors and the downstream HES genes in neuroblastoma cell lines. In a panel of eight neuroblastoma cell lines, we detected expression of Notch1–3 mRNA transcripts in nearly all lines (Figure 1A). Notch1 expression was relatively high in NB12, SH-EP, and SK-N-SH cells and low in SK-N-AS and LA155N cells. Notch2 expression was higher in SH-EP, SH-SY5Y, SK-N-SH, and LA155N cell lines and lower in IMR-32 cells. Notch3 expression was relatively consistent in all cell lines, with the exception of NB12 and SH-EP cells, while Notch4 expression was only seen at low levels in SHEP and LA155N cells. In this panel of neuroblastoma cell lines, all lines express at least two Notch receptor homologs, suggesting that these cells are capable of receiving Notch signals. These results were confirmed using Western blots to measure protein expression levels (Figure 1B). High levels of Notch1 protein was found in NB12, SH-EP, and SK-N-SH cells, while high levels of Notch2 protein were only seen in SH-EP and SK-N-SH cells (Figure 1B). Notch3 protein was essentially undetectable in all tested neuroblastoma cell lines (data not shown).
Figure 1.

Expression of Notch receptors in neuroblastoma tumor cell lines. (A) mRNA expression levels of the NOTCH1–4 genes were determined via RT-PCR on RNA isolated from a panel of 8 human neuroblastoma cell lines. Expression levels are shown in relation to GAPDH mRNA levels. (B) Cell lysates from neuroblastoma cell lines were generated and analyzed by Western blot for Notch1 (top) and Notch2 (bottom). Loucy cells, a T cell ALL cell line with elevated endogenous levels of Notch1, were used as a positive control.
In order to evaluate the expression of the Notch receptor target HES genes in neuroblastoma cells, we also evaluated a panel of neuroblastoma tumor cells for expression of the HES gene family by RT-PCR. HES1, HES2, HES4, and HES5 mRNA transcripts were also found with varying levels in neuroblastoma cell lines (Figure 2), while HES3 expression was extremely low in all tested cell lines (data not shown). The levels of HES1 gene expression in these neuroblastoma cell lines was approximately 100 fold lower than HES1 expression levels in T cell ALL samples where Notch signaling is known to be activated, suggesting that the baseline level of HES gene expression in neuroblastoma cells is very low.
Figure 2.

Expression of Notch target HES genes in neuroblastoma tumor cell lines. mRNA expression levels of the HES1–5 genes were determined by RT-PCR on RNA isolated from a panel of neuroblastoma cell lines. Expression levels are shown in relation to GAPDH mRNA levels on a logarithmic scale. HES1 gene expression in T cell ALL cell lines was also analyzed and are shown as a positive control.
Notch pathway activity in neuroblastoma cells and tumors
To determine whether the Notch signaling pathway is active in neuroblastoma tumor cells at baseline, we screened neuroblastoma tumor cell lines for the presence of the cleaved form of the Notch receptors. Neuroblastoma cell lines did not have any detectable cleaved (activated) Notch receptor (Figure 3A), when compared to a T-ALL cell line with constitutive Notch activation. To confirm these findings in patient tumor samples, we evaluated frozen neuroblastoma patient tumor samples and a neuroblastoma tissue array obtained from the Children’s Oncology Group (COG) neuroblastoma tumor tissue bank. In the tumor samples, despite significant levels of Notch1 protein by Western blot, we could not detect cleaved (activated) Notch1 receptor (Figure 3B), while in the tissue array although rare individual non-tumor cells did demonstrate Notch activation, neuroblastoma tumor cells from over 40 independent tumors did not reveal cleaved Notch receptors (Figure 3C) suggesting that despite wide expression of Notch receptors in neuroblastoma cells, the Notch signaling pathway is not active.
Figure 3.

Activation of the Notch signaling pathway in neuroblastoma cell lines and tumors. (A) Cell lysates from neuroblastoma cell lines were analyzed by Western blot for expression of activated cleaved Notch1 (ICN1). (B) Human primary neuroblastoma tumor samples were analyzed by Western blot for expression of full length Notch1 and ICN1 (cleaved Notch) protein expression. Loucy T-cell ALL cells were analyzed as a positive control in both sets of Western blots. (C) Human primary neuroblastoma tumor samples were analyzed by immunohistochemistry for expression of ICN1. 3 representative tumor samples at 40X (top) and 100X (bottom) magnifications are shown.
Notch signaling activates HES gene expression in neuroblastoma tumor cells
In order to confirm the ability of Notch signaling to induce HES gene expression in neuroblastoma cells, we transduced neuroblastoma tumor cell lines with activated ICN1–3 constructs. ICN1–3 expression resulted in upregulated expression of the HES1, HES2, HES4, and HES5 genes, but downregulated expression of the HES3 gene, with modest increased in HES1 and HES2 expression and dramatic increases in HES4 and HES5 expression (Figure 4A).
Figure 4.

Induction of HES gene expression by Notch pathway activation in neuroblastoma cell lines. (A) SK-N-AS neuroblastoma tumor cells were transduced with activated cleaved Notch receptor constructs (ICN1, ICN2, and ICN3) or with vector alone, and mRNA expression levels of HES1–5 genes were determined by RT-PCR. Expression levels are shown in relation to GAPDH mRNA levels. (B) SK-N-SH neuroblastoma tumor cells were cultured on the Fc IgG fragment (lane 3) or on the human Jag1-Fc chimera (lane 4) for approximately 6 hours; cell lysates were evaluated by Western blot for activated cleaved Notch (ICN1) expression levels. T-cell ALL cell lines with constitutive Notch activation were used as positive controls (lanes 1,2). (C) SK-N-SH neuroblastoma tumor cells were cultured on the Fc IgG fragment or on the human Jag1-Fc chimera for 5 days and mRNA levels of the HES1–5 genes were determined by RT-PCR. Results are shown as fold change in relation to control levels.
To test the effects of Notch signaling through activation of the endogenous Notch receptors, neuroblastoma tumor cells were cultured on tissue culture plates coated with commercially-available recombinant human Jagged1-Fc or control Fc protein. Culture of neuroblastoma cells on these Jagged1 ligand-coated plates induced Notch receptor cleavage within 6 hours (Figure 4B) and strongly induced HES gene family expression (Figure 4C), confirming the ability of endogenous Notch receptors to activate downstream HES gene family expression in neuroblastoma cell lines.
Notch signaling inhibits neuroblastoma cell growth
In order to further evaluate the effects of Notch pathway activation in neuroblastoma tumor cells, neuroblastoma cell lines were transduced with constructs expressing the active intracellular domains of the Notch receptors ICN1–3 in conjunction with GFP. Using flow cytometry to measure the number of GFP positive cells in this competitive proliferation assay, expression of any of the three cleaved Notch receptors (ICN1–3) led to consistent decrease in the percentage of GFP positive cells (Figure 5A, Supplemental Figure 1A) compared to cells transduced with the control GFP-only vector, demonstrating an inhibitory effect of Notch activation on neuroblastoma cells. Expression of dominant-negative Mastermind (dnMAM) had no effect on GFP positive cells, suggesting that these cells are not dependent on CSL-dependent Notch signaling at baseline.
Figure 5.
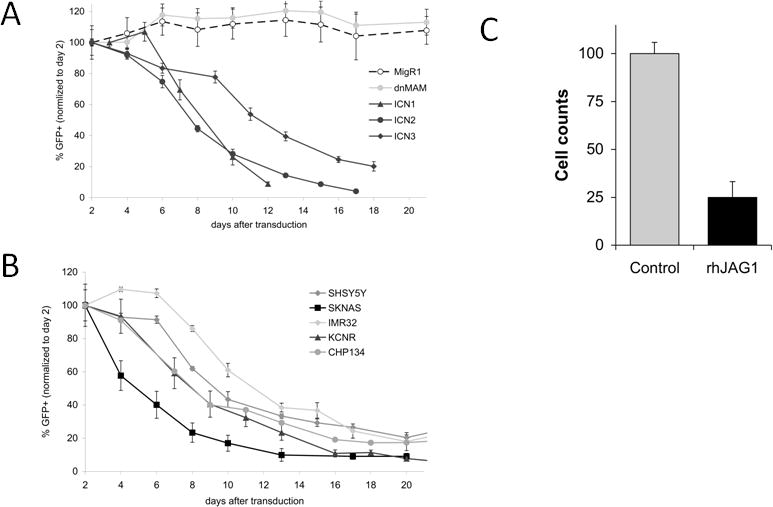
Effects of activated Notch signaling on neuroblastoma tumor cells. (A) SK-N-AS neuroblastoma cells were transduced with vectors containing GFP and activated intracellular Notch receptor domains (ICN1–3), the pan-Notch inhibitor dominant-negative Mastermind (dnMAM), or with GFP-containing vector alone (MigR1). (B) A panel of neuroblastoma cell lines were transduced with vectors containing GFP and HES1. Cells were maintained in culture and aliquots were sorted on alternate days for the percentage of cells with GFP expression and are expressed as a percentage of cells normalized to day 2. (C) SK-N-SH neuroblastoma cells were plated in wells coated with the human Jag1-Fc chimeric protein and cell counts were obtained after 10 days. Cell counts are expressed as a percentage of cells grown on uncoated plates.
As all three cleaved Notch receptors induced similar inhibition in neuroblastoma cell lines, we hypothesized that this inhibitory effect may be due to activation of downstream HES gene expression. In a panel of neuroblastoma cell lines, HES1 expression was sufficient to inhibit neuroblastoma growth in a manner at least as potent as ICN1–3 (Figure 5B). In additional neuroblastoma tumor cell lines, expression of HES family members HES2/4/5 each individually inhibited neuroblastoma growth (Supplemental Figure 1B).
In order to evaluate the capacity of endogenous Notch signaling to inhibit neuroblastoma tumor cell growth, neuroblastoma cells were cultured in wells under control conditions or on wells coated with the Notch ligand Jagged1. Culture of neuroblastoma tumor cells on Jagged1-coated plates led to significantly lower cell counts compared to cells grown on control plates (Figure 5C), consistent with the inhibitory effects of Notch signaling found in studies with exogenous expression of Notch pathway constructs.
To determine the underlying mechanisms of the effects of Notch pathway activation on neuroblastoma cells, we analyzed neuroblastoma cells transduced with HES1 for DNA content and BrDU incorporation. Transduction of HES1 results in a significantly lower percentage of cells undergoing DNA synthesis and mitosis, suggesting G0/G1 growth arrest (Figure 6A), and significantly reduced BrDU incorporation (Figure 6B), further demonstrating the growth inhibitory effects of Notch pathway signaling on neuroblastoma cells.
Figure 6.

Effects of HES1 expression on neuroblastoma cell cycle progression and proliferation. CHP-134 neuroblastoma cells were transduced with HES1 or with vector alone, and cells were subsequently pulsed with BrdU for 1 hour, sorted for GFP expression and analyzed for cell cycle progression using 7-AAD staining for DNA content (A) and for proliferation using BrdU incorporation (B).
Hes gene family methylation status
Since multiple HES proteins induce neuroblastoma tumor cell growth arrest, we hypothesized that they may represent a tumor suppressor family. The HES2, HES3, HES4, and HES5 genes are located in 1p36.31-1p36.33, a chromosomal region frequently deleted in neuroblastoma tumors [26]. To explore the potential role of epigenetic regulation of HES gene expression, we measured the promoter methylation of the HES2 and HES5 genes, which have large CpG islands in their promoter regions. Most neuroblastoma lines have moderate to heavy methylation of these HES2 and HES5 CpG islands, suggesting that expression of these genes is silenced in neuroblastoma tumors (Figure 7A).
Figure 7.
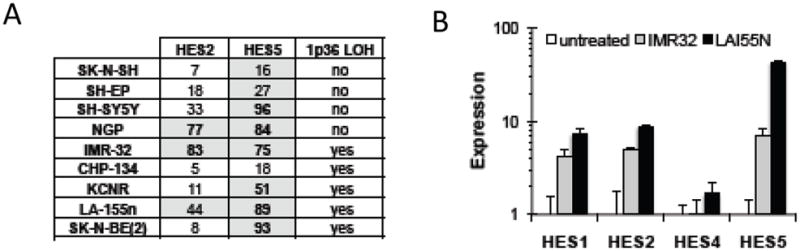
Epigenetic modifications of the HES gene family. (A) Methylation of the HES2 and HES5 gene promoters was determined by bisulfite sequencing in 9 neuroblastoma cell lines, and quantitative methylation-sensitive PCR was performed, using γ-IFN as an unmethylated control gene promoter. Numbers are expressed as a percentage of gene methylation identified. (B) Neuroblastoma cells were treated with either 10mM decitabine for 24 hours and HES gene expression was measured by RT-PCR.
To determine if this methylation could be reversed, we treated neuroblastoma cells with the DNA methyltransferase inhibitor decitabine. We found an increase in expression of the HES1, HES2, and HES5 genes, consistent with de-repression of methylation-induced silencing (Figure 7B), and suggesting a possible role for demethylating agents in the activation of the Notch signaling pathway.
Discussion
Children with high-risk neuroblastoma have extremely poor outcomes, and additional understanding of the pathways involved in neuroblastoma pathogenesis will assist in the development of improved therapies in the future. The Notch signaling pathway has been shown to play critical roles in numerous neuronal developmental processes [27,28], and, with the neural crest origins of neuroblastoma and the accumulating evidence for a role for Notch signaling in neuroblastoma differentiation, the Notch signaling pathway likely will be important for neuroblastoma pathogenesis and include potential targets for future therapies. Using multiple independent neuroblastoma tumor cell lines and a variety of experimental techniques, our preliminary results consistently demonstrate an inhibitory role for Notch pathway signaling in neuroblastoma tumor cells.
The roles of the Notch pathway in neural development have been widely described, and the Notch pathway in particular affects neural and neural crest stem cell fate. In neural crest development, Notch plays a dual role, first in specification of neural crest progenitors and later providing instructive signals for neural crest differentiation, e.g. glial fate, cell death, etc. [29]. The Notch target genes HES1 and HES5 have been shown to promote proliferation of neural stem cells, regulating neural and glial stem cell fates [30–34]. In medulloblastoma tumors, activation of Notch2 and HES1 are associated with inhibition of differentiation, stem cell survival and poor patient survival [35]. In SH-SY5Y neuroblastoma tumor cells, overexpression of the Notch1 intracellular domain has been shown to inhibit differentiation [8,9], while treatment of the SH-SY5Y neuroblastoma cells with gamma-secretase inhibitors (GSI’s) to block Notch pathway activation result in enhanced differentiation [10,11]. The direct roles of the Notch pathway target HES genes in neuroblastoma tumor cell differentiation are unknown and are currently being investigated.
The effects of Notch pathway signaling on neuroblastoma tumor cell proliferation and viability are also not well understood. We have demonstrated reduced proliferation of neuroblastoma cells with overexpressed active Notch receptor intracellular domains, HES1/2/4/5 gene products, and with culture on the Notch receptor ligand Jagged1. Prior studies have demonstrated enhanced neuroblastoma tumor cell death with overexpression of HES1 [8], and treatment of neuroblastoma tumor cells with the histone deacetylase inhibitor valproic acid resulted in increased HES1 expression and tumor cell death [14], while other studies have shown increased neuroblastoma tumor cell proliferation in response to a soluble Jagged1 ligand peptide [36]. Funahashi and colleagues found no effect on neuroblastoma cell proliferation in response to an inhibitory soluble form of the Notch1 receptor [37]. GSI’s have been shown to reduce neuroblastoma tumor cell proliferation [36] and neuroblastoma xenograft tumor growth [11], although GSI’s and the soluble Notch1 receptor decoy were shown to have an antiangiogenic effect on neuroblastoma tumors, independent of direct effects on the tumor cells [37].
Further studies have also explored the potential role of the Notch signaling pathway in neuroblastoma tumors in primary patient tumor samples. Chang et al. demonstrated an association between Notch1 receptor overexpression and high-risk tumor features and poor outcomes in a cohort of children with neuroblastoma [11]. However, we were unable to detect the expression of cleaved, active ICN1 in a sample of neuroblastoma tumors from the Children’s Oncology Group, suggesting that the Notch pathway remains inactive and that the Notch1 receptor may be associated with poor patient outcomes via indirect mechanisms or other pathways. We are planning to evaluate a larger cohort of neuroblastoma tumor samples for evidence of Notch pathway activation in order to determine the association with patient prognosis.
The transcriptional targets of the HES family of repressors are not well-studied, but pro-neural genes like Achaete-scute-like1 (ASCL1/HASH1), atonal homolog-1 (ATOH1), and neurogenin-1 (NGN1) have been reported as targets in neural tissues have been reported as targets in neural tissues [38]. In addition to the HES family of genes, several genes are known targets of Notch, including MYC, AKT, NFκB, BCL-2, and p21/p27 [7]. We are currently exploring the roles of these alternate Notch and HES target genes in neuroblastoma model systems.
Deletion of the short arm of chromosome 1 is one of the most common chromosomal rearrangements observed in neuroblastoma, occurring in approximately one-third of cases [39], and is associated with high-risk features and a poor prognosis. 1p deletions are located in the 1p36 region of the chromosome, and this region has been hypothesized to harbor a tumor suppressor gene [40]. The HES2, HES3, HES4 and HES5 genes are all located on 1p36, within the smallest region of overlap (SRO) deleted in 60% of neuroblastoma cell lines [26,41]. This potential tumor suppressor family provides an explanation as to why this large deletion at 1p36 is so commonly found. We have demonstrated that the HES2 and HES5 genes are regulated by gene methylation, and their expression can be induced by treatment with demethylating agents. HES3 and HES4 genes, in contrast, do not have CpG islands in their respective promoters, and therefore are likely regulated by different mechanisms. Studies are ongoing to determine whether other epigenetic modifications are responsible for HES3 and HES4 gene regulation.
Our results demonstrate a potential role for Notch pathway signaling in the pathogenesis of neuroblastoma. In particular, neuroblastoma tumor cell lines and patient tumors have essentially inactive Notch signaling, and Notch pathway activation results in reduced neuroblastoma cell proliferation. We have also shown that the Notch pathway is regulated in part by methylation of the downstream Notch target HES gene family, and that HES gene expression can be induced with demethylating agents. With the poor outcomes for children with neuroblastoma, the Notch signaling pathway represents a potential therapeutic target for future drug development and testing in clinical trials for these patients.
Supplementary Material
Acknowledgments
Grant support - Lorrie Olivier Neuroblastoma Research Fund (to PEZ, PAZ-M)
The patient tumor samples and patient tumor sample arrays employed in these studies were provided by the Children’s Oncology Group neuroblastoma biology committee and the Biopathology Center in Columbus, OH.
Abbreviations
- DLL1
Delta-like ligand1
- ICN
intracellular Notch
- HES
Hairy/Enhancer of Split
- bHLH
basic helix-loop-helix
- ASCL1
Achaete-scute-like1
- GFP
green fluorescent protein
- TMA
tissue microarray
- BrdU
Bromo-deoxyuridine
- 7-AAD
7-amino-actinomycin
- RT
room temperature
- COG
Children’s Oncology Group
- DAB
diaminobenzidine
- BSA
Bovine Serum Albumin
- DAPI
4′6-diamino-2-phenylindole
- BCA
bicinchoninic acid
- SDS-PAGE
SDS-polyacrylamide gel electrophoresis
- PVDF
polyvinylidene fluoride
- HRP
horseradish peroxidase
- PCR
polymerase chain reaction
- Q-MSPCR
quantitative methylation-sensitive polymerase chain reaction assay
- IFN-γ
interferon-γ
- HDACi
histone deacetylase inhibitor
- GSI
gamma-secretase inhibitor
Footnotes
The authors have no conflicts of interest to report.
References
- 1.Ladenstein R, Philip T, Lasset C, et al. Multivariate Analysis of Risk Factors in Stage 4 Neuroblastoma Patients Over the Age of One Year Treated with Megatherapy and Stem-cell Transplantation: A Report From the European Bone Marrow Transplantation Solid Tumor Registry. J Clin Oncol. 1998;16:953–65. doi: 10.1200/JCO.1998.16.3.953. [DOI] [PubMed] [Google Scholar]
- 2.Matthay KK, Reynolds CP, Seeger RC, et al. Long-Term Results for Children with High-Risk Neuroblastoma Treated on a Randomized Trial of Myeloablative Therapy Followed by 13-cis-Retinoic Acid: A Children’s Oncology Group Study. J Clin Oncol. 2009;27:1007–13. doi: 10.1200/JCO.2007.13.8925. [DOI] [PMC free article] [PubMed] [Google Scholar]
- 3.Zage PE, Kletzel M, Murray K, et al. Outcomes of the POG 9340/9341/9342 Trial for Children with High-Risk Neuroblastoma: a Report from the Children’s Oncology Group. Pediatr Blood Cancer. 2008;51:747–53. doi: 10.1002/pbc.21713. [DOI] [PMC free article] [PubMed] [Google Scholar]
- 4.Iso T, Kedes L, Hamamori Y. HES and HERP Families: Multiple Effectors of the Notch Signaling Pathway. J Cell Physiol. 2003;194:237–255. doi: 10.1002/jcp.10208. [DOI] [PubMed] [Google Scholar]
- 5.Nagao M, Sugimori M, Nakafuku M. Cross Talk Between Notch and Growth Factor/Cytokine Signaling Pathways in Neural Stem Cells. Mol Cell Biol. 2007;27:3982–3994. doi: 10.1128/MCB.00170-07. [DOI] [PMC free article] [PubMed] [Google Scholar]
- 6.Leong KG, Karsan A. Recent Insights into the Role of Notch Signaling in Tumorigenesis. Blood. 2006;107:2223–33. doi: 10.1182/blood-2005-08-3329. [DOI] [PubMed] [Google Scholar]
- 7.Zweidler-McKay Notch Signaling in Pediatric Malignancies. Curr Oncol Rep. 2008;10:459–68. doi: 10.1007/s11912-008-0071-2. [DOI] [PubMed] [Google Scholar]
- 8.Grynfeld A, Pahlman S, Axelson H. Induced Neuroblastoma Cell Differentiation, Associated with Transient Hes-1 Activity and Reduced HASH-1 Expression, Is Inhibited by Notch. Int J Cancer. 2000;88:401–10. [PubMed] [Google Scholar]
- 9.Hooper C, Tavassoli M, Chapple JP, et al. TAp73 Isoforms Antagonize Notch Signalling in SH-SY5Y Neuroblastomas and in Primary Neurones. J Neurochem. 2006;99:989–99. doi: 10.1111/j.1471-4159.2006.04142.x. [DOI] [PubMed] [Google Scholar]
- 10.Liao Y-F, Wang B-J, Hsu W-M, et al. Unnatural Amino Acid-Substituted (Hydroxyethyl)Urea Peptidomimetics Inhibit g-Secretase and Promote the Neuronal Differentiation of Neuroblastoma Cells. Mol Pharmacol. 2007;71:588–601. doi: 10.1124/mol.106.024299. [DOI] [PubMed] [Google Scholar]
- 11.Chang H-H, Lee H, Hu M-K, et al. Notch1 Expression Predicts an Unfavorable Prognosis and Serves as a Therapeutic Target of Patients with Neuroblastoma. Clin Cancer Res. 2010;16:4411–20. doi: 10.1158/1078-0432.CCR-09-3360. [DOI] [PubMed] [Google Scholar]
- 12.Jogi A, Persson P, Grynfeld A, Pahlman S, Axelson H. Modulation of Basic Helix-Loop-Helix Transcription Complex Formation by Id Proteins During Neuronal Differentiation. J Biol Chem. 2002;277:9118–26. doi: 10.1074/jbc.M107713200. [DOI] [PubMed] [Google Scholar]
- 13.van Limpt VAE, Chan AJ, van Sluis PG, et al. High Delta-Like 1 Expression in a Subset of Neuroblastoma Cell Lines Corresponds to a Differentiated Chromaffin Cell Type. Int J Cancer. 2003;105:61–9. doi: 10.1002/ijc.11047. [DOI] [PubMed] [Google Scholar]
- 14.Stockhausen M-T, Sjolund J, Manetopoulos C, Axelson H. Effects of the Histone Deacetylase Inhibitor Valproic Acid on Notch Signalling in Human Neuroblastoma Cells. Br J Cancer. 2005;92:751–9. doi: 10.1038/sj.bjc.6602309. [DOI] [PMC free article] [PubMed] [Google Scholar]
- 15.Biedler JL, Helson L, Spengler BA. Morphology and Growth, Tumorigenicity, and Cytogenetics of Human Neuroblastoma Cells in Continuous Culture. Cancer Res. 1973;33:2643–52. [PubMed] [Google Scholar]
- 16.Brodeur GM, Green AA, Hayes FA, et al. Cytogenetic Features of Human Neuroblastomas and Cell Lines. Cancer Res. 1981;41:4678–86. [PubMed] [Google Scholar]
- 17.Reynolds CP, Tomayko MM, Donner L, et al. Biological Classification of Cell Lines Derived from Human Extra-Cranial Neural Tumors. Advances in Neuroblastoma Research. 1988;2:291–306. [PubMed] [Google Scholar]
- 18.Foley J, Cohn SL, Salwen HR, et al. Differential Expression of N-myc in Phenotypically Distinct Subclones of a Human Neuroblastoma Cell Lines. Cancer Res. 1991;51:6338–45. [PubMed] [Google Scholar]
- 19.Hansford LM, McKee AE, Zhang L, et al. Neuroblastoma Cells Isolated from Bone Marrow Metastases Contain a Naturally Enriched Tumor-Initiating Cell. Cancer Res. 2007;67:11234–43. doi: 10.1158/0008-5472.CAN-07-0718. [DOI] [PubMed] [Google Scholar]
- 20.Zhang P, Yang Y, Zweidler-McKay PA, Hughes DPM. Critical Role of Notch Signaling in Osteosarcoma Invasion and Metastasis. Clin Cancer Res. 2008;14:2962–9. doi: 10.1158/1078-0432.CCR-07-1992. [DOI] [PMC free article] [PubMed] [Google Scholar] [Retracted]
- 21.Zweidler-McKay PA, He Y, Xu L, et al. Notch Signaling Is a Potent Inducer of Growth Arrest and Apoptosis in a Wide Range of B-cell Malignancies. Blood. 2005;106:3898–906. doi: 10.1182/blood-2005-01-0355. [DOI] [PMC free article] [PubMed] [Google Scholar]
- 22.Zage PE, Zeng L, Palla S, et al. A Novel Therapeutic Combination for Neuroblastoma: the VEGFR/EGFR/RET Inhibitor Vandetanib with 13-cis-Retinoic Acid. Cancer. 2010;116:2465–75. doi: 10.1002/cncr.25017. [DOI] [PubMed] [Google Scholar]
- 23.Sahlgren C, Gustafsson MV, Jin S, Poellinger L, Lendahl U. Notch Signaling Mediates Hypoxia-Induced Tumor Cell Migration and Invasion. Proc Natl Acad Sci USA. 2008;105:6392–7. doi: 10.1073/pnas.0802047105. [DOI] [PMC free article] [PubMed] [Google Scholar]
- 24.Hughes DPM, Thomas DG, Giordano TJ, Baker LH, McDonagh KT. Cell Surface Expression of Epidermal Growth Factor Receptor and Her-2 with Nuclear Expression of Her-4 in Primary Osteosarcoma. Cancer Res. 2004;64:2047–53. doi: 10.1158/0008-5472.can-03-3096. [DOI] [PubMed] [Google Scholar]
- 25.Garcia-Manero G, Bueso-Ramos C, Daniel J, et al. DNA Methylation Patterns at Relapse in Adult Acute Lymphocytic Leukemia. Clin Cancer Res. 2002;8:1897–903. [PubMed] [Google Scholar]
- 26.Mosse YP, Greshock J, Margolin A, et al. High-resolution Detection and Mapping of Genomic DNA Alterations in Neuroblastoma. Genes Chromosomes Cancer. 2005;43:390–403. doi: 10.1002/gcc.20198. [DOI] [PubMed] [Google Scholar]
- 27.Artavanis-Tsakonas S, Rand MD, Lake RJ. Notch Signaling: Cell Fate Control and Signal Integration in Development. Science. 1999;284:770–776. doi: 10.1126/science.284.5415.770. [DOI] [PubMed] [Google Scholar]
- 28.Morrison SJ, Perez SE, Qiao Z, et al. Transient Notch Activation Initiates an Irreversible Switch from Neurogenesis to Gliogenesis by Neural Crest Stem Cells. Cell. 2000;101:499–510. doi: 10.1016/s0092-8674(00)80860-0. [DOI] [PubMed] [Google Scholar]
- 29.Cornell RA, Eisen JS. Notch in the Pathway: The Roles of Notch Signaling in Neural Crest Development. Semin Cell Dev Biol. 2005;16:663–72. doi: 10.1016/j.semcdb.2005.06.009. [DOI] [PubMed] [Google Scholar]
- 30.Ohtsuka T, Ishibashi M, Gradwohl G, et al. Hes1 and Hes5 as Notch Effectors in Mammalian Neuronal Differentiation. EMBO J. 1999;18:2196–2207. doi: 10.1093/emboj/18.8.2196. [DOI] [PMC free article] [PubMed] [Google Scholar]
- 31.Gaiano N, Fishell G. The Role of Notch in Promoting Glial and Neural Stem Cell Fates. Annu Rev Neurosci. 2002;25:471–490. doi: 10.1146/annurev.neuro.25.030702.130823. [DOI] [PubMed] [Google Scholar]
- 32.Kabos P, Kabosova A, Neuman T. Blocking HES1 Expression Initiates GABAergic Differentiation and Induces the Expression of p21(CIP1/WAF1) in Human Neural Stem Cells. J Biol Chem. 2002;277:8763–8766. doi: 10.1074/jbc.C100758200. [DOI] [PubMed] [Google Scholar]
- 33.Basak O, Taylor V. Identification of Self-Replicating Multipotent Progenitors in the Embryonic Nervous System by High Notch Activity and Hes5 Expression. Eur J Neurosci. 2007;25:1006–1022. doi: 10.1111/j.1460-9568.2007.05370.x. [DOI] [PubMed] [Google Scholar]
- 34.Hatakeyama J, Bessho Y, Katoh K, et al. Hes Genes Regulate Size, Shape and Histogenesis of the Nervous System by Control of the Timing of Neural Stem Cell Differentiation. Development. 2004;131:5539–5550. doi: 10.1242/dev.01436. [DOI] [PubMed] [Google Scholar]
- 35.Fan X, Mikolaenko I, Elhassan I, et al. Notch1 and Notch2 Have Opposite Effects on Embryonal Brain Tumor Growth. Cancer Res. 2004;64:7787–7793. doi: 10.1158/0008-5472.CAN-04-1446. [DOI] [PubMed] [Google Scholar]
- 36.Ferrari-Toninelli G, Bonini SA, Uberti D, et al. Targeting Notch Pathway Induces Growth Inhibition and Differentiation of Neuroblastoma Cells. Neuro-Oncology. 2010 doi: 10.1093/neuonc/noq101. [DOI] [PMC free article] [PubMed] [Google Scholar]
- 37.Funahashi Y, Hernandez SL, Das I, et al. A Notch1 Ectodomain Construct Inhibits Endothelial Notch Signaling, Tumor Growth, and Angiogenesis. Cancer Res. 2008;68:4727–35. doi: 10.1158/0008-5472.CAN-07-6499. [DOI] [PMC free article] [PubMed] [Google Scholar]
- 38.Kageyama R, Ohtsuka T, Hatakeyama J, Ohsawa R. Roles of bHLH Genes in Neural Stem Cell Differentiation. Exp Cell Res. 2005;306:343–348. doi: 10.1016/j.yexcr.2005.03.015. [DOI] [PubMed] [Google Scholar]
- 39.Attiyeh AF, London WB, Mossé YP, et al. Chromosome 1p and 11q Deletions and Outcome in Neuroblastoma. N Engl J Med. 2005;353:2243–53. doi: 10.1056/NEJMoa052399. [DOI] [PubMed] [Google Scholar]
- 40.Maris JM, Matthay KK. Molecular Biology of Neuroblastoma. J Clin Oncol. 1999;17:2264–79. doi: 10.1200/JCO.1999.17.7.2264. [DOI] [PubMed] [Google Scholar]
- 41.White PS, Thompson PM, Gotoh T, et al. Definition and Characterization of a Region of 1p36.3 Consistently Deleted in Neuroblastoma. Oncogene. 2005;24:2684–94. doi: 10.1038/sj.onc.1208306. [DOI] [PubMed] [Google Scholar]
Associated Data
This section collects any data citations, data availability statements, or supplementary materials included in this article.