Abstract
A common teleradiology practice is digitizing films. The costs of specialized digitizers are very high, that is why there is a trend to use conventional scanners and digital cameras. Statistical clinical studies are required to determine the accuracy of these devices, which are very difficult to carry out. The purpose of this study was to compare three capture devices in terms of their capacity to detect several image characteristics. Spatial resolution, contrast, gray levels, and geometric deformation were compared for a specialized digitizer ICR (US$ 15,000), a conventional scanner UMAX (US$ 1,800), and a digital camera LUMIX (US$ 450, but require an additional support system and a light box for about US$ 400). Test patterns printed in films were used. The results detected gray levels lower than real values for all three devices; acceptable contrast and low geometric deformation with three devices. All three devices are appropriate solutions, but a digital camera requires more operator training and more settings.
Keywords: Teleradiology, Diagnostic image quality, Image acquisition, Image quality, PACS, Image viewer, Film digitizer, X-ray digital capture
Introduction
A common teleradiology practice in rural healthcare centers in the developing world is digitizing X-ray films for remote diagnosis. The main processes involved in teleradiology are: digital film capture, file transmission, data storage, image display, and generation of results. Capture devices are one of the most important factors that influence diagnostic quality in teleradiology. The costs of specialized digitizers for digital capture of X-ray films are elevated for the developing world, so there is a trend to use conventional scanners and digital cameras. In order to evaluate diagnostic accuracy with these alternative devices, studies have been carried out to compare conventional interpretation of X-ray films against specialized film digitizers [1–4], flatbed scanners, digital cameras [5–7], combinations of devices [8, 9], or alternative modalities such as computed radiography [10–12]. Usually, comparison of sensitivity, specificity, or accuracy is carried out. However, the above-mentioned studies require sample selection of clinical cases with one or more pathologies, as well as a control subjects (normal cases). In general, sample sizes are large, and cases require interpretation by several radiologists to detect moderate to small differences. According to Obuchowski [13], a receiver operating characteristic (ROC) curve study with chest X-rays such as this one requires for each device 240 observations for each analyzed variable (for six observers and 40 cases); then, a statistical analysis of the selected variables is done in comparison with a previously selected “Gold Standard”. We propose a pattern-based methodology that would allow faster results at lower costs when compared with traditional ROC curve studies, which require great dedication and effort from both observers and researchers.
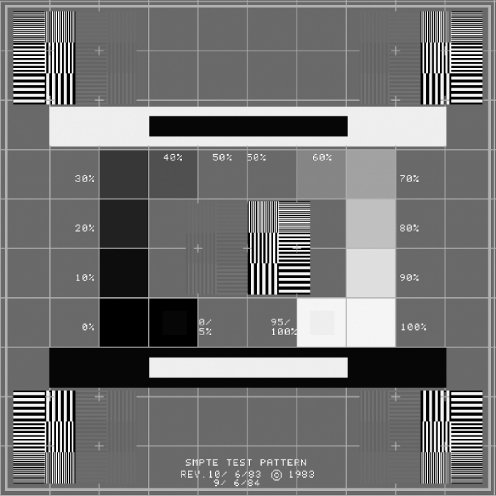
Some pattern-based studies [14, 15] have used mainly the RP-133 standard pattern (Fig. 1), created by the Society of Motion Picture and Television Engineers (SMPTE) [16–18]. In addition to the SMPTE pattern, two custom-made patterns were evaluated to assess imaging capture devices.
Fig. 1.
RP-133 SMPTE test pattern
The objective of this study was to compare the performance of three different cost digital capture devices (a specialized film digitizer, a conventional flatbed scanner, and a digital camera), by assessing picture characteristics (present in the X-ray film to be digitized) such as spatial resolution, gray level, contrast, and geometric deformation. This would allow generating “characteristic device curves” for the above-mentioned variables. Pathologies detected by X-rays could be subsequently characterized in terms of the spatial resolution, gray level, contrast, and frequently measured distances and angles (that may be affected by geometric deformation), in order to predict the likelihood of pathology detection with a specific device.
Materials and Methods
Digital Capture Devices
Each X-ray film was digitized using the following devices: (a) an iCR-612SL (iCRcompany, Torrance, CA) film digitizer, hereafter referred to as ICR, with a maximum spatial resolution of 875 dpi (29-μm pixel spot size), 16-bit grayscale, an optical density (OD) of 3.6, implemented Twain protocol, with a lightbox included and at a cost of US $15,000; (b) a PowerLook 2100XL (UMAX Technologies Inc., Dallas, TX) flatbed scanner, hereafter referred to as UMAX, with a maximum spatial resolution of 800 dpi (32-μm pixel spot size), eight-bit grayscale, an OD of 3.4, implemented Twain protocol and at a cost of US $1,800; and (c) a Lumix DMC-FZ28 (Panasonic Corporation of North America, Secaucus, NJ) digital camera, hereafter referred to as LUMIX, which is a 10-megapixel camera with an aspherical lens, a focal length of 4.8 to 86.4 mm, a minimum focal distance of 30 cm, a 1/2.33-in. charge-coupled device (CCD), film speed of 100 to 6400 International Organization for Standardization (ISO), manual settings (for aperture, exposure, and ISO), black/white (BW) mode, and a cost of US $450. For this study, the digital camera required an extra cost: a specially designed structure to support the camera (US $400), which will guarantee alignment with the lightbox (the lightbox included with the ICR was used).
Test Pattern Films
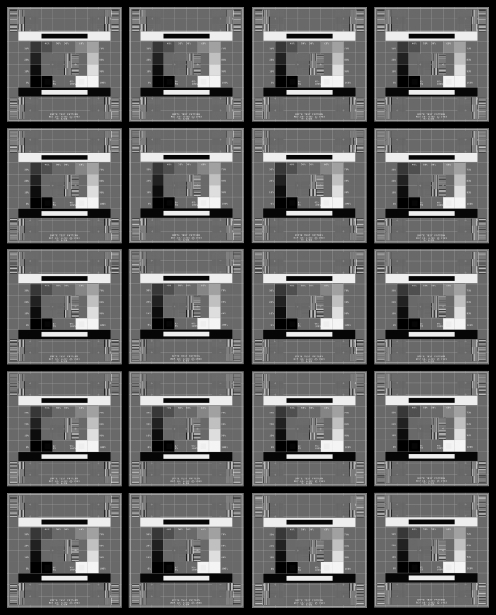
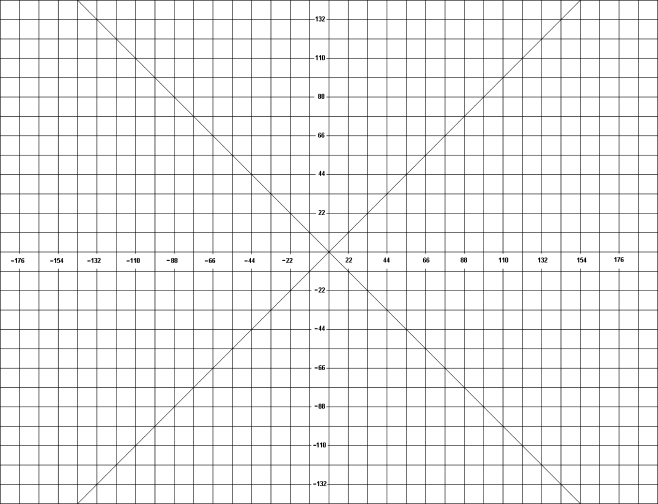
Three images were designed using test patterns in DICOM format, which were printed on 35 × 43 cm films with an Agfa Drystar 5503 (Agfa HealthCare NV, Belgium) digital film printer, at a 508-dpi resolution, 50-μm pixels, and a 14-bit contrast. The standard pattern RP-133 (Fig. 1) was used in the first film, which was printed 20 times on a 4 × 5 matrix as shown in Fig. 2. This was done in order to measure the variables of this study in different regions of the film. On the second film, a uniformly distributed black to white 52-gray-level scale was printed (Fig. 3). Horizontally, the gray-level variation was close to 2%, while, vertically, the variation was close to 4%. The third custom-made film was a 396 × 286 mm grid with horizontal and vertical lines separated every 11 mm (Fig. 4). The center of the grid was at the coordinates (0, 0).
Fig. 2.
Test film 1: printed with 4 × 5 RP-133 patterns
Fig. 3.
Test film 2: grayscale. Used in gray level detection tests
Fig. 4.
Test film 3: grid pattern. Used in geometric deformation tests
Capture Software and Imaging Display
The AndesPACS software (developed at the University of Los Andes by one of the authors of this study) was used to capture, store, and display the images using the DICOM standard. This software has the following image manipulation functions: brightness/contrast, window/level, negative/positive, filters, zoom, rotation, flip, and measurements (in millimeters and pixels). In addition, a region of interest (ROI) tool was included to measure gray levels, as required for the variables of this study. According to the standard for teleradiology [19] of the American College of Radiology (ACR), digitized films must be displayed on a monitor with a large matrix, minimum ten-bit grayscale, 50 ft-L luminance (171 cd/m2). Thus, a NEC MD213MG monitor (0.21-mm dot pitch, 3 megapixels, ten-bit grayscale) was selected.
Study Variables
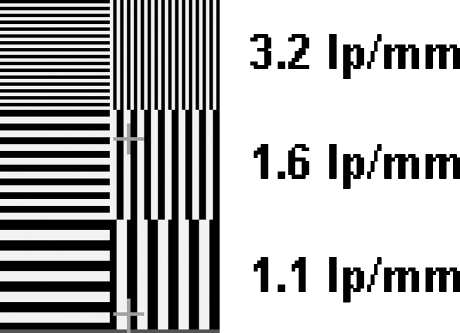
Spatial Resolution Spatial resolution was determined by the number of line pairs per millimeter (lp/mm) that each device can detect from those actually printed on the film. The ACR standard for teleradiology [19] sets that digitized films must have a resolution of 2.5 lp/mm. Films were captured at different spatial resolutions: with specialized digitizer and flatbed scanner ranged from 75 to 750 dpi and with the digital camera resolution varies between 3 and 10 megapixels. For each digital capture file, the black–white line sequences visualized in the RP-133 pattern (Fig. 5) were analyzed in both the higher- and lower-contrast-resolution captures. First, a line sequence was selected if it could be correctly distinguished in the horizontal and vertical planes, including both the center and periphery of the film. The resolution values for our printed film are also shown in Fig. 5. Theoretical pixel size (calculated according to the selected resolution in the device) and real pixel size (calibrated from the digital file) were calculated. Spatial resolution in line pairs per millimeter was inferred from pixel size (two pixels per line pair) divided by two given the Nyquist theorem. Theoretical resolution was calculated using theoretical pixel size, while maximum expected resolution was calculated using real pixel size.
Fig. 5.
RP-133 vertical and horizontal high- and low-contrast-resolution patterns
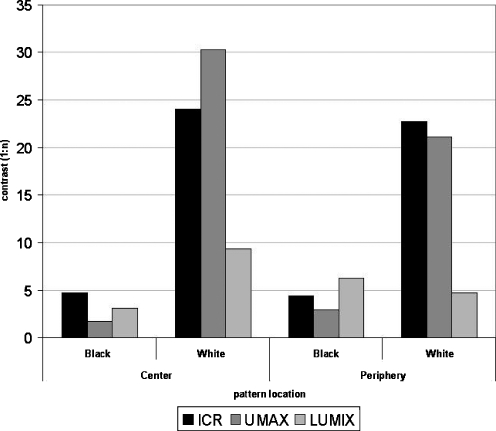
Contrast This is defined as the device proficiency to detect gray levels in regions immersed in areas where gray levels appear very similar (low contrast). For this purpose, the film shown in Fig. 2 was used: In the generated digital file, gray levels were measured in the inner and outer regions of the black-and-white contrast pattern RP-133 (Fig. 6), both in the center and the periphery of the film. The values of printed contrast were 20:1, equivalent to a decrease of 5% to 0% in blacks and an increase of 95% to 100% in whites (0% is black and 100% is white). ROIs with levels of 5% and 95% were included inside corresponding squares (at 0% and 100%, respectively). The 5% difference corresponds to 12.75 gray levels for images at eight bits (256 grays levels), i.e., a contrast factor of 20:1.
Fig. 6.
RP-133 inset low-contrast square patterns (black and white)
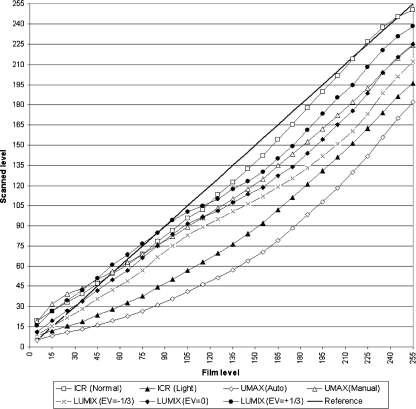
Gray Level This determines how each device detects gray levels present on the films. This test was based on pattern 2 (Fig. 3). Digitizing resolution was changed and applied to several films. Film gray levels versus scanned levels were plotted, and each scanned level was calculated as the mean of gray levels for different spatial resolutions (at the same point). For the specialized digitizer and the flatbed scanner, exposure, gamma, and contrast were adjusted, while, for the digital camera, exposure value compensation (EV) was varied.
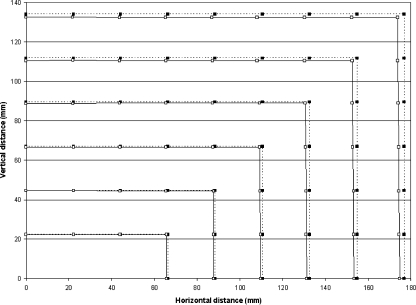
Geometric Deformation This determines how much the captured images stretch or shrink, which is significant when using digital cameras as capture devices. Digital cameras use spherical lenses, which limit the measurements of distances and angles. The grid pattern shown in Fig. 4 was used after calibrating pixel size (dividing the number of pixels between coordinate points (−44, 0) and (44, 0) by 88 mm (which is the distance between these two points). Pixel coordinates in all grid intersections (221 points, for squares of 22 mm) were subsequently measured and stored in a calibration matrix. Each value of this matrix was multiplied by the size of the pixel, generating the coordinates where each point to be displayed (or printed) would remain. This matrix was also used to compare horizontal deformation produced upon moving away from the image center.
Procedure
Each pattern (hard-copy film) was captured with the tree devices and stored in DICOM format (eight-bit grayscale, without compression).
Films were digitized with ICR at different resolutions (75 to 750 dpi), with the option “Normal film” exposure (intermediate between light and dark films) and then with the option “Light film”.
For UMAX, films were digitized at different resolutions (75 to 750 dpi), with the option “Automatic” exposure as well as “Manual” exposure with contrast and gamma adjustments.
Hard-copy films were placed in a lightbox and photographed with the LUMIX at 10, 5, 3, and 0.3 megapixels. Additionally, the intelligent aperture mode was used in a BW format with auto white balance and auto focus, without flash, and in a dark environment at a distance of 50 cm. Films were covered with a mask to block the lightbox light outside the film. Photographs were taken with EV adjusted manually between −1 and +1 EV, while other settings were automatically adjusted by the camera: focal length of 7.6 to 8.2 mm, aperture of F/3.0 to F/3.2, exposure time of 1/40 to 1/30 s, and ISO of 100 to 160.
Obtained digital images were stored in DICOM format and were displayed using the AndesPACS software. Data was acquired using the ROI and measurement tools and transcribed to Microsoft Excel (Microsoft Corporation, Redmond, WA, USA) to calculate and plot the different variables (e.g., to plot the characteristics curves as the real value versus the captured value). Measurements were taken twice, by an operator and then revised by one of the authors of this study.
Average gray level of pixels in regions of 5% contrast was measured with the best gray level detection test: ICR in “Normal film” mode, UMAX in “Manual” mode, and LUMIX with EV=+1/3.
Results
Spatial Resolution Spatial resolution values for ICR and UMAX are shown in Table 1. The relative difference between horizontal and vertical pixel size for ICR and UMAX (at 75 to 750 dpi) is very low (average = 1.88%, SD = 0.86% for ICR, average = 0.19%, SD = 0.11% for UMAX), obtaining similar results for patterns located at the center and at the periphery of the film. Then, the results in Table 1 apply to any region of the pattern, in the horizontal and vertical planes. Table 2 shows the spatial resolution for LUMIX digital camera at different resolutions in megapixels as well as in the pixel matrix. Whatever the resolution was, the pattern of 3.2 lp/mm was not detected, which was expected as the maximum possible value was 2.08 lp/mm at 10 megapixels. At maximum resolution, the 1.6 lp/mm pattern was detected; at lower resolutions, only the 1.1 lp/mm pattern was detected.
Table 1.
ICR and UMAX spatial resolution
| Scanning resolution (dpi) | Pixel size (mm) | Spatial resolution (lp/mm) | ||||||
|---|---|---|---|---|---|---|---|---|
| ICR | UMAX | ICR | UMAX | |||||
| Theoretical | Actual | Actual | Theoretical | Max. expected | Detected in pattern | Max. expected | Detected in pattern | |
| 75 | 0.339 | 0.331 | 0.339 | 0.74 | 0.76 | – | 0.74 | – |
| 150 | 0.169 | 0.165 | 0.169 | 1.48 | 1.51 | 1.10 | 1.48 | 1.10 |
| 225 | 0.113 | 0.110 | 0.113 | 2.21 | 2.27 | 1.60 | 2.22 | 1.60 |
| 300 | 0.085 | 0.083 | 0.085 | 2.95 | 3.03 | 1.60 | 2.96 | 1.60 |
| 375 | 0.068 | 0.064 | 0.068 | 3.69 | 3.88 | 3.20 | 3.69 | 1.60 |
| 525 | 0.048 | 0.048 | 0.048 | 5.17 | 5.18 | 3.20 | 5.17 | 3.20 |
| 750 | 0.034 | 0.033 | 0.034 | 7.38 | 7.57 | 3.20 | 7.38 | 3.20 |
Table 2.
LUMIX spatial resolution
| Camera resolution | Actual pixel size | Spatial resolution (lp/mm) | |||||
|---|---|---|---|---|---|---|---|
| Max. expected | Center | Periphery | |||||
| Mega pixels | Pixel matrix | Horizontal | Vertical | Horizontal | Vertical | ||
| 10 | 3,648 × 2,736 | 0.120 | 2.08 | 1.6 | 1.6 | 1.6 | 1.6 |
| 5 | 2,560 × 1,920 | 0.181 | 1.38 | 1.1 | 1.1 | 1.25 | 1.38 |
| 3 | 2,048 × 1,536 | 0.221 | 1.13 | 1.1 | 1.1 | 1.1 | 1.1 |
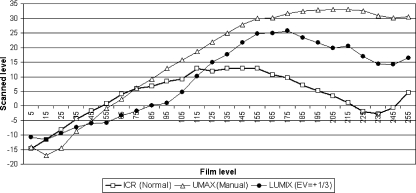
Gray Level Detection Figure 7 shows the detected gray level values (eight-bit gray level, 0 black, 255 white). ICR adjusted in the “Normal film” exposure function came closer to the real film value (reference line at 45°). ICR adjusted for “Light film” exposure was unable to obtain a quality digital file given that the hard-copy film should be underexposed (grays uniformly distribute between black and white). UMAX adjusted in “Automatic” capture mode obtained darker images, reaching a maximum white level of 195, while in “Manual” mode (Exposure 255, Gamma 2.6, and Contrast 0) obtained clearer images (maximum white level of 225). With the LUMIX camera, overexposed photograph at EV = 1/3 captured higher quality images for different EV values. Figure 7 does not show results for different LUMIX exposures (EV = −1, −2/3, +2/3, +1) because results were to inferior when compared with the standard. Figure 8 shows the difference between the scanned value and the reference for each device with the adjustments that resulted in the best-obtained images. The lowest difference, averaging 52 measured levels, was for ICR in “Normal film” exposure mode (average = 8, SD = 4.78), followed by LUMIX with EV = +1/3 (average = 14, SD = 8.58), while UMAX showed the greatest difference in “Manual” mode (average = 21, SD = 11.36).
Fig. 7.
Gray level detection
Fig. 8.
Gray level detection differences with the reference
Contrast Figure 9 shows the contrast values found for whites and blacks in the center and periphery of the film. The contrast values for blacks are well below the expected value of 20:1. LUMIX had best results at the periphery but still low (6:1). For white contrast, the values were closer to the 20:1 contrast. In this case, ICR is the closest to the reference, while LUMIX far behind (5:1 at periphery). Differences in white or black contrast were not seen for ICR, either at the center or periphery the periphery in the obtained digital images.
Fig. 9.
Contrast detected in low-contrast inset squares (black and white)
Geometric Deformation Figure 10 shows pixel position at the grid intersections in the first quadrant of the grid film (Fig. 4). The black squares represent the real pixel position, while the white squares represent the pixel position upon being scanned and calibrated. Only the LUMIX data are shown, as the difference was not visible in the plot for ICR and UMAX. The difference was greater at the image periphery (average = 2.4 mm, SD = 0.636 mm for the 15 peripheral points), in contrast to the central points (average = 0.3 mm, SD = 0.276 mm for the five central points). Differences were more visible in the horizontal plane than in the vertical direction.
Fig. 10.
First quadrant deformation with LUMIX
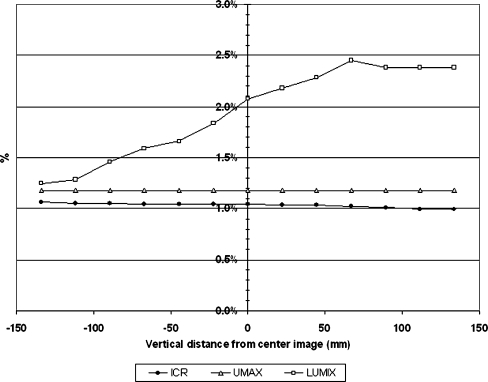
Figure 11 presents the percentage of error upon taking measurements of horizontal distances at different heights. Error at a horizontal distance of 35.6 cm for ICR is around 1% (3.7 mm) and 1.2% (4.2 mm) for UMAX, regardless of the height. For LUMIX, the error did not exceed 2.4% (8.5 mm), with an average of 1.9% (6.9 mm) and a minimum of 1.3% (4.5 mm).
Fig. 11.
Horizontal deformation comparison
Discussion
Regarding spatial resolution, the three devices behaved as the expected theoretical values. The size of the UMAX pixels matched the expected size, while the ICR ones were slightly smaller and less homogeneous in horizontal and vertical directions. ICR and UMAX detected a pattern of 3.2 lp/mm (greater than the minimum of 2.5 lp/mm of the ACR standard), while the expected value of the digital camera at its maximum resolution of 10 megapixels was lower (2.08 lp/mm) and only able to detect up to the 1.6 lp/mm pattern. However, at this resolution, pixel size was 0.129 mm, which was closer to that predicted by Ikezoe [20] for the detection of interstitial opacities with storage phosphor radiography (0.1 mm), thereby raising the expectation that this camera could provide good results in clinical use. At 75 dpi, no device appropriately detected any of the three resolution patterns presented on the films (i.e., 1.1, 1.6, and 3.2 lp/mm). Detection proficiency in the horizontal and vertical planes was the same for each device. For expected resolutions, all patterns with a lower value should be detected. It was observed that, in order to detect a resolution of 3.2 lp/mm, UMAX must use a 525-dpi resolution (when it was expected to achieve it at 375 dpi), while ICR was able to detect the expected patterns at each resolution. However, a pixel size measured as very small does not guarantee higher spatial resolution (measured in line pairs per millimeter), given that the gray level detection considerably affects the sharpness of the high- and low-contrast-resolution patterns. In this sense, the spatial resolution test is more a contrast frequency test.
The scanner sensor is a CCD line that is displaced throughout the film, so it will scan the whole film surface, while the digital cameras have an arrangement of various CCD lines that simultaneously capture the entire image (making them faster). In the ICR, the CCD is fixed while the film moves; in UMAX, the film is fixed and the CCD moves; in LUMIX, both the CCD and film are fixed. Differences in resolution in the horizontal and vertical directions were low and constant in all regions of the obtained films, which indicate that the movement of the CCD or the camera static CCD geometry does not affect pixel size. However, motorized equipment requires more frequent maintenance, as failures in small mechanical pieces can cause significant image deformation.
When it comes to gray level detection, it was observed that the three devices tend to produce dark images, moving further away from the real value in whites than the real value in blacks. However, the contrast was maintained for whites (reflected by the parallelism of the image reference) while being lost in blacks (near the black zone there are minor differences, but a saturation induced loss of contrast was observed). This phenomenon was also visualized with the obtained digital patterns in a conventional monitor: white contrast is easily adjusted while black contrast can almost never be adjusted. Camera contrast is also affected by light that arrives to each point in the CCD from the surrounding film areas, so, disperse light will affect all CCD pixels. This mainly affects white contrast finding that represents half of the expected contrast for LUMIX, while with other devices contrast was well above the expected level.
Geometric deformation is minimal for the assessed devices; for scanners, it is homogenous throughout the film, while LUMIX deformation was not symmetric for horizontal measurements at different vertical positions, apparently not due to lenses (as the camera had aspherical lenses), but to the alignment between the film and the camera CCD: Despite having an especially designed structure for this purpose, the CCD only measures a small number of millimeters (0.1 × 0.75 cm approx.) at 50 cm from the film (43 × 35 cm), which makes it almost impossible to obtain perfect parallelism.
Manual adjustments with the UMAX and LUMIX are difficult to reproduce and carry out, requiring training efforts becoming a time-consuming activity due to device setting. Capture time for UMAX at its maximum resolution is near 5 min in contrast to the 30 s required with the ICR. LUMIX captures images instantaneously, but transfer time to the computer is longer than ICR or UMAX. Therefore, it is necessary to compute the total time required for each device pre-setting, image capture, and image transfer to evaluate overall time required for daily activities and derived associated costs.
Evaluation of the same devices [21] in a clinical ROC curve statistical study did not find statistical significant differences in diagnostic accuracy. However, this study was more expensive and time-consuming: The study length was 8 months and included six radiologists, with a factorial design that required 2,448 observations which were analyzed through receiver operating characteristic curves [22, 23] and statistical analysis of variance [24], which are highly complex epidemiological and statistical models to perform.
Conclusion
In general, there were no differences in the performance of the three devices. Although the ICR had the best overall results, the camera works adequately and, in some cases, works better than the UMAX, so factors such as initial costs (e.g., purchase, training), production costs (e.g., time operation, maintenance), and time response will be important to determine the device choice.
For this study, the camera was used with the lightbox included in the specialized digitizer, but, in a real application, the lightbox cost must be added to the camera and its support. For applications in which precise measurements of distances and angles are required, special attention is required using digital cameras due to the geometric deformation produced by the lens or by the loss of alignment between the camera CCD and the lightbox.
Characteristic curves were obtained to detect gray levels and geometric deformation. It was possible to define a quantitative and repeatable test protocol to be used for further evaluation of different devices. In this study, we used patterns with only three values of spatial resolution (3.2, 1.6, and 1.1 lp/mm), and we determined if these were able to be detected by each device. However, in order to obtain a more precise value and a characteristic curve for spatial resolution, it is recommended to use film patterns with higher printed resolutions, like the USAF-1951.
To assess the performance of these devices for clinical trials, images need to be characterized by ROI according to the desired pathology, including the variables analyzed in this study. However, this is subject of a new study, and we might expect that comparative clinical trials for film digitizing purposes, which are statistical in nature and generally very long to carry out, could be avoided.
Acknowledgments
We thank the students of the Universidad de los Andes, who helped with the films capture and the Fundación Santa Fe de Bogotá University Hospital, Colombia, for printing the test pattern films.
Contributor Information
Antonio José Salazar, Phone: +57-1-3394949, FAX: +57-1-3324316, Email: ant-sala@uniandes.edu.co.
Juan Camilo Camacho, Phone: +57-6030303, FAX: +57-4018787, Email: juan.camacho@fsfb.edu.co.
Diego Andrés Aguirre, Phone: +57-6030303, FAX: +57-4018787, Email: diego.aguirre@fsfb.org.co.
References
- 1.Eng J, Mysko WK, Weller GER, Renard R, Gitlin JN, Bluemke DA, Magid D, Kelen GD, Scott WW., Jr Interpretation of emergency department radiographs: A comparison of emergency medicine physicians with radiologists, residents with faculty, and film with digital display. Am J Roentgenol. 2000;175:1233–1238. doi: 10.2214/ajr.175.5.1751233. [DOI] [PubMed] [Google Scholar]
- 2.Powell K, Obuchowski N, Chilcote W, Barry M, Ganobcik S, Cardenosa G. Film-screen versus digitized mammography: assessment of clinical equivalence. Am J Roentgenol. 1999;173:889–894. doi: 10.2214/ajr.173.4.10511142. [DOI] [PubMed] [Google Scholar]
- 3.Slasky BS, Gur D, Good WF, Costa-Greco MA, Harris KM, Cooperstein LA, Rockette HE. Receiver operating characteristic analysis of chest image interpretation with conventional, laser-printed, and high-resolution workstation images. Radiology. 1990;174:775–780. doi: 10.1148/radiology.174.3.2305061. [DOI] [PubMed] [Google Scholar]
- 4.Gitlin J, Narayan A, Mitchell C, Akmal A, Eisner D, Peterson L, Nie D, McClintock T. A comparative study of conventional mammography film interpretations with soft copy readings of the same examinations. J Digit Imaging. 2007;20:42–52. doi: 10.1007/s10278-006-1046-1. [DOI] [PMC free article] [PubMed] [Google Scholar]
- 5.Szot A, Jacobson FL, Munn S, Jazayeri D, Nardell E, Harrison D, Drosten R, Ohno-Machado L, Smeaton LM, Fraser HSF. Diagnostic accuracy of chest X-rays acquired using a digital camera for low-cost teleradiology. Int J Med Inform. 2004;73:65–73. doi: 10.1016/j.ijmedinf.2003.10.002. [DOI] [PubMed] [Google Scholar]
- 6.Krupinski E, Gonzales M, Gonzales C, Weinstein RS. Evaluation of a digital camera for acquiring radiographic images for telemedicine applications. Telemed J e-Health. 2000;6:297–302. doi: 10.1089/153056200750040156. [DOI] [PubMed] [Google Scholar]
- 7.Cone SW, Carucci LR, Yu J, Rafiq A, Doarn CR, Merrell RC. Acquisition and evaluation of radiography images by digital camera. Telemed e-Health. 2005;11:130–136. doi: 10.1089/tmj.2005.11.130. [DOI] [PubMed] [Google Scholar]
- 8.Javadi M, Subhannachart P, Levine S, Vijitsanguan C, Tungsagunwattana S, Dowell SF, Olsen SJ. Diagnosing pneumonia in rural Thailand: Digital cameras versus film digitizers for chest radiograph teleradiology. Int J Infect Dis. 2006;10:129–135. doi: 10.1016/j.ijid.2005.01.007. [DOI] [PMC free article] [PubMed] [Google Scholar]
- 9.Ruess L, Uyehara CF, Shiels KC, Cho KH, O'Connor SC, Person DA, Whitton RK. Digitizing pediatric chest radiographs: Comparison of low-cost, commercial off-the-shelf technologies. Pediatr Radiol. 2001;31:841–847. doi: 10.1007/s002470100002. [DOI] [PubMed] [Google Scholar]
- 10.Kundel HL, Gefter W, Aronchick J, Miller W, Hatabu H, Whitfill CH. Accuracy of bedside chest hard-copy screen-film versus hard- and soft-copy computed radiographs in a medical intensive care unit: Receiver operating characteristic analysis. Radiology. 1997;205:859–863. doi: 10.1148/radiology.205.3.9393548. [DOI] [PubMed] [Google Scholar]
- 11.Kido S, Ikezoe J, Takeuchi N, Kondoh H, Tomiyama N, Jokoh T, Kohno N, Takashima S, Yamagami H, Naito H. Interpretation of subtle interstitial lung abnormalities: Conventional versus storage phosphor radiography. Radiology. 1993;187:527–533. doi: 10.1148/radiology.187.2.8475302. [DOI] [PubMed] [Google Scholar]
- 12.Ueguchi T, Johkoh T, Tomiyama N, Honda O, Mihara N, Hamada S, Murai S, Ogata Y, Matsumoto M, Nakamura H. Full-size digital storage phosphor chest radiography: Effect of 4 K versus 2 K matrix size on observer performance in detection of subtle interstitial abnormalities. Radiat Med. 2005;23:170–174. [PubMed] [Google Scholar]
- 13.Obuchowski NA. Sample size tables for receiver operating characteristic studies. Am J Roentgenol. 2000;175:603–608. doi: 10.2214/ajr.175.3.1750603. [DOI] [PubMed] [Google Scholar]
- 14.Forsberg DA. Quality assurance in teleradiology. Telemed J. 1998;1:107–114. doi: 10.1089/tmj.1.1995.1.107. [DOI] [PubMed] [Google Scholar]
- 15.Tobin M: Evaluation of teleradiology image quality using a SMPTE test pattern. http://www.mikety.net/Articles/MD.SMPTE/SMPTE.html. Accessed 23 Aug 2010
- 16.SoMPaT E. Specifications for medical diagnostic imaging test pattern for television monitors and hard-copy recording cameras. SMPTE J. 1986;95:693–695. [Google Scholar]
- 17.Gray JE, Lisk KG, Haddick DH, Harshbarger JH, Oosterhof A, Schwenker R. Test pattern for video displays and hard-copy cameras. Radiology. 1985;154:519–527. doi: 10.1148/radiology.154.2.3966138. [DOI] [PubMed] [Google Scholar]
- 18.Gray J. Use of the SMPTE test pattern in picture archiving and communication systems. J Digit Imaging. 1992;5:54–58. doi: 10.1007/BF03167824. [DOI] [PubMed] [Google Scholar]
- 19.ACR: American College of Radiology Standard for Teleradiology. Washington, DC: American College of Radiology, 1998
- 20.Ikezoe J, Kohno N, Kido S, Takeuchi N, Johkoh T, Arisawa J, Kozuka T. Interpretation of subtle interstitial chest abnormalities: Conventional radiography versus high-resolution storage-phosphor radiography—A preliminary study. J Digit Imaging. 1995;8:31–36. doi: 10.1007/BF03168064. [DOI] [PubMed] [Google Scholar]
- 21.Salazar AJ, Camacho JC, Aguirre DA: Comparison between different cost devices for digital capture of X-ray films with computed tomography (CT) correlation. Telemedicine and e-Health 14 doi: 10.1089/tmj.2010.0189, 2011
- 22.Fawcett T. An introduction to ROC analysis. Pattern Recognit Lett. 2006;27:861–874. doi: 10.1016/j.patrec.2005.10.010. [DOI] [Google Scholar]
- 23.Hanley JA, McNeil BJ. The meaning and use of the area under a receiver operating characteristic (ROC) curve. Radiology. 1982;143:29–36. doi: 10.1148/radiology.143.1.7063747. [DOI] [PubMed] [Google Scholar]
- 24.Obuchowski NA. Multireader, multimodality receiver operating characteristic curve studies: hypothesis testing and sample size estimation using an analysis of variance approach with dependent observations. Acad Radiol. 1995;2(Suppl 1):S22–S29. [PubMed] [Google Scholar]


