Abstract
Optimization and standardization of radiographic procedures in a health region minimizes patient exposure while producing diagnostic images. This report highlights the dose variation in common computed radiography (CR) examinations throughout a large health region. The RadChex cassette was used to measure the radiation exposure at the table or wall bucky in 20 CR rooms, in seven hospitals, using CR technology from two vendors. Exposures were made to simulate patient exposure (21 cm polymethyl methacrylate) under standard conditions for each bucky: 81 kVp at 100 cm for anteroposterior abdomen table bucky exposures (180 cm for posteroanterior chest wall bucky exposures), using the left, the right, or the center automatic exposure control (AEC) cells. Protocol settings were recorded. An average of 37% variation was found between AEC chambers, with a range between 4% and 137%. A 60% difference in dose was discovered between manufacturers, which was the result of the manufacture’s image processing algorithm and subsequently corrected via software updates. Finally, standardizing AEC cell selection during common chest examinations could reduce patient dose by up to 30%. In a large health region, variation in exam protocols can occur, leading to unnecessary patient dose from the same type of examination. Quality control programs must monitor exam protocols and AEC chamber calibration in CR to ensure consistent, minimal, patient dose, regardless of hospital or CR vendor. Furthermore, this report highlights the need for communication between radiologists, technologists, medical physicist, service engineers, and manufacturers required to optimize CR protocols.
Keyword: Patient dose, Computed radiography, Radiation protection, Radiography, Quality control
Background
Previously, patient dose from common radiographic procedures was monitored between 2001 and 2004, coinciding with the change from film to digital imaging at a large university hospital [1]. For most examinations, there was no increase in patient dose except for chest radiography, where considerable effort was required to optimize patient dose. When the hospital became part of a new consolidated region, assessment of patient dose from common computed radiography (CR) exams was undertaken across the region.
In a single hospital or in a small health region, many methods are available to estimate patient dose. Measuring entrance surface air KERMA with thermoluminescent dosimeters (TLDs) placed on patients undergoing common radiographic procedures is a well-established technique [1–4]. Also, the exposure index (EI) provided by the CR reader gives a direct measure of cassette exposure and can be monitored [5, 6]. Direct measure of air KERMA at the detector can be attained by placing a cassette, containing a dosimeter, inside the bucky [7]. Alternatively, the cassette exposure could be estimated by measuring noise in clinical images obtained from common examinations [8].
Many of these techniques are not suitable for surveying a large health region containing seven hospitals, two CR manufacturers, two different Picture Archiving and Communication Systems (PACS), and two different Radiology Information systems. Use of TLD badges would require a large patient cohort, a time-consuming endeavor with potential for poor data integrity. Use of EI is dependent on CR reader calibration and cassette quality as well as manufacturer type. Measurement of air KERMA is greatly affected by beam quality, scatter, and type of dosimeter used [7]. Finally, measuring image noise for each hospital is a time-consuming task that requires transferring images from each hospital to a central repository through different PACS systems.
This survey investigates the dose associated with common CR examinations in a recently integrated health region consisting of seven hospitals. Due to the large size of this region and the number of CR rooms (20 CR rooms in seven hospitals), which were setup by two different CR manufacturers, this experience report first describes a technique that is independent of the patient, X-ray system, CR cassette, CR reader, and PACS network. Following this description, results of the survey are presented and analyzed. Finally, a framework for quality control procedures throughout the region is presented.
Methods
Due to the challenges associated with the previously described methods of estimating patient dose, a technique was employed that is independent of the patient, X-ray system, CR cassette, CR reader, and PACS network. This technique uses the RadChex Cassette (Diagnostic Imaging Specialists Corporation, St. Malo, MB, Canada) placed inside the bucky.
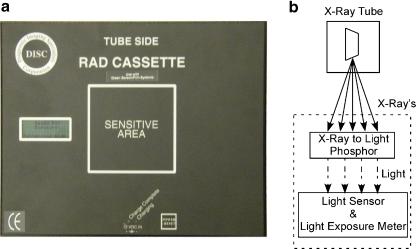
The RadChex cassette operates similar to that of a CR cassette and reader. Photons in the diagnostic imaging range penetrate the RadChex cassette and then interact with a sheet of CR phosphor material. As in all CR systems, about half of the X-ray energy is converted into light, while the rest is stored in the phosphor for subsequent reading. In normal clinical use of a CR cassette, the light produced is lost. In the RadChex cassette, the light produced is measured with light sensors contained inside the light–tight cassette. The RadChex cassette and the process used to convert X-ray energy to light are shown in Fig. 1.
Fig. 1.
a The RadChex cassette containing an electronic imaging plate, light sensor, light exposure meter, microprocessor, and digital display. b X-ray exposure is converted to CRLU’s through the process. The CRLU is displayed on the digital display along with the CR manufacturer’s exposure index
The RadChex cassette reports light quantity in terms of CR light units (CRLU). The relationship between CRLU and absorbed dose is dependent on beam quality, peak kilovoltage (kVp), and scatter conditions. For instance, as stated by the manufacturer in the Radchex’s user manual, exposure of the cassette in air with 3 mm Al filtration yields 1.087 μGy·CRLU−1, while beam filtration with 5 mm Al yields 0.752 μGy·CRLU−1. This dependence is similar to the EI used to estimate exposure in CR and digital radiography (DR) systems, thus the CRLU can be used in the same fashion as EI, namely to estimate cassette exposure.
Initial Regional CR Survey
The CRLU value was measured for each table (T) and wall (W) bucky in 20 CR rooms across seven hospitals (H1–H7), setup by two manufacturers (company A: H1–H2, company B: H3–H7) throughout the region. The room’s anteroposterior (AP) abdomen protocol was used for the table bucky and posteroanterior (PA) chest protocol was used for the wall bucky. Exposures were made under standard conditions for each bucky: 81 kVp at 100 cm (180 cm for chest exposures) source–detector–distance (SDD), using inherent filtration only (>2.3 mm Al), and 21 cm of polymethyl methacrylate (PMMA) placed immediately in front of the bucky to simulate patient scatter. Exposures were performed using the left, right, and center automatic exposure control (AEC) cells.
In addition, the AEC cells utilized for PA chest and AP abdomen protocols were recorded and the measured CRLU was compared to using only the left and right cells in combination.
Manufacture Performance
From the initial regional CR survey, a large dose discrepancy was observed between rooms setup by different CR manufacturers. To exclude manufacturer type from inter-room comparison, two 30 × 24 cm cassettes manufactured by company A (H1–H2) and company B (H3–H7) were exposed consecutively under identical conditions (21 cm PMMA, 81 kVp, 100 cm SDD, center AEC cell, inherent filtration only: >2.3 mm Al). Each cassette was read by a calibrated CR reader made by the corresponding manufacturer. Cassettes were first processed using a linear algorithm. Exposures were then repeated twice and processed with an abdominal and PA chest algorithm. The mean and standard deviation of pixel intensity was obtained from a 50 cm2 region of interest at the center of each image, which comprised approximately 30% of the image. The ratio of mean pixel intensity over the standard deviation of pixel intensity is represented as the signal-to-noise ratio.
Results
Initial CR Survey
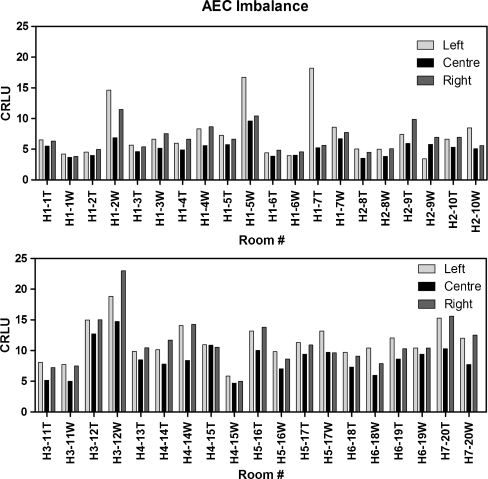
AEC cells were found to be highly imbalanced throughout the region, as shown in Fig. 2. Mean AEC imbalance for the region (all 20 CR rooms) was calculated by taking the average of AEC variation for each individual bucky. AEC variation for each bucky was calculated by taking the difference in the maximum and minimum CRLU values for all the bucky’s AEC cells, and then dividing by the average AEC value. The mean AEC imbalance was 37%. These values are grossly over the 20% criteria used for recalibration of AEC cells [9].
Fig. 2.
The AEC imbalance recorded throughout the region varied by 37% (range, 4–137%)
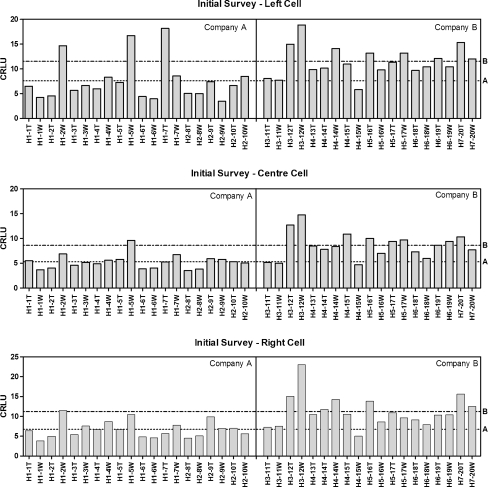
Sorting cassette exposure by manufacturer clearly demonstrates a difference in radiation exposure between rooms setup by company A and B as shown in Fig. 3. The cassette exposure in a room setup by company B was 50–60% higher than that setup by company A. As a result, patients undergoing an examination in a room setup by company B could be unnecessarily exposed to 60% more radiation.
Fig. 3.
Initial survey of regional CR systems using standard exposure conditions for left (top), center (middle), and right (bottom) AEC-enabled exposures. A large difference in mean-CRLU is evident with manufacturer and AEC cell. Dotted line is the mean of company A (left, 7.6 ± 4.2; center, 5.3 ± 1.4; right, 6.7 ± 2.1) and dot–dash line is the mean of company B (left 11.5 ± 3.0; center, 8.6 ± 2.6; right, 11.2 ± 4.0). T table, W wall, H hospital number
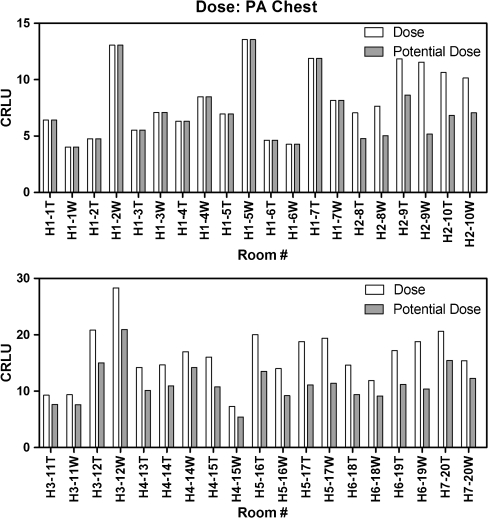
The combination of AECs used for PA chest examinations in each hospital prior to consolidation is listed in Table 1. Surface dose ratio relates the AEC combination used in the hospital to using only the left and right cells, as was previously shown to provide the lowest patient dose [1]. Using the surface dose ratio, a correction for the combination of AEC cells used in a PA chest examination can demonstrate the potential dose reduction as shown in Fig. 4. Simply changing all PA chest protocols throughout the region to use the left and right AEC cells can lead to a mean dose reduction up to 30%, without correcting for AEC imbalance, and this is without adjusting for the variation of kVp used.
Table 1.
Results from our initial survey: AEC cells used during PA chest examination in the seven hospitals
| Hospital | H1 | H2 | H3 | H4 | H5 | H6 | H7 |
|---|---|---|---|---|---|---|---|
| AEC cells | L+R | C | L+C | L+C | C | C | C |
| kVp | 125 | 125 | 125 | 100 | 125 | 130 | 140 |
| Surface dose ratio [1] | 1.0 | 2 | 1.5 | 1.5 | 2.0 | 2.0 | 2.0 |
Fig. 4.
Relative patient dose using CRLU units throughout the health care region for PA chest examinations. Without correcting AEC cell balance, there is an overall dose reduction of 30%, with a maximum dose reduction of 55%. Note: CR rooms from H1 were omitted from the dose reduction calculation due to calibration in a previous survey
Manufacturer Performance
Due to different dose levels measured between manufacturers, additional tests were performed to evaluate manufacturer equipment performance. When cassettes manufactured by each company were exposed under identical conditions and processed with a linear algorithm, the signal-to-noise ratio (SNR) was found to be higher for company B than company A. The SNR was also calculated for exposures processed with the AP abdominal and PA chest algorithms, which were higher for company A. The SNR for each image processing technique is listed in Table 2.
Table 2.
SNR calculated from a uniform exposure and processed with three algorithms from each company
| Manufacturer | Linear | AP abdomen | PA chest |
|---|---|---|---|
| Company A | 86 | 46 | 19 |
| Company B | 129 | 16 | 13 |
Discussion
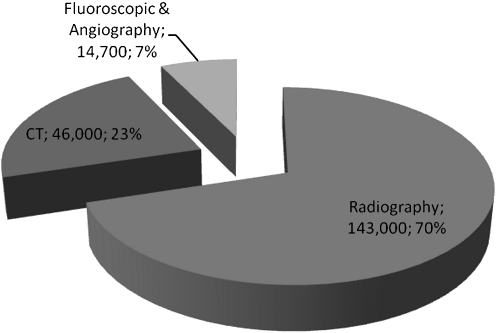
Diagnostic X-ray imaging is comprised of radiography, fluoroscopy, and computed tomography (CT)—three fundamental imaging modalities in patient management. It is well-known that CT and fluoroscopy examinations lead to higher patient doses than standard radiography examinations. However, the frequency in which a patient is prescribed radiographic examinations may lead to many low-dose exposures over their lifetime. Although there is a low probability of a stochastic effect occurring from radiographic examinations, in our experience radiographic examinations make up 70% of all ionizing radiation examinations (Fig. 5). This proportion of examinations is consistent with published literature showing radiographic examinations account for 70–90% of examinations and between 16% and 37% of total patient dose from medical examinations [10, 11]. Thus, it is important to optimize and monitor protocols in radiography.
Fig. 5.
The total number of diagnostic examinations performed in Vancouver General Hospital in 2009
Dose reference levels (DRLs) are typically used to estimate the acceptable dose per examination. Values are derived from large surveys, taken as either the 75th [12–14] or 80th [15] percentile of effective dose range. An examination dose above these percentiles is deemed excessive and should be reduced. In conventional radiography, dose reduction can be achieved by changing film types, speed settings, and calibrating AEC settings. However, plain film examinations are physically limited by the screen and film type and will be either underexposed or overexposed if the exposure is inconsistent. In CR and DR the situation is much different. Underexposure and overexposure does not have the same meaning in the traditional sense. Instead, an underexposed image is too noisy to provide diagnostic information, while an overexposed image has less noise, which improves image quality, but leads to unnecessary patient dose. Compounding this effect is the lack of direct visual feedback of image quality and dose to the technologist after each exposure. In a plain-film system, an over/under exposed film has poor image quality, which is immediately identified and remedied by the technologist. In digital systems, dose is represented by the exposure index, a concept that varies between manufacturers in both definition and calculation [16]. Small incremental changes in the exposure index over time may not be perceived by the technologist and will lead to “dose creep,” a common phenomenon in digital radiography.
CR examinations usually have higher doses than both DR and plain-film radiography [1, 17–20]. This increased dose is required to provide diagnostic quality images and is justified by the benefits associated with CR systems, including digital image processing, PACS storage, and easy conversion of existing plain-film radiography rooms. However, large variations in dose may occur within a given hospital. Imaging technique (kVp, mAs), AEC settings, and AEC balance can effect patient dose and thus require constant monitoring.
In the ideal situation, a patient undergoing a specific radiographic examination should receive the same radiation dose, and thus stochastic risk, from an identical examination conducted in any radiographic room within a given health region. As the results of this study demonstrate, dose variations within a large health region can vary significantly. In many instances, dose variation can be reduced by standardizing protocol settings, such as the AEC cells used in chest examinations [1]. However, in some instances, a reduction in dose variation is not as simple, such as the difference in manufacturer dose, which was were 60% higher in CR room’s setup by company B.
Clearly, a dose increase of 60% is unnecessary if diagnostic quality images can be obtained with less exposure. Unfortunately, due to the complexity of these systems, simply changing the imaging technique may not result in a dose-reduced, diagnostic quality radiograph. In CR systems, factors other than imaging technique can influence image quality. Technically, these include: sensitivity of CR phosphor in cassettes, efficiency of CR readers, and data processing algorithms. Comparing the SNR performance of each company’s system using a linear processing algorithm demonstrated the technology provided by company B outperformed company A (Table 2, SNR: 129 vs. 86). However, when the uniform exposures were processed using PA chest and AP abdomen protocols, the SNR of company B was lower than company A. This result indicated the image processing algorithm utilized by company B was not as effective as company A, thus requiring more dose to achieve comparable SNR. These results were presented to representatives of company B and the issue was remedied in subsequent software updates.
The above discussion highlights the need for vendor/end-user cooperation. In modern imaging systems, simply adjusting the physical imaging parameters (kVp, mAs, filtration, etc…) to reduce dose is not adequate as most systems utilize image processing that is inaccessible to the operator.
The results of this study also highlight the need for testing in addition to monitoring local patient dose indicators. Use of DRLs is a valuable tool to establish examination dose levels. However, the retrospective nature of DRL surveys requires patients be irradiated. This retrospective approach will lead to unnecessary patient dose and depending on the frequency of surveys lead to unnecessary patient dose over many years. It is therefore prudent to implement a proactive quality control program, which compliments DRL surveys. Recently, Health Canada published Safety Code 35—Radiation Protection in Radiology [9], which lays the framework for a quality control program, which when implemented, will compliment current DRL surveys.
To effectively reduce dose levels throughout this large health region, formulation of a strategic plan was necessary. As a blueprint, a five-phased plan is outlined as follows:
It is imperative to educate all staff members on carcinogenic effects of radiation and safe radiation practices;
Each hospital must agree to fully participate in a dose reduction program;
Set a target dose per procedure with consistent AEC balance;
Review image quality to ensure examinations are of clinical grade and adjust image settings if required;
Implement Safety Code 35, or national equivalent, quality control program to monitor equipment performance and survey DRLs.
This implementation will require a conscious effort among all parties in the radiological community—the radiologists, technologists, medical physicists, and service engineers. In addition, an open dialog with manufacturers is essential as differences in manufacturer equipment and preferred settings can highly influence patient dose.
Acknowledgments
The authors would like to thank all the staff at the various radiology departments across the Vancouver Coastal Health Authority for their participation in this work.
Contributor Information
Yogesh Thakur, Phone: +1-604-8754111, FAX: +1-604-8755498, Email: yogesh.thakur@vch.ca.
Thorarin A. Bjarnason, Phone: +1-604-8754111, Email: thor.bjarnason@coolth.ca
Kevin Hammerstrom, Phone: +1-604-8754111, Email: Kevin.Hammerstrom@vch.ca.
Lorie Marchinkow, Phone: +1-604-8754111, Email: Lorie.Marchinkow@vch.ca.
Tim Koch, Phone: +1-604-8754111, Email: tim.koch@vch.ca.
John E. Aldrich, Phone: +1-604-8754158, Email: john.aldrich@vch.ca
References
- 1.Aldrich JE, Duran E, Dunlop P, Mayo JR. Optimization of dose and image quality for computed radiography. J Digit Imaging. 2006;19:126–131. doi: 10.1007/s10278-006-9944-9. [DOI] [PMC free article] [PubMed] [Google Scholar]
- 2.Berni D, Gori C, Lazzari B, Mazzocchi S, Rossi F, Zatelli G. Use of TLD in evaluating diagnostic reference levels for some radiological examinations. Radiat Prot Dosimetry. 2002;101:411–413. doi: 10.1093/oxfordjournals.rpd.a006013. [DOI] [PubMed] [Google Scholar]
- 3.Dierckx D, Constales K, Gerardy N, Goegebuer T, Persyn K. Patient dosimetry measurements in 50 radiology departments in Belgium. Radiat Prot Dosimetry. 2005;117:135–138. doi: 10.1093/rpd/nci726. [DOI] [PubMed] [Google Scholar]
- 4.Bacher K, Smeets P, Bonnarens K, DeHauwere A, Verstraete K, Thierens H. Dose reduction in patients undergoing chest imaging: digital amorphous silicon flat-panel detector versus conventional film-screen radiography and phosphor-based computed radiography. Am J Roentgenology. 2003;181:923–929. doi: 10.2214/ajr.181.4.1810923. [DOI] [PubMed] [Google Scholar]
- 5.Butler ML, Rainford L, Last J, Brennan PC. Are exposure index values consistent in clinical practice? A multi-manufacturer investigation. Radiat Prot Dosimetry. 2010;139(1–3):371–374. doi: 10.1093/rpd/ncq094. [DOI] [PubMed] [Google Scholar]
- 6.Vano E, et al. Paediatric entrance doses from exposure index in computed radiography. Phys Med Biol. 2008;53:3365–3380. doi: 10.1088/0031-9155/53/12/020. [DOI] [PubMed] [Google Scholar]
- 7.Doyle P, Gentle D, Martin CJ. Optimising automatic exposure control in computed radiography and the impact on patient dose. Radiat Prot Dosim. 2005;114:236–239. doi: 10.1093/rpd/nch548. [DOI] [PubMed] [Google Scholar]
- 8.Doyle P, Martin CJ, Gentle D. Dose-image quality optimisation in digital chest radiography. Radiat Prot Dosim. 2005;114:269–272. doi: 10.1093/rpd/nch546. [DOI] [PubMed] [Google Scholar]
- 9.Safety Code 35: Radiation protection in radiology—large facilities, Health Canada., 2008
- 10.Scanff P, Donadieu J, Pirard P, Aubert B. Population exposure to ionizing radiation from medical examinations in France. BJR. 2008;81:204–213. doi: 10.1259/bjr/24344062. [DOI] [PubMed] [Google Scholar]
- 11.Mettler F, et al. Radiologic and nuclear medicine studies in the united states and worldwide: frequency, radiation dose, and comparison with other radiation sources—1950–2007. Radiology. 2009;253:520–531. doi: 10.1148/radiol.2532082010. [DOI] [PubMed] [Google Scholar]
- 12.Wall BF. Implementation of DRLs in the UK. Radiat Prot Dosim. 2005;114:183–187. doi: 10.1093/rpd/nch505. [DOI] [PubMed] [Google Scholar]
- 13.D Hart et al: Doses to patients from medical X-ray examinations in the UK—1995 review, NRPB R286, 1996 [DOI] [PubMed]
- 14.European Guidelines on Quality Criteria for Diagnostic Radiographic Images, European Commission. 1995
- 15.Gray J, et al. Reference values for diagnostic radiology: application and impact. Radiology. 2005;235:354–358. doi: 10.1148/radiol.2352020016. [DOI] [PubMed] [Google Scholar]
- 16.Shepard SJ, et al: An exposure indicator for digital radiography, Report of AAPM Task Group 116, 2009 [DOI] [PMC free article] [PubMed]
- 17.Fernandez JM, Ordiales JM, Guibelalde E, Prieto C, Vano E. Physical image quality comparison of four types of digital detector for chest radiology. Radiat Prot Dosimetry. 2008;129:140–143. doi: 10.1093/rpd/ncn026. [DOI] [PubMed] [Google Scholar]
- 18.Gruber M, Uffmann M, Weber M, Prokop M, Balassy C, Schaefer-Prokop C. Direct detector radiography versus dual reading computed radiography: feasibility of dose reduction in chest radiography. Eur Radiol. 2006;16:1544–1550. doi: 10.1007/s00330-005-0077-1. [DOI] [PubMed] [Google Scholar]
- 19.Lu ZF, Nickoloff EL, So JC, Dutta AK. Comparison of computed radiography and film/screen combination using a contrast-detail phantom. Appl Clin Med Phys. 2003;4:91–98. doi: 10.1120/1.1524950. [DOI] [PMC free article] [PubMed] [Google Scholar]
- 20.Compagnone G, Casadio Baleni M, Pagan L, Calzolaio FL, Barozzi L, Bergamini C. Comparison of radiation doses to patients undergoing standard radiographic examinations with conventional screen-film radiography, computed radiography and direct digital radiography. BJR. 2006;79:899–904. doi: 10.1259/bjr/57138583. [DOI] [PubMed] [Google Scholar]


