

Abstract
Fragment based drug design (FBDD) starts with finding fragment-sized compounds that are highly ligand efficient and can serve as a core moiety for developing high affinity leads. Although the core-bound structure of a protein facilitates the construction of leads, effective design is far from straightforward. We show that protein mapping, a computational method developed to find binding hot spots and implemented as the FTMap server, provides information that complements the fragment screening results and can drive the evolution of core fragments into larger leads with a minimal loss or, in some cases, even a gain in ligand efficiency. The method places small molecular probes, the size of organic solvents, on a dense grid around the protein, and identifies the hot spots as consensus clusters formed by clusters of several probes. The hot spots are ranked based on the number of probe clusters, which predicts the binding propensity of the subsites and hence their importance for drug design. Accordingly, with a single exception the main hot spot identified by FTMap binds the core compound found by fragment screening. The most useful information is provided by the neighboring secondary hot spots, indicating the regions where the core can be extended to increase its affinity. To quantify this information, we calculate the density of probes from mapping, which describes the binding propensity at each point, and show that the change in the correlation between a ligand position and the probe density upon extending or repositioning the core moiety predicts the expected change in ligand efficiency.
Keywords: Protein mapping, protein docking, drug design, ligand efficiency, affinity prediction
INTRODUCTION
Fragment based drug discovery (FBDD) has become an important approach to the identification of new chemical leads, with numerous reviews published on its technical aspects and on the development of lead-like compounds obtained using this approach.1–12 FBDD involves searches in libraries of compounds that have molecular weight (MW) between 150 and 250 Da, substantially smaller than compounds used in traditional high throughput screening (HTS). Since the number of theoretical compounds increases exponentially with MW, screening smaller compounds implies that the relevant chemical space can be more fully explored.1 In addition, it is easier to find a small molecule matching a particular subsite than a larger molecule that is optimal for an entire ligand binding site; thus FBDD usually yields higher hit rates than HTS. Since the binding affinity of compounds has been shown to grow approximately linearly with their MW,13 the affinities of different-sized fragments and related compounds are usually compared in terms of their ligand efficiency (LE), which is defined as the binding free energy per heavy atom.14
The first step in FBDD is the identification of fragment hits with sufficiently high LE. Since small compounds bind with low affinity (usually over 100 µM), the screening of fragment libraries requires special biophysical techniques such as protein-ligand NMR,15,16 or X-ray crystallography.17,18 A number of companies have acquired substantial experience with these approaches and developed efficient technologies for the identification of fragment hits that can be used as “cores” for the development of larger and higher affinity ligands.1–6 The next step of FBDD is evolving the core fragment into such leads, which involves either optimal extension of the fragment into neighboring pockets or in situ optimization of fragments by better selection of the functional groups binding to various regions of the site. If available, the fragment-bound protein structure provides substantial insight into changes that may lead to higher affinity; the structure may reveal directions into which a fragment hit can be expanded or show regions with a less than optimal match between the functional moieties of the fragment and the surrounding amino acid residues.
The success of fragment screening, and that of the entire FBDD approach, is due to small regions of the binding site, called “hot spots”, contributing a large fraction of the binding free energy allowing these sites to be successfully targeted by fragment sized molecules. There is substantial evidence that information on such hot spots, which is of prime importance for drug design, can be obtained by screening small libraries of molecules the size of organic solvents, which are even smaller than the ones used for the identification of core fragments.16–18 As will be shown, the fragments that have relatively high LE, i.e., those that can be used as cores, also bind at these hot spots, but the same spots bind many other small compounds that vary in size, shape, and polarity, resulting in very high hit rates.16–18 Individual probe molecules can bind at a number of locations, but clusters of different probes occur only at hot spots. Although the origin of this weakly specific binding is not fully understood, the phenomenon itself has been well established. For example, using their SAR by NMR method across many different targets, Hajduk et al. observed that nearly 90% of fragments that bind to a protein cluster at sites that are known to also bind to drug-like molecules and that binding rarely occurs anywhere else15. Hajduk et al. screened large libraries of fragment sized compounds, but NMR was also used to show that organic solvents in aqueous solutions bind to hot spots with a hit rate that exceeds 90%.16 Similar conclusions have been drawn from the results of Multiple Solvent Crystal Structures (MSCS) experiments, which involve determining the X-ray structure of the target protein in aqueous solutions of six to eight organic solvents and superimposing the structures to find consensus clusters of the small compounds.17,18 Similar method has been used by Hubbard and co-workers.19,20 Results confirm that the hot spots of proteins are characterized by their ability to bind a variety of small molecules and that the number of different “probe” molecules observed to bind to a particular site predicts the potential importance of the site for ligand binding.21
The binding of small organic compounds is so robust that hot spots can be reliably determined by computational means.21,22 The FTMap solvent mapping algorithm places small molecular probes on a dense grid around the protein and finds favorable positions using empirical free energy functions.21 For each probe type, the probes are then clustered, and these clusters are ranked on the basis of their average free energy. Next, overlapping clusters of different probes, which will be referred to as consensus clusters, are identified. The consensus clusters within the binding site are ranked on the basis of the number of probe clusters they include, and the location of the consensus cluster with the largest number of probe clusters is defined as the main hot spot. As shown for a large variety of proteins, the main hot spots agree very well with hot spots found by fragment screening using X-ray or NMR techniques.21–26 Secondary hot spots that also contribute to ligand binding are identified as further high ranking consensus clusters. Similar to the SAR by NMR15 or MSCS17,18 methods, computational mapping provides more valuable information for drug design than just the knowledge of the binding site. For example, the consensus clusters obtained for renin trace out the shape of the first approved renin inhibitor, aliskiren, rather than that of peptidomimetic inhibitors that have been studied for several decades without providing any successful drug candidate.22 This is even the case when the mapping is performed on renin structures without any bound ligand or structures co-crystallized with peptidomimetic inhibitors.22
The goal of the present paper is to show that the knowledge of hot spots obtained by the computational mapping of ligand-free protein structures provides a rational basis for developing fragment hits into lead-like compounds. Our analysis focuses on a representative set of proteins selected by Congreve et al.9 in their excellent review of FBDD strategies. These proteins have structures determined with bound core fragments deposited in the Protein Data Bank (PDB). For each case, Congreve et al.9 describe the path leading from core fragments to larger, higher affinity compounds focusing on the changes of LE values in the process. As mentioned, the structures of the protein targets with bound core fragments facilitated the design. Nevertheless, the review clearly shows that the development of lead-like compounds is far from simple and generally involves the synthesis of molecules that have to be discarded due to their low LE. Thus, there is clear need for a more rational approach to this process.
We first demonstrate that the core fragments always overlap with the main hot spots identified by FTMap. Since the main hot spots are the most important sites for ligand binding, such agreement is expected, but the result still demonstrates the accuracy of predictions provided by the computational approach. The major contribution from the computation is the information it provides on the structure of secondary hot spots around the main hot spot. The location and importance (in terms of the number of bound probe clusters) of such secondary hot spots show whether the core fragment can be extended and, if so, which directions are best for extension. Further, we show that the relative importance of main and secondary hot spots provide insight into the expected LE of ligands constructed by extending the core fragment into specific secondary hot spots. This relationship will be quantified in terms of probe density, which describes the predicted binding propensity at each point of the binding site and can be used to predict the changes in LE when expanding the core moiety into secondary hot spots. We note that the same principles have been recently used for determining the druggability of binding sites on protein-protein interaction targets.26
RESULTS
The representative set selected by Congreve et al. contains 12 target proteins with bound core fragments.9 Out of these 12 proteins, 10 have wild-type, apo structures available in the Protein Data Bank (see Table 1); these systems will be the focus of this work. In one case, thrombin, Congreve et al. reviewed two core fragments at adjacent locations that were linked to construct a larger ligand.9 In this case we defined the fragment with higher LE as the core and treated the fragment with lower LE as an indication for ligand extension. Since we are interested not only in the location of the core but also the locations near the core where extension grants high affinity to the compound, we also extracted structures bound to high-affinity ligands from the PDB27–34 for cases when Congreve et al.9 did not provide such information. Six of the systems had available structures of ligands that were within the same chemical series as the core, i.e. the ligands mostly had the core atoms in the same configuration plus additional atoms. The remaining four ligands were chosen based on their high affinity and, if multiple high-affinity ligands were available, their similarity to the core and their extension to interactions with protein residues distinct from the ones in contact with core. The chemical structures of the ligands, the PDB codes of the ligand-bound structures, the three-character PDB designation of the ligands, and their LE values are summarized in Table 1.
Table 1.
Chemical structure, PDB code of the ligand-bound structure, and the three-character PDB designation and LE of all ligands considered
| Target | Core structure | PDB | LIG LE |
Extended structure | PDB | LIG LE |
|---|---|---|---|---|---|---|
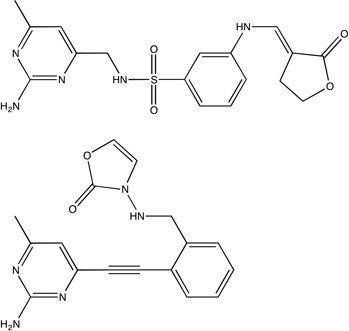
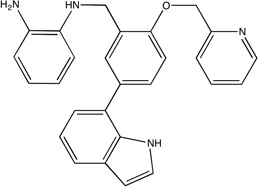
| DPPIV | 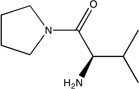 |
1n1m | a3m 0.66 |
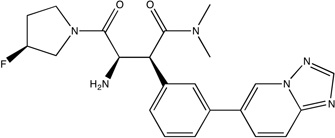 |
2fjp | s14 0.37 |
| Thrombin | 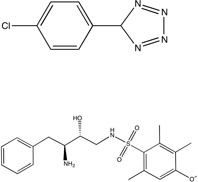 |
2c90 2c93 |
c1m 0.40 c4m 0.25 |
 |
2c8w | c7m 0.31 |
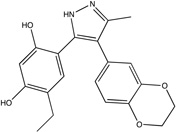
| HSP90 open |
 |
2jjc | lga N/A |
 |
2qg0 2qg2 |
a94 0.31 a91 0.29 |
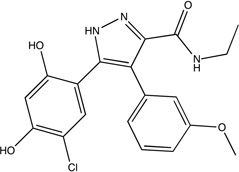
| HSP90 closed |
 |
2bt0 | ct5 0.35 |
 |
2bsm | bsm 0.39 |
| Urokinase | 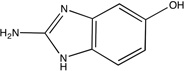 |
1fv9 | 172 0.46 |
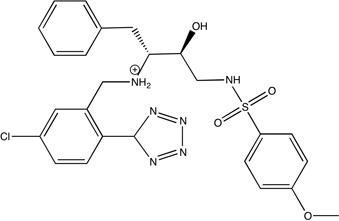
 |
1gjc | 130 0.45 |
| CDK2 | 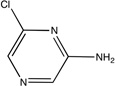 |
1wcc | cig 0.60 |
 |
1h1s 2g9x |
4sp 0.41 nu5 0.30 |
| TGT | 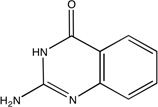 |
1s39 | aqo 0.65 |
 |
3ge7 3c2n |
afq 0.46 ckr 0.47 |
| MetAp2 | 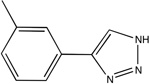 |
2adu | r20 0.89 |
 |
2oaz | i96 0.55 |
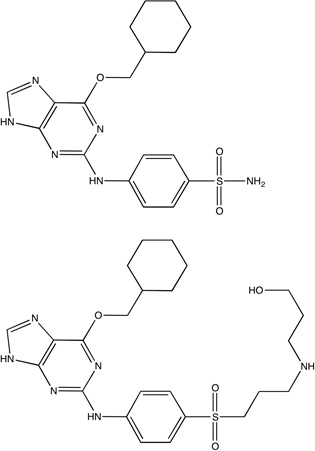
| BACE |  |
2ohm | 8ap 0.32 |
 |
2ohu | ip7 0.27 |
| nNOS | 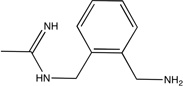 |
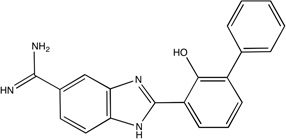
1qwc | 14w 0.55 |
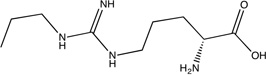 |
1qw6 | 3ar 0.67 |
| COX1 | 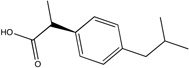 |
1eqg | ibp 0.51 |
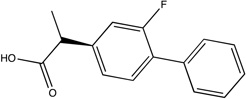 |
1eqh | fbp 0.59 |
Table 2 shows the rank and size, both based on the number of probe clusters, of the consensus clusters obtained by mapping the unbound structures of the 10 target proteins. In the table the core consensus cluster is defined as the consensus cluster overlapping with the core fragment, whereas the consensus clusters that overlap with the extended lead compound but not with the core are called extension consensus clusters. As shown, the top ranked consensus cluster is also the core consensus cluster for all but one target. Extension consensus clusters are found for eight of the ten targets. As will be shown, the remaining two targets, nNOS and COX-1, have main hot spots that expand over relatively large regions of the binding site, and hence the core fragments can be optimized within the main hot spot without any extension. Indeed, nNOS and COX-1 are the only targets for which the optimized ligand has higher LE than the core moiety.
Table 2.
Rank of Consensus Clusters and the Respective Numbers of Probe Clusters
| Figure | Protein | Core consensus cluster(s)a,b |
Core LEc |
Extension consensus cluster(s)a,d |
Lead LEc | Same seriese |
|---|---|---|---|---|---|---|
| 1A | DPPIV | 1(20) | 0.66f | 2(9), 3(4) | 0.37 | Y |
| 1B | Thrombin | 1(33) | 0.4 | 2(16), 4(5) | 0.31 | Y |
| 1C,1D | HSP90 | 1(45) | -g | 2(14) | 0.29, 0.31 | Y, Y |
| 2A | Urokinase | 1(29) | 0.46 | 2(26) | 0.45f | N |
| 2B | CDK2 | 1(20) | 0.60 | 4(5), 6(2) | 0.30 | N |
| 2C | TGT | 2(32) | 0.65f | 1(33), 3(11) | 0.45f, 0.47f | Y, Y |
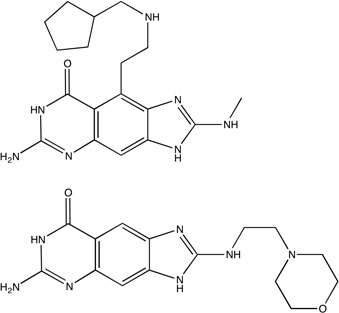
| 4A | MetAp2 | 1(18), 3(10) | 0.89 | 2(14) | 0.55f | N |
| 4B | BACE | 1(33), 2(16) | 0.32 | 3(7), 4(3) | 0.27 | Y |
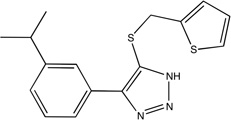
| 4C | nNOS | 1(21), 2(11), 3(11) | 0.55 | None | 0.67 | N |
| 4D | COX-1 | 1(9), 2(4), 3(4) | 0.51 | None | 0.59 | Y |
Rank of consensus cluster. The number of probe clusters contained is shown in parenthesis.
Consensus clusters overlapping with the core compound.
LE is an abbreviation for ligand efficiency determined from IC50 unless otherwise noted (see f).
Consensus clusters overlapping with the extended ligand but not with the core compound.
Same series indicates whether (Y) or not (N) the core fragment is “contained” as a part of the inhibitor.
The LE for this molecule is based on Ki rather than IC50.
The binding affinity is below experimental sensitivity.
Dipeptidyl Peptidase IV (DPPIV)
DPPIV has a 4.3 nM inhibitor that was discovered by FBDD35. We mapped the unbound DPPIV structure, PDB code 1j2e.36 As shown in Figure 1A, the core fragment37 has large LE and coincides with the top ranked consensus cluster, and the optimized inhibitor was found to extend into consensus clusters ranked 2 and 3. While the optimized inhibitor has nanomolar affinity, it has reduced ligand efficiency (0.37 vs. the core’s 0.65, see Table 1) in agreement with our prediction that the region where the core binds is the main hot spot, which has the highest binding propensity. The secondary hot spots, defined by consensus clusters 2 and 3, contribute to the binding free energy but have weaker interactions with ligands than the main hot spot. Nevertheless, as shown in Fig. 1A, the inhibitor matches the three top ranked consensus clusters very well, and this is likely to contribute to the respectable LE value and the high affinity (IC50 = 4.3 nM).
Figure 1.

Significant consensus clusters in the binding site, predicted by computational mapping, for unbound (A) DPPIV (1j2e), (B) thrombin (1ths), (C) HSP90 open conformation (1yes), and (D) HSP90 closed conformation (1yer), represented as lines with ligands represented as sticks from aligned bound structures. Affinity measures, ligand efficiency (LE), and the PDB code of the bound structure are listed for each ligand. Fragments identified as cores by Congreve et al.9 have carbons colored brown, the HSP90 ligand identified by HTS is colored green, and higher affinity ligands from the same chemical series have carbons colored wheat or pink. Consensus cluster carbons are colored by rank as follows: 1st - cyan, 2nd - purple, 3rd - yellow, and 4th - salmon.
Thrombin
Thrombin has a 4 nM inhibitor created by linking two fragments identified by X-ray crystallography to reside in neighboring pockets.38 We mapped a structure of thrombin that had nothing bound at the active site, PDB code 1ths.39 While this structure has a synthetic, peptidic inhibitor MDL-28050 bound at the exosite, the exosite is remote from the active site making this structure the closest approximation to an apo structure available for analysis. As can be seen in Figure 1B, the fragment with higher LE (0.4) was found to coincide with the top ranked consensus cluster while the fragment with slightly lower LE (0.25) was found to span multiple, lower ranked consensus clusters. The fragments were linked and the resulting inhibitor was optimized resulting in a LE (0.31) that was intermediate between the LEs of the two fragments (Table 1). It may be noteworthy that the main difference between the two fragments and the linked inhibitor is the removal of the three methyl groups from the benzyl ring that overlaps our second consensus cluster, resulting in a better overlap with the aromatic probes in the second ranked consensus cluster. As will be discussed, linking a second core to the one with the high LE value is less optimal than expanding the high affinity fragment, most likely because the approach requires a flexible linker, and thus the resulting compound loses too much entropy upon binding.
Heat Shock Protein 90 (HSP90)
Unbound HSP90 has two conformations, referred to as “open and closed”.40 The core and inhibitors40 discussed by Congreve et al.9 were developed to bind only to the open conformation with the hope that this would provide a more potent inhibitor;40 however, higher affinity compounds have recently been developed that bind to the closed conformation.41 Thus, we mapped the crystal structures of both an unbound open and closed HSP90, PDB codes 1yes and 1yer,42 respectively, and we compared the results of each drug development strategy to the mapping results of its respective conformation. Huth et al. developed a linking strategy for drug design by identifying two neighboring hot spots in an iterative manner that were then used for fragment linking.40 The first hot spot in the open conformation corresponds to the core shown in Figure 1C; while the core’s affinity is below experimental sensitivity, it resides within our top consensus cluster. Two additional fragments were identified in the presence of a similar core molecule, and these fragments were linked to form the compounds seen in Table 1 and Figure 1C.40 These inhibitors overlap only in two locations, i.e., the shared core, which resides in our top ranked consensus cluster, and the region we identified as the second ranked consensus cluster. Furthermore, we emphasize that the order in which Huth et al.40 found the two hot spots corresponds to the ranking of our consensus clusters. The inhibitors are only micromolar binders, again suggesting that linking fragments is less optimal than expanding the high affinity core. In fact, Figure 1C clearly shows that the lead does not use the hot spots adjacent to the core fragment.
After the publication of the work of Congreve et al.,9 a number of high-affinity compounds for the closed conformation of HSP90 were published. Using HTS, researchers at Vernalis43 identified a lead with IC50 = 280 nM and LE = 0.35 that was subsequently optimized with SBDD techniques to a compound with IC50 = 25 nM and LE = 0.39 (Table 1).41 This compound was then further evolved into a drug, which is currently in phase II clinical trials, with a slight improvement in affinity, IC50 = 21 nM, and a moderate decrement in LE (0.31)42. Our top three consensus clusters correspond to the HTS lead (see Figure 1D). Since the conformation of the protein did not influence the location of the two top ranked consensus clusters, we compared the HTS lead with the fragment core and noticed that the sub-micromolar lead has more atoms within the top ranked consensus cluster than the fragment or either of the micromolar, open structure compounds. Additionally, as shown in Figure 1D, the optimized lead bound to the closed structure better coincides with our second and third ranked consensus clusters. These observations show that FTMap may also provide insight into the conformation of the protein that is best-suited target for SBDD, since structures with more closely packed hot spots helped to find ligands with higher affinity.
Urokinase plasminogen activator (urokinase)
Abbott Laboratories used fragment evolution to develop a selective urokinase inhibitor with Ki = 8 nM.44 While this inhibitor is from a different chemical series than the core fragment (Table 1)30, both the core identified by Congreve et al.9 and the 2-naphthamidine core of the inhibitor are found in similar locations and orientations in their respective crystal structures. Mapping of the unbound urokinase structure,45 PDB code 2o8t, found that both cores coincide with our top ranked consensus cluster. As shown in Figure 2A, Abbott’s inhibitor extends into the second ranked consensus cluster. While the inhibitor is a more potent binder, the different measurement techniques, IC50 vs Ki, for the two ligands prevents direct comparison of their LEs.
Figure 2.

Significant consensus clusters in the binding site, predicted by computational mapping, for unbound (A) urokinase (2o8t), (B) CDK2 (1hcl), and (C) TGT (1pud), represented as lines with ligands represented as sticks from aligned bound structures. Affinity measures, ligand efficiency (LE), and the PDB code of the bound structure are listed for each ligand. Fragments identified as cores by Congreve et al.9 have carbons colored brown, and higher affinity ligands have carbons colored wheat where electron density supports the position of the atoms and dark grey where the atoms are a representative of a number of possible conformational states. Consensus cluster carbons are colored by rank as follows: 1st - cyan, 2nd - purple, 3rd - yellow, 4th – salmon, and 6th - pale green. TGT’s core fragment is the only example of a core fragment that does not overlap the top ranked consensus clusters due to a substantial change in the conformation of Tyr106.
Cyclin dependent kinase 2 (CDK2)
Since none of the numerous inhibitors of CDK2 are in the same chemical series as the core fragment identified by Hartshorn et al.46, we decided to study an inhibitor that extended in multiple directions from the core site for comparison to our computational mapping results. One such series, based on the ATP mimetic O6-cyclohexylmethylguanine, extended in two directions from the core site (Table 1). Interestingly, this lead was optimized to an inhibitor with IC50 of 6 nM and LE of 0.41,47 but further SBDD extension resulted in an inhibitor with only an IC50 of 45 nM and a LE of 0.3.29 Mapping of an unbound structure of CDK2, PDB code 1hcl,48 resulted in our top ranked consensus cluster coinciding with the core fragment and the purine moiety of the inhibitor (see Figure 2B). In addition to the top ranked consensus cluster, both inhibitors have a cyclohexyl group that coincides with our fourth ranked consensus cluster. Additionally, the weaker extended inhibitor with IC50 = 45 nM has a N-3-hydroxypropyl group that coincides with our sixth ranked consensus cluster, which includes only 2 probe clusters. This N-3-hydroxypropyl group is the only moiety in our study that coincides with a consensus cluster with rank beyond 4, and in view of the weak hot spot we expect only minor improvement in affinity when adding a moiety in this region. In good agreement with this prediction, the authors that published this structure concluded that the additional interactions of the N-3-hydroxypropyl group were insufficient to compensate for the loss of interactions within the regions identified by our top and fourth ranked consensus clusters,29 leading to lower affinity.
tRNA Guanine Transglycosylase (TGT)
We mapped the highest resolution, wild-type TGT structure, PDB code 1pud.49 As shown in Table 2, the core fragment50 overlaps with our second ranked consensus cluster. This is noteworthy because for all other targets considered here the core fragments overlap with the top ranked consensus clusters. Comparison of the apo and holo structures of TGT reveals that there would be a clash between the unbound conformation of the Tyr106 side chain and the bound core molecule in the holo structure, indicating that Tyr106 closes down the ligand binding pocket and prevents effective sampling of this region. Tyr106 adopts a different conformation upon core binding, which resolves the clashes. Mapping identifies the region of core fragment binding as the second ranked, rather than first ranked, consensus cluster. As we have recently demonstrated,26 it is possible to generate alternative conformers for the side chains around the consensus clusters found by an initial mapping, map the resulting structures, and select the one with the highest number of probe clusters, thus opening up pockets that may be partially closed in the ligand-free protein structure.26 However, the side chain adjustment algorithm is not yet implemented in the FTMap server, and hence is not used in the present paper.
Two inhibitors with nanomolar affinity from the same chemical series as the core fragment have been recently developed for TGT via fragment evolution.32,33 As shown in Figure 2C, the best binding inhibitor from the first series extends from the second ranked consensus cluster into the top ranked consensus cluster. While the electron density of the best inhibitor from the second series was unable to resolve the position of a terminal six-member moiety that was critical for achieving nanomolar affinity,33 chemical constraints reduce the number of potential conformations for the moiety. In Figure 2C, we show one such conformation coinciding with a portion of our third ranked consensus cluster. Thus, mapping results identify both directions that confer high affinity to the ligand when expanding the core fragment.
Methionine aminopeptidase 2 (MetAp2)
The core fragment for MetAp2 had the highest LE (0.89) of any compound within this data set and already has IC50 of 18 nM, partially due to this ligand’s interaction with two coordinated cobalt atoms;51 however, there have been no other published inhibitors in this series. Nonetheless, a larger compound containing a triazole group was found via HTS and SBDD by researchers at the same company (Table 1)31, and we treated this inhibitor with a Ki of 2 nM as the high-affinity analogue. We mapped the unbound structure, PDB code 1bn552, with the metal ions removed, and found that the core molecule had its aryl-triazole group coinciding with the top ranked consensus cluster and its benzyl group corresponding to the third ranked consensus cluster (see Figure 3A). In addition to making similar interactions in the regions identified by our top and third consensus clusters, the high-affinity inhibitor also has a propyl group that coincides with our second ranked consensus cluster. While the inhibitor is a more potent binder, the different measurement techniques, IC50 vs Ki, for the two ligands prevents direct comparison of their LEs.
Figure 3.

Significant consensus clusters in the binding site, predicted by computational mapping, for unbound (A) MetAp2 (1bn5), (B) BACE (1w50), (C) nNOS (1zvi), and (D) COX-1 (1prh), represented as lines with ligands represented as sticks from aligned bound structures. Affinity measures, ligand efficiency (LE), and the PDB code of the bound structure are listed for each ligand. Fragments identified as cores by Congreve et al. have carbons colored brown, and higher affinity ligands have carbons colored wheat. Consensus cluster carbons are colored by rank as follows: 1st - cyan, 2nd - purple, and 3rd - yellow. All four core molecules overlap to some extent with the top consensus cluster, and BACE, COX-1, and nNOS have more inhibitor atoms placed within the core consensus clusters than the cores themselves. This is especially noteworthy since COX-1 and nNOS were the only two systems that had an inhibitor with higher LE than the LE of the core moiety and were also the only two systems that lacked extension clusters, and hence the core has been evolved into lead compounds within the main consensus cluster.
β-Secretase (BACE)
Astex Pharmaceuticals used a fragment evolution approach to obtain a 690 nM inhibitor of BACE (Table 1).27 We mapped an unbound BACE structure, PDB code 1w50.53. As shown in Table 2 and Figure 3B, the core molecule27 overlapped the two top ranked consensus clusters. The inhibitor was optimized via SBDD techniques, leading to two observations on the relationship between the optimized inhibitor and the consensus clusters. First, extension of the core more fully into the top ranked consensus cluster pushes the core portion of the inhibitor into the third ranked consensus cluster. As a result, this inhibitor has more atoms within the regions defined by the core consensus clusters, in addition to its extension into the third ranked consensus cluster. Second, the inhibitor extends further out of the core consensus clusters into the next (fourth) ranked consensus cluster nearby, which corresponds to a region identified by Astex Pharmaceuticals as important for SBDD.53 These observations are consistent with our earlier findings and support the indication from the HSP90 results that local optimization by placing chemically appropriate atoms into the various regions of hot spots, particularly of the main hot spot, may yield an increase in affinity.
Neuronal nitric oxide synthase (nNOS)
This protein is one of the two targets for which the core had lower LE than an optimized compound (Table 1). We mapped the unbound nNOS structure, PDB code 1zvi54, in the presence of both the heme and 5,6,7,8-tetrahydrobiopterin cofactors. As shown in Figure 3C, the core,28 which has a LE of 0.55, primarily overlaps with our second ranked consensus cluster, partially occupies the region identified by our top ranked consensus cluster, and narrowly coincides with our third ranked consensus cluster. The more efficient (LE = 0.67) related molecule from the same study28 not only coincides more fully with our top ranked consensus cluster, but it also extends along the entire region identified by our second ranked consensus cluster (see Figure 3C). This reinforces the observation that local optimization by placing chemically appropriate atoms into the regions identified by the core consensus clusters may result in increased affinity. Furthermore, these results suggest that doing this without extending outside of the top ranked consensus clusters may even increase the LE.
Cyclooxygenase-1 (COX-1)
COX-1 is the other system where the LE increased for the inhibitor,34 flurbiprofen, over the core, ibuprofen (Table 1).34 We mapped the unbound COX-1 structure, PDB code 1prh,55 and as shown in Figure 3D, both ibuprofen and flurbiprofen coincide with the top three consensus clusters. However, flurbiprofen has a second benzyl group, in lieu of ibuprofen’s propyl group, which better coincides with the top ranked and third ranked consensus clusters. Furthermore, the orientation of the primary benzyl group in flurbiprofen is different than the orientation seen in ibuprofen, possibly due to steric interactions of the propyl group, thus allowing flurbiprofen’s primary benzyl group to better coincide with the second ranked consensus cluster. In addition to the better correspondence between the flurbiprofen and our consensus clusters, flurbiprofen has a fluorine atom that extends from its primary benzyl group into the region identified by the two top ranked consensus clusters. Therefore, it may come as no surprise that flurbiprofen has a LE of 0.59 versus ibuprofen’s LE of 0.51. This is consistent with the observation made for nNOS that, in addition to extending a core fragment into further consensus sites, in some cases LE can also be increased by optimizing the placement of functional groups within the core consensus cluster without extension.
Relationship between LE and probe density
Comparing the number of probes in a consensus cluster with the results of extending a core moiety into the corresponding hot spot suggests that there is a relationship between the extent to which a ligand coincides with the consensus cluster and the expected LE of the extended lead molecule. Some of the values in Table 2 show this relationship. For example, the core and extension consensus clusters include similar numbers of probe clusters (29 versus 26) for urokinase, and the LE value remains almost unchanged when the core is extended. In contrast, the core consensus cluster of CDK2 has 20 probe clusters, whereas the region of extension includes only two minor consensus clusters ranked 4 and 6, with a total of 7 probe clusters. In agreement with this major drop in binding propensity, the 0.6 LE of the core is reduced to 0.3 when the core fragment is extended.
For a more rigorous analysis of the relationship between mapping results and LE values, we introduce the concept of probe density, defined at each point as the total number of probe atoms within a 1.25 Å radius. Given the structure of any bound ligand, we can calculate a measure called probe density correlation, or simply density correlation (DC) by summing the probe density for all heavy atoms of the ligand. Since probes tend to cluster at hot spots that are important for binding, the probe density relates to binding propensity, and the DC value measures the expected affinity of the ligand at a particular location. Similarly to LE, we normalize DC into density correlation efficiency, defined by DCE = DC / HA, where HA is the number of heavy atoms of the ligand. Since we are interested in changes upon extending the core moiety into a secondary hot spot, we expressed both LE and DCE as ratios between the core fragment and the lead evolved from the core. Figure 4 shows the relationship between the LE ratio, (LE)core/(LE)lead, and the density correlation efficiency ratio (DCE)core/(DCE)lead. Since LE determined from IC50 and LE determined from Ki are fundamentally different, we restricted our analysis to ligands that had IC50 information because more systems had the potency of both the core and inhibitor reported as IC50. With this constraint, we have two data points for both thrombin and CDK2, and one data point for each of BACE, nNOS, and COX-1. Six of the seven points are on a straight line, suggesting a linear relationship between (LE)core/(LE)lead and (DCE)core/(DCE)lead. Since the number of points is very small, the statistical validity of the relationship is limited, in spite of the overall R2 value of 0.66. Nevertheless, as we described, we expect that such relationship between densities and achievable LE values should exist, although it is possibly not as tight as shown here. The one outlier in Figure 5 represents the extension of the high LE thrombin core fragment, which was linked to a lower LE fragment rather than expanding into the neighboring regions. The data point is above the line, indicating that linking the two core fragments yields a lower LE value of the resulting lead molecule than expected on the basis of the correlation density, most likely due to the flexibility of the lead, which implies substantial entropy loss upon binding. We note that establishing a relationship between (LE)core/(LE)lead and (DCE)core/(DCE)lead values is potentially very useful, since it will predict the maximum achievable LE value when a core fragment is expanded into particular regions of the binding site. Unfortunately there are few systems similar to the ones described here, i.e., with both affinities and structures available for the protein/fragment and protein/lead complexes.
Figure 4.

Relationship between the normalized ligand efficiency (LE)core/(LE)ligand and the normalized density correlation efficiency (DCE)core/(DCE)ligand. The ldensity correlation efficiency is defined by DCE = DC/HA, where HA is the number of heavy atoms in the ligand. The density correlation, DC, is the integral of probe density over the volume of the ligand in a given conformation. Data points are shown only for compounds with LE values based on IC50. The correlation coefficient of R2 = 0.66 between the two ratios suggests a linear relationship.
DISCUSSION
We consider two fragment-based methods and show that they provide highly complementary information. The first, experimental screening of compounds in the size range of 150 to 250 Da, is becoming the well-established first step in fragment-based drug design.1,3–6,9 There are many examples of fragment sized compounds identified by this method that have low affinity but high LE, which can be then used as the core moiety for developing higher affinity leads.1–12 In principle, computational methods can also provide similar information, and successful virtual screening of fragment libraries has been reported.56–58 However, it was also shown that performance of fragment docking substantially varies from target to target and is dependent on the LE of the compounds being docked.58 Although we anticipate that further development of docking methods will provide improvements, it is unlikely that computational approaches will, in the near future, be able to reliably identify high LE compounds that can be used as cores, thus replacing X-ray and NMR as the primary tool for fragment screening.
The protein mapping method we employ in this paper does not attempt to compete with the X-ray or NMR based screening used for the identification of core fragments. In contrast, FTMap21 has been developed as a computational analog of experimental methods that study the binding of much smaller compounds, the size of organic solvents. The binding of such very small compounds can be detected by NMR16 or X-ray crystallography,17–20 but the expected results differ from those of screening: the goal is identifying binding hot spots, detected by the clustering of ligands, rather than looking for specific fragments that bind with high LE. It is important that, in contrast to docking results that have high level of uncertainty, the location of consensus clusters and their ranking, which is based on the number of probe clusters, are generally very robust and thus can reliably be determined by computational methods. There are at least four reasons for this robustness: first, docking of the small rigid compounds is relatively easy; second, we can sample the conformational space on a very dense grid, thus under-sampling does not occur; third, we are interested in sizable clusters, rather than individual docked poses, thereby eliminating a number of false positives; and fourth, it is not a problem if some of the probe compounds are not found in the hot spots or are found somewhere else, because we are interested only in consensus clusters formed by a large number of probe clusters. Accordingly, we have established that the computational mapping results agree well with available experimental mapping data, and that the location of hot spot shows little sensitivity to conformational changes.21–26 Due to the above factors, the problem of locating clusters of very small ligands on a protein seems to be ideally suited for a computational approach. In contrast, finding similar information by MSCS, i.e., by soaking protein crystals in aqueous solutions of organics solvents and superimposing the X-ray structures, is far from simple17–20. The problems include the limited solubility of some molecules used as probes, the possibility that the organic solvent may crack the crystal and hence it should be cross-linked prior to the experiments, and crystal contact that may also affect ligand binding.17–20
The main result of this paper is that the hot spots obtained by computational mapping identify the regions that are most likely to substantially contribute to the binding free energy and hence are the most important regions for FBDD. As shown in Table 2, the top ranked consensus cluster, predicting the main hot spot, coincided with the core fragment in 9 of the 10 proteins studied9; in the remaining case, the unbound conformation had a tyrosine that sterically hindered probes from adequately sampling in the location where the core binds. While the binding site of the core fragment locates the main hot spot, only computational mapping is capable of identifying secondary hot spots that are also important for ligand binding, and thus provide a full characterization of the hot spot structure in the binding site.
Our main observation is that information on the secondary hot spots provides a rational basis for expanding the core fragments into higher affinity lead candidates. For eight targets, the high-affinity ligand extended beyond the main hot spot into other hot spots, in most cases identified by the second, third, and possibly fourth ranked consensus clusters. Of special note were two cases where we examined multiple ligands. In one case, HSP90, the micromolar inhibitors extended in different directions and only overlapped in two locations which corresponded to our first and second ranked consensus clusters; however, a different conformation of HSP90 was used to obtain a nanomolar inhibitor which places more atoms within the region identified by our first ranked consensus clusters. In the other case, TGT, the nanomolar inhibitors overlapped at the core, identified by the second ranked consensus cluster, but extended in different directions into separate consensus clusters, ranked first and third, respectively. So while there may be different scaffolds that can bind to a protein, it is important to have portions of these scaffolds interact with the regions identified by our top ranked consensus clusters.
As shown by the case studies considered here, the secondary hot spots identified by the computational mapping reveal whether the core fragment can be expanded and, if so, into which directions. Results also show that if two hot spots are not adjacent, and hence ligands must bridge them, this will require a scaffold that has no strong interaction with the protein, resulting in lower LE. Thus, it should not be surprising that extension of the core from the top consensus cluster into secondary consensus clusters was consistently associated with a higher-affinity binder with reduced ligand efficiency. This phenomenon was especially significant when the ligand efficiency of the core was much higher than 0.29, which corresponds to the LE cutoff suggested by Hopkins et al. to be necessary for a drug-like molecule to have nanomolar binding affinity.14 Reynolds et al. made a similar observation while studying the relationship between optimal ligand efficiency and the number of heavy atoms.59,60. These researchers concluded that there was a dramatic decrease in the maximum ligand efficiency between 10 and 25 heavy atoms, and that after 25 heavy atoms, the ligand efficiency essentially plateaued.59 The authors suggested that there were three factors that lead to this decrease in ligand efficiency with an increase in size: (1) structural compromises of larger molecules that prohibit a functional group from maximally interacting with the protein, (2) entropic concerns, and (3) a decrease in van der Waals surface area per heavy atom as a molecule becomes larger and more complex.60 Our results suggest a fourth reason; molecules that occupy more than a single hot spot generally have connecting atoms with weaker interactions, resulting in a decrease in maximal LE as ligands expand out of hot spots and into regions where such atoms are necessary. In the two cases where the lead compound coincided with the same or fewer consensus clusters than the core, the lead had more atoms in direct contact with the consensus clusters than the core, resulting in higher LE. This suggests that our consensus clusters also provide information on locations where chemical optimization is most beneficial for drug design; i.e., that the best way to maintain the high LE of an initial hit is placing chemically more appropriate atoms into regions with the highest probe density within the main hot spot.
CONCLUSIONS
X-ray crystallography and NMR have been used with remarkable success for the identification of small weakly binding fragments that are highly ligand efficient and can serve as core moieties for finding high affinity lead compounds. Although the fragment-bound structure of the target protein facilitates the construction of leads, effective design is far from straightforward. Protein mapping, a computational tool available as the FTMap server (http://ftmap.bu.edu/), provides hot spot information that can drive the evolution of core fragments into larger leads with a minimal loss or, in some cases, even a gain of LE. As shown, the strongest consensus site found by FTMap generally binds the core fragment, and the neighboring secondary consensus sites indicate the regions where the core can be extended to increase its affinity. We observed that the relative size of top and secondary consensus clusters is a good predictor of the change in LE upon extension. This relationship has been tested only for a limited number of targets due to limitations of available data, but it seems to be fairly robust. We note that in some cases the core molecule coincides only with a portion of the main hot spot, and thus the core molecule may be extended and/or optimized within the main hot spot, potentially retaining the high LE of the core.
METHODOLOGY
Test Set
Congreve et al. published a representative set of 12 proteins that have been analyzed using FBDD techniques.9 Ten of these systems (see Table 1) had both apo36,38,41,45,48,49,52–54 and core-bound9,27,28,34,35,37,46,50,51 structures in the Protein Data Bank (PDB) and were thus used in this analysis. Congreve et al.9 also identified high-affinity inhibitors from the same series as the core moiety for DPPIV,35 thrombin,47 and BACE,27 with protein-bound structures available. We extracted inhibitors for the remaining systems from the PDB (Table 1). While for HSP90 Congreve et al. selected two micromolar inhibitors,39 we examined an additional series40,42,43 with sub-mircomolar affinity. TGT32,33 and COX-134 were found to have sub-micromolar inhibitors in the same series as the core. Inhibitors for MetAp231 and nNOS28 were chosen using the criteria of increased affinity for the inhibitor and similarity of a portion of the inhibitor to the core. Multiple inhibitors for urokinase and CDK2 were found using these criteria, and we selected inhibitors29,47 that extended into distinct region(s) from the core to further provide insight into secondary hot spots.
Computational Mapping
Mapping was completed using the apo form of the proteins submitted to the FTMap server, http://ftmap.bu.edu.21 (The FTMap site was accessed between June and October of 2011, and will be maintained to remain functional in the future.) For nNOS, both the heme and the cofactor were modeled with the apo structure during mapping; all other ligands were removed for all other systems. The FTMap algorithm21 uses 16 small molecules as probes (ethanol, isopropanol, isobutanol, acetone, acetaldehyde, dimethyl ether, cyclohexane, ethane, acetonitrile, urea, methylamine, phenol, benzaldehyde, benzene, acetamide, and N,N dimethylformamide) and consists of four steps as follows.
-
Step 1
The rotational/translational space of each probe is systematically sampled on a grid around the fixed protein, consisting of 0.8 Å translations and of 500 rotations at each location. The energy function includes a stepwise approximation of the Van der Waals energy with attractive and repulsive contributions, and an electrostatics/solvation term based on the Poisson-Boltzmann continuum model with dielectric constants of ε=4 and ε=80 for the protein and the solvent respectively61. The energy expression is written as the sum of correlations functions, and hence it can be very efficiently evaluated using fast Fourier transforms.21 The 2000 best poses for each probe are retained for further processing.
-
Step 2
The 2000 complexes are refined by off-grid energy minimization during which the protein atoms are held fixed while the atoms of the probe molecules are free to move. The energy function includes the bonded and van der Waals terms of the CHARMM potential62 and an electrostatics/solvation term based on the Analytic Continuum Electrostatic (ACE) model63 as implemented in CHARMM.
-
Step 3
The minimized probe conformations are grouped into clusters using a simple greedy algorithm. The lowest energy structure is selected and the structures within 4 Å RMSD are joined in the first cluster. The members of this cluster are removed, and the next lowest energy structure is selected to start the second cluster. This step is repeated until the entire set is exhausted. Clusters with less than 10 members are excluded from consideration. The retained clusters are ranked on the basis of their Boltzman averaged energies. Six clusters with the lowest average free energies are retained for each probe.
-
Step 4
In order to identify consensus clusters where a number of probe clusters overlap19 the probe clusters are themselves clustered using 4 Å distance between cluster centers as the clustering radius. The consensus clusters are ranked on the basis of the number of probe clusters contained.21 To determine if any of the consensus clusters includes the core moiety from the fragment screening, the core-bound protein is superimposed on the unbound protein results using PyMol to obtain appropriate positioning and orientation of the core fragment. If a consensus cluster has 5 or more atoms within 1.25 Å of the core, it is considered to coincide with the core moiety, and is identified as “core consensus cluster” in Table 2. Similarly, if a (non-core) consensus cluster has 5 or more atoms within 1.25 Å of any atom of an extended ligand, which is not part of the core, it is defined as “extension consensus cluster”.
Identification of Binding Site
Prior to analyzing the hot spots we may use the mapping results to identify the binding site (if it is not a priori known) as implemented in our FTSite server at http://ftsite.bu.edu. The server was accessed between June and October of 2011, and will be maintained to remain functional in the future. The method calculates percentage contact score for each consensus cluster. The distance between the centers of geometry for each consensus cluster and the consensus cluster with highest percentage contact was calculated, and consensus clusters having this distance less than 12 Å were collected. The residues interacting with the probes in these consensus clusters were considered to form the binding site.
Calculation of LE
LE was determined as LE = 0.6 pKi/HA or LE = 0.6 pIC50/HA, where HA is the number of heavy atoms in the ligand and pX = − 1 ln(X). While no distinction between LE determined by Ki or IC50 is made, our analysis did not compare LEs calculated by these related, yet distinct, experimental constants. Since mapping results are not directly comparable between proteins, LEs were normalized dividing the core’s LE by the LE of the extended lead compound, i.e., we have introduced the measure (LE)core/(LE)llead.
Probe density, density correlation, and density correlation efficiency
Probe density is defined at each point as the total number of probe atoms within a 1.25 Å radius. Given a bound ligand, ligand-density correlation, or simply density correlation (DC), is obtained by summing the probe density for all heavy atoms of the ligand. Density correlation efficiency (DCE) is defined by DCE = DC / HA, where HA is the number of heavy atoms of the ligand. In Fig. 4 we use the normalized density correlation efficiency (DCE)core/(DCE)lead.
ACKNOWLEDGMENTS
This investigation was supported by grant GM064700 from the National Institute of General Medical Sciences.
REFERENCES
- 1.Erlanson DA, McDowell RS, O’Brien T. Fragment-based drug discovery. J. Med. Chem. 2004;47:3463–3482. doi: 10.1021/jm040031v. [DOI] [PubMed] [Google Scholar]
- 2.Rees DC, Congreve M, Murray CW, Carr R. Fragment-based lead discovery. Nat. Rev. Drug Disc. 2004;3:660–672. doi: 10.1038/nrd1467. [DOI] [PubMed] [Google Scholar]
- 3.Murray CW, Blundell TL. Structural biology in fragment-based drug design. Curr. Opin. Struct. Biol. 2010;20:497–507. doi: 10.1016/j.sbi.2010.04.003. [DOI] [PubMed] [Google Scholar]
- 4.Hubbard RE, Murray JB. Experiences in fragment-based lead discovery. Methods Enzymol. 2011;493:509–531. doi: 10.1016/B978-0-12-381274-2.00020-0. [DOI] [PubMed] [Google Scholar]
- 5.Coyne AG, Scott DE, Abell C. Drugging challenging targets using fragment-based approaches. Curr. Opin. Chem. Biol. 2010;14:299–307. doi: 10.1016/j.cbpa.2010.02.010. [DOI] [PubMed] [Google Scholar]
- 6.Joseph-McCarthy D. Challenges of fragment screening. J. Comput. Aided Mol. Des. 2009;23:449–451. doi: 10.1007/s10822-009-9293-0. [DOI] [PubMed] [Google Scholar]
- 7.Foloppe N. The benefits of constructing leads from fragment hits. Future Med. Chem. 2011;3:1111–1115. doi: 10.4155/fmc.11.46. [DOI] [PubMed] [Google Scholar]
- 8.Loving K, Alberts I, Sherman W. Computational approaches for fragment-based and de novo design. Curr. Topics in Med. Chem. 2010;10:14–32. doi: 10.2174/156802610790232305. [DOI] [PubMed] [Google Scholar]
- 9.Congreve M, Chessari G, Tisi D, Woodhead AJ. Recent developments in fragment-based drug discovery. J. Med. Chem. 2008;51:3661–3680. doi: 10.1021/jm8000373. [DOI] [PubMed] [Google Scholar]
- 10.Hajduk PJ, Greer J. A decade of fragment-based drug design: strategic advances and lessons learned. Nat. Rev. Drug Discov. 2007;6:211–219. doi: 10.1038/nrd2220. [DOI] [PubMed] [Google Scholar]
- 11.Murray CW, Rees DC. The rise of fragment-based drug discovery. Nat. Chem. 2009;1:187–192. doi: 10.1038/nchem.217. [DOI] [PubMed] [Google Scholar]
- 12.Wells J, McClendon CL. Reaching for high-hanging fruit in drug discovery at protein-protein interfaces. Nature. 2007;450:1001–1009. doi: 10.1038/nature06526. [DOI] [PubMed] [Google Scholar]
- 13.Kuntz ID, Chen K, Sharp KA, Kollman PA. The maximal affinity of ligands. Proc. Nat. Acad. Sci. 1999;96:9997–10002. doi: 10.1073/pnas.96.18.9997. [DOI] [PMC free article] [PubMed] [Google Scholar]
- 14.Hopkins AL, Groom CR, Alex A. Ligand efficiency: a useful metric for lead selection. Drug Discov. Today. 2004;9:430–431. doi: 10.1016/S1359-6446(04)03069-7. [DOI] [PubMed] [Google Scholar]
- 15.Hajduk PJ, Huth JR, Fesik SW. Druggability indices for protein targets derived from NMR-based screening data. J. Med. Chem. 2005;48:2518–2525. doi: 10.1021/jm049131r. [DOI] [PubMed] [Google Scholar]
- 16.Liepinsh E, Otting G. Organic solvents identify specific ligand binding sites on protein surfaces. Nat. Biotechnol. 1997;15:264–268. doi: 10.1038/nbt0397-264. [DOI] [PubMed] [Google Scholar]
- 17.Allen KN, Bellamacina CR, Ding X, Jeffery CJ, Mattos C, Petsko GA, Ringe D. An Experimental approach to mapping binding surfaces of crystalline proteins. J. Phys. Chem. 1996;100:2605–2611. [Google Scholar]
- 18.Mattos C, Ringe D. Locating and characterizing binding sites on proteins. Nat. Biotechnol. 1996;14:595–599. doi: 10.1038/nbt0596-595. [DOI] [PubMed] [Google Scholar]
- 19.English AC, Done SH, Caves LS, Groom CR, Hubbard RE. Locating interaction sites on proteins: the crystal structure of thermolysin soaked in 2% to 100% isopropanol. Proteins. 1999;37:628–640. [PubMed] [Google Scholar]
- 20.English AC, Groom CR, Hubbard RE. Experimental and computational mapping of the binding surface of a crystalline protein. Protein Eng. 2001;14:47–59. doi: 10.1093/protein/14.1.47. [DOI] [PubMed] [Google Scholar]
- 21.Brenke R, Kozakov D, Chuang G, Beglov D, Hall D, Landon MR, Mattos C, Vajda S. Fragment-based identification of druggable “hot spots” of proteins using Fourier domain correlation techniques. Bioinformatics. 2009;25:621–627. doi: 10.1093/bioinformatics/btp036. [DOI] [PMC free article] [PubMed] [Google Scholar]
- 22.Landon MR, Lancia DR, Yu J, Thiel SC, Vajda S. Identification of hot spots within druggable binding regions by computation solvent mapping proteins. J. Med. Chem. 2007;50:1231–1240. doi: 10.1021/jm061134b. [DOI] [PubMed] [Google Scholar]
- 23.Chuang G, Kozakov D, Brenke R, Beglov D, Guarnieri F, Vajda S. Binding hot spots and amantadine orientation in the influenza A virus M2 proton channel. Biophys. J. 2009;97:2846–2853. doi: 10.1016/j.bpj.2009.09.004. [DOI] [PMC free article] [PubMed] [Google Scholar]
- 24.Landon MR, Lieberman RL, Hoang QQ, Ju S, Caaveiro JMM, Orwig SD, Kozakov D, Brenke R, Chuang GY, Beglov D, Vajda S, Petsko GA, Ringe D. Detection of ligand binding hot spots on protein surfaces via fragment-based methods: application to DJ-1 and glucocerebrosidase. J. Comput. Aided Mol. Des. 2009;23:491–500. doi: 10.1007/s10822-009-9283-2. [DOI] [PMC free article] [PubMed] [Google Scholar]
- 25.Ngan C, Beglov D, Rudnitskaya AN, Kozakov D, Waxman DJ, Vajda S. The structural basis of pregnane X receptor binding promiscuity. Biochemistry. 2009;48:11572–11581. doi: 10.1021/bi901578n. [DOI] [PMC free article] [PubMed] [Google Scholar]
- 26.Kozakov D, Hall DR, Chuang G, Cencic R, Brenke R, Grove LE, Beglov D, Pelletier J, Whitty A, Vajda S. Structural conservation of protein hot spots in protein-protein interfaces. Proc. Nat. Acad. Sci. USA. 2011;108:13528–13533. doi: 10.1073/pnas.1101835108. [DOI] [PMC free article] [PubMed] [Google Scholar]
- 27.Congreve M, Aharony D, Albert J, Callaghan O, Campbell J, Carr RA, Chessari G, Cowan S, Edwards PD, Frederickson M, McMenamin R, Murray CW, Patel S, Wallis N. Application of fragment screening by X-ray crystallography to the discovery of aminopyridines as inhibitors of beta-secretase. J. Med. Chem. 2007;50:1124–1132. doi: 10.1021/jm061197u. [DOI] [PubMed] [Google Scholar]
- 28.Fedorov R, Hartmann E, Ghosh DK, Schlichting I. Structural basis for the specificity of the nitric-oxide synthase inhibitors W1400 and Nomega-propyl-L-Arg for the inducible and neuronal isoforms. J. Biol. Chem. 2003;278:45818–45825. doi: 10.1074/jbc.M306030200. [DOI] [PubMed] [Google Scholar]
- 29.Griffin RJ, Henderson A, Curtin NJ, Echalier A, Endicott JA, Hardcastle IR, Newell DR, Noble MEM, Wang L, Golding BT. Searching for Cyclin-Dependent Kinase Inhibitors Using a New Variant of the Cope Elimination. J. Am. Chem. Soc. 2006;128:6012–6013. doi: 10.1021/ja060595j. [DOI] [PubMed] [Google Scholar]
- 30.Katz BA, Sprengeler PA, Luong C, Verner E, Elrod K, Kirtley M, Janc J, Spencer JR, Breitenbucher JG, Hui H, McGee D, Allen D, Martelli A, Mackman RL. Engineering inhibitors highly selective for the S1 sites of SER190 trypsin-like serine protease drug targets. Chem. & Biol. 2001;8:1107–1121. doi: 10.1016/s1074-5521(01)00084-9. [DOI] [PubMed] [Google Scholar]
- 31.Marino JP, Jr., Fisher PW, Hofmann GA, Kirkpatrick RB, Janson CA, Johnson RK, Ma C, Mattern M, Meek TD, Ryan MD, Schulz C, Smith WW, Tew DG, Tomazek TA, Jr., Veber DF, Xiong WC, Yamamoto Y, Yamashita K, Yang G, Thompson SK. Highly potent inhibitors of methionine aminopeptidase-2 based on a 1,2,4-triazole pharmacophore. J. Med. Chem. 2007;50:3777–3785. doi: 10.1021/jm061182w. [DOI] [PubMed] [Google Scholar]
- 32.Ritschel T, Hoertner S, Heine A, Diederich F, Klebe G. Crystal structure analysis and in silico pKa calculations suggest strong pKa shifts of ligands as driving force for high-affinity binding to TGT. ChemBioChem. 2009;10:716–727. doi: 10.1002/cbic.200800782. [DOI] [PubMed] [Google Scholar]
- 33.Ritschel T, Kohler PC, Neudert G, Heine A, Diederich F, Klebe G. How to replace the residual solvation shell of polar active site residues to achieve nanomolar inhibition of tRNA-guanine transglycosylase. ChemMedChem. 2009;4:2012–2023. doi: 10.1002/cmdc.200900343. [DOI] [PubMed] [Google Scholar]
- 34.Selinsky BS, Gupta K, Sharkey CT, Loll PJ. Structural analysis of NSAID binding by prostaglandin H2 synthase: time-dependent and time-independent inhibitors elicit identical enzyme conformations. Biochemistry. 2001;40:5172–5180. doi: 10.1021/bi010045s. [DOI] [PubMed] [Google Scholar]
- 35.Edmondson SD, Mastracchio A, Mathvink RJ, He J, Harper B, Park Y, Beconi M, Di Salvo J, Eiermann GJ, He H, Leiting B, Leone JF, Levorse DA, Lyons K, Patel RA, Patel SB, Petrov A, Scapin G, Shang J, Roy RS, Smith A, Wu JK, Xu S, Zhu B, Thornberry NA, Weber AE. (2S,3S)-3-Amino-4-(3,3-difluoropyrrolidin-1-yl)-N,N-dimethyl-4-oxo-2-(4-[1,2,4]triazolo[1,5-a]- pyridin-6-ylphenyl)butanamide: A Selective α-Amino Amide Dipeptidyl Peptidase IV Inhibitor for the Treatment of Type 2 Diabetes. J. Med. Chem. 2006;49:3614–3627. doi: 10.1021/jm060015t. [DOI] [PubMed] [Google Scholar]
- 36.Hiramatsu H, Kyono K, Higashiyama Y, Fukushima C, Shima H, Sugiyama S, Inaka K, Yamamoto A, Shimizu R. The structure and function of human dipeptidyl peptidase IV, possessing a unique eight-bladed beta-propeller fold. Biochem. Biophys. Res. Commun. 2003;302:849–854. doi: 10.1016/s0006-291x(03)00258-4. [DOI] [PubMed] [Google Scholar]
- 37.Rasmussen HB, Branner S, Wiberg FC, Wagtmann N. Crystal structure of human dipeptidyl peptidase IV/CD26 in complex with a substrate analog. Nat Struct Biol. 2003;10:19–25. doi: 10.1038/nsb882. [DOI] [PubMed] [Google Scholar]
- 38.Howard N, Abell C, Blakemore W, Chessari G, Congreve M, Howard S, Jhoti J, Murray CW, Seavers LCA, Van Montfort RLM. Application of fragment screening and fragment linking to the discovery of novel thrombin inhibitors. J. Med. Chem. 2006;59:1346–1355. doi: 10.1021/jm050850v. [DOI] [PubMed] [Google Scholar]
- 39.Qiu X, Yin M, Padmanabhan KP, Krstenansky JL, Tulinsky A. Structures of thrombin complexes with a designed and a natural exosite peptide inhibitor. J. Biol. Chem. 1993;268:20318–20326. [PubMed] [Google Scholar]
- 40.Huth JR, Park C, Petros AM, Kunzer AR, Wendt MD, Wang X, Lynch CL, Mack JC, Swift KM, Judge RA, Chen J, Richardson PL, Jin S, Tahir SK, Matayoshi ED, Dorwin SA, Ladror US, Severin JM, Walter KA, Bartley DM, Fesik SW, Elmore SW, Hajduk PJ. Discovery and design of novel HSP90 inhibitors using multiple fragment-based design strategies. Chem. Biol. Drug Des. 2007;70:1–12. doi: 10.1111/j.1747-0285.2007.00535.x. [DOI] [PubMed] [Google Scholar]
- 41.Dymock BW, Barril X, Brough PA, Cansfield JE, Massey A, McDonald E, Hubbard RE, Roughley SD, Webb P, Workman P, Wright L, Drysdale MJ. Novel, potent small-molecule inhibitors of the molecular chaperone Hsp90 discovered through structure-based design. J. Med. Chem. 2005;48:4212–4215. doi: 10.1021/jm050355z. [DOI] [PubMed] [Google Scholar]
- 42.Stebbins CE, Russo AA, Schneider C, Rosen N, Hartl FU, Pavletich NP. Crystal structure of an Hsp90-geldanamycin complex: targeting of a protein chaperone by an antitumor agent. Cell. 1997;89:239–250. doi: 10.1016/s0092-8674(00)80203-2. [DOI] [PubMed] [Google Scholar]
- 43.Brough PA, Aherne W, Barril X, Borgognoni J, Boxall K, Cansfield JE, Cheung K-MJ, Collins I, Davies NGM, Drysdale MJ, Dymock B, Eccles SA, Finch H, Fink A, Hayes A, Howes R, Hubbard RE, James K, Jordan AM, Lockie A, Martins V, Massey A, Matthews TP, McDonald E, Northfield CJ, Pearl LH, Prodromou C, Ray S, Raynaud FI, Roughley SD, Sharp SY, Surgenor A, Walmsley DL, Webb P, Wood M, Workman P, Wright L. 4,5-Diarylisoxazole HSP90 chaperone inhibitors: potential therapeutic agents for the treatment of cancer. J. Med. Chem. 2008;51:196–218. doi: 10.1021/jm701018h. [DOI] [PubMed] [Google Scholar]
- 44.Hajduk PJ, Boyd S, Nettesheim D, Nienaber V, Severin J, Smith R, Davidson D, Rockway T, Fesik SW. Identification of novel inhibitors of urokinase via NMR-based screening. J. Med. Chem. 2000;43:3862–3866. doi: 10.1021/jm0002228. [DOI] [PubMed] [Google Scholar]
- 45.Jiang L-G, Yu H-Y, Yuan C, Wang J-D, Chen L-Q, Meehan EJ, Huang Z-X, Huang M-D. Crystal structures of 2-aminobenzothiazole-based inhibitors in complexes with urokinase-type plasminogen activator. Chin. J. Struct. Chem. 2009;28:1427–1432. [Google Scholar]
- 46.Hartshorn MJ, Murray CW, Cleasby A, Frederickson M, Tickle IJ, Jhoti H. Fragment-based lead discovery using X-ray crystallography. J. Med. Chem. 2005;48:403–413. doi: 10.1021/jm0495778. [DOI] [PubMed] [Google Scholar]
- 47.Davies TG, Bentley J, Arris CE, Boyle FT, Curtin NJ, Endicott JA, Gibson AE, Golding BT, Griffin RJ, Hardcastle IR, Jewsbury P, Johnson LN, Mesguiche V, Newell DR, Noble ME, Tucker JA, Wang L, Whitfield HJ. Structure-based design of a potent purine-based cyclin-dependent kinase inhibitor. Nat Struct Biol. 2002;9:745–749. doi: 10.1038/nsb842. [DOI] [PubMed] [Google Scholar]
- 48.Schulze-Gahmen U, Brandsen J, Jones HD, Morgan DO, Meijer L, Vesely J, Kim SH. Multiple modes of ligand recognition: crystal structures of cyclin-dependent protein kinase 2 in complex with ATP and two inhibitors, olomoucine and isopentenyladenine. Proteins. 1995;22:378–391. doi: 10.1002/prot.340220408. [DOI] [PubMed] [Google Scholar]
- 49.Romier C, Reuter K, Suck D, Ficner R. Crystal structure of tRNA-guanine transglycosylase: RNA modification by base exchange. Embo. J. 1996;15:2850–2857. [PMC free article] [PubMed] [Google Scholar]
- 50.Meyer EA, Furler M, Diederich F, Brenk R, Klebe G. Synthesis and In Vitro Evaluation of 2-Aminoquinazolin-4(3H)-one-Based Inhibitors for tRNA-Guanine Transglycosylase (TGT) Helv. Chim. Acta. 2004;87:1333–1356. [Google Scholar]
- 51.Kallander LS, Lu Q, Chen W, Tomaszek T, Yang G, Tew D, Meek TD, Hofmann GA, Schulz-Pritchard CK, Smith WW, Janson CA, Ryan MD, Zhang GF, Johanson KO, Kirkpatrick RB, Ho TF, Fisher PW, Mattern MR, Johnson RK, Hansbury MJ, Winkler JD, Ward KW, Veber DF, Thompson SK. 4-Aryl-1,2,3-triazole: a novel template for a reversible methionine aminopeptidase 2 inhibitor, optimized to inhibit angiogenesis in vivo. J. Med. Chem. 2005;48:5644–5647. doi: 10.1021/jm050408c. [DOI] [PubMed] [Google Scholar]
- 52.Liu S, Widom J, Kemp CW, Crews CM, Clardy J. Structure of human methionine aminopeptidase-2 complexed with fumagillin. Science. 1998;282:1324–1327. doi: 10.1126/science.282.5392.1324. [DOI] [PubMed] [Google Scholar]
- 53.Patel S, Vuillard L, Cleasby A, Murray CW, Yon J. Apo and inhibitor complex structures of BACE (beta-secretase) J. Mol. Biol. 2004;343:407–416. doi: 10.1016/j.jmb.2004.08.018. [DOI] [PubMed] [Google Scholar]
- 54.Matter H, Kumar HS, Fedorov R, Frey A, Kotsonis P, Hartmann E, Fröhlich LG, Reif A, Pfleiderer W, Scheurer P, Ghosh DK, Schlichting I, Schmidt HH. Structural analysis of isoform-specific inhibitors targeting the tetrahydrobiopterin binding site of human nitric oxide synthases. J. Med. Chem. 2005;48:4783–4792. doi: 10.1021/jm050007x. [DOI] [PubMed] [Google Scholar]
- 55.Picot D, Loll PJ, Garavito RM. The X-ray crystal structure of the membrane protein prostaglandin H2 synthase-1. Nature. 1994;367:243–249. doi: 10.1038/367243a0. [DOI] [PubMed] [Google Scholar]
- 56.Chen Y, Shoichet BK. Molecular docking and ligand specificity in fragment-based inhibitor discovery. Nat. Chem. Biol. 2009;5:358–364. doi: 10.1038/nchembio.155. [DOI] [PMC free article] [PubMed] [Google Scholar]
- 57.Haider MK, Bertrand HO, Hubbard RE. Predicting fragment binding poses using a combined MCSS MM-GBSA approach. J. Chem. Inf. Model. 2011;51:1092–1105. doi: 10.1021/ci100469n. [DOI] [PubMed] [Google Scholar]
- 58.Verdonk ML, Giangreco I, Hall RJ, Korb O, Mortenson PN, Murray CW. Docking performance of fragments and druglike compounds. J. Med. Chem. 2011;54:5422–5431. doi: 10.1021/jm200558u. [DOI] [PubMed] [Google Scholar]
- 59.Reynolds CH, Bembenek SD, Tounge BA. The role of molecular size in ligand efficiency. Bioorg. Med. Chem. Lett. 2007;17:4258–4261. doi: 10.1016/j.bmcl.2007.05.038. [DOI] [PubMed] [Google Scholar]
- 60.Reynolds CH, Bembenek SD, Tounge BA. Ligand binding efficiency: trends, physical basis, and implications. J. Med. Chem. 2008;51:2432–2438. doi: 10.1021/jm701255b. [DOI] [PubMed] [Google Scholar]
- 61.Gilson MK, Sharp KA, Honig BA. Calculating the electrostatic potential of molecules in solution: Method and error assessment. J. Comp. Chem. 1988;9:327–335. [Google Scholar]
- 62.Brooks BR, Bruccoleri RE, Olafson BD, States DJ, Swaminathan S, Karplus M. CHARMM: A program for macromolecular energy, minimization, and dynamics calculations. J. Comp. Chem. 1983;4:187–217. [Google Scholar]
- 63.Schaefer M, Karplus MA. A comprehensive analytical treatment of continuum electrostatics. J. Phys. Chem. 1996;100:1578–1599. [Google Scholar]