FIGURE 1.
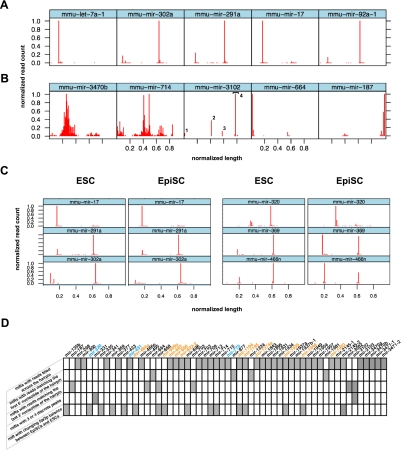
Graphical representation of miRNA reads from mouse ESCs and EpiSCs. Standardized graphical representation (normalized number of reads plotted along the normalized length of the stem–loop sequence) allows the rapid discrimination of miRNAs with expected profiles (A) from miRNAs with atypical profiles (B) including wide distribution of reads (mir-3470b and mir-714), putative Dicer double cut processing (mir-3102; the 4 peaks are numbered), and major reads count peak at one extremity of the stem–loop sequence (mir-664 and mir-187). (C) Side-by-side comparison of lattices obtained from ESCs and EpiSCs data sets allows efficient visualization of miRNAs with similar (mir-17, mir-291a, mir-302a) and different (mir-320, mir-369, mir-466n) processing in the two types of PSCs. All lattices display the 5′ offset of reads except for mir-187, for which 3′ offset is represented. (D) Summary of the 56 noncanonical miRNAs identified by our analysis. Differentially expressed miRNAs are indicated with color codes: orange for those more highly expressed in ESCs and blue for those more highly expressed in EpiSCs.

