Summary
Background and objectives
Mortality varies seasonally in the general population, but it is unknown whether this phenomenon is also present in hemodialysis patients with known higher background mortality and emphasis on cardiovascular causes of death. This study aimed to assess seasonal variations in mortality, in relation to clinical and laboratory variables in a large cohort of chronic hemodialysis patients over a 5-year period.
Design, setting, participants, & measurements
This study included 15,056 patients of 51 Renal Research Institute clinics from six states of varying climates in the United States. Seasonal differences were assessed by chi-squared tests and univariate and multivariate cosinor analyses.
Results
Mortality, both all-cause and cardiovascular, was significantly higher during winter compared with other seasons (14.2 deaths per 100 patient-years in winter, 13.1 in spring, 12.3 in autumn, and 11.9 in summer). The increase in mortality in winter was more pronounced in younger patients, as well as in whites and in men. Seasonal variations were similar across climatologically different regions. Seasonal variations were also observed in neutrophil/lymphocyte ratio and serum calcium, potassium, and platelet values. Differences in mortality disappeared when adjusted for seasonally variable clinical parameters.
Conclusions
In a large cohort of dialysis patients, significant seasonal variations in overall and cardiovascular mortality were observed, which were consistent over different climatic regions. Other physiologic and laboratory parameters were also seasonally different. Results showed that mortality differences were related to seasonality of physiologic and laboratory parameters. Seasonal variations should be taken into account when designing and interpreting longitudinal studies in dialysis patients.
Introduction
Seasonal variations have a large influence on physiology. Dietary intake, body composition and physical activity, and immune function are known to follow a seasonal rhythm (1). Seasonal variations in mortality have been described in the general population that were largely attributable to a higher incidence of cardiovascular complications (2). In addition, the incidence of cardiovascular and respiratory diseases is higher in winter.
Although various laboratory and BP measurements in dialysis patients have also shown seasonal variations (3–5), seasonal fluctuations in mortality have not been studied. Because of the far higher background mortality of dialysis patients compared with the general population, it is questionable whether the more subtle seasonal variations could still be observed in such patients. On the other hand, most dialysis patients die from cardiovascular causes (2). However, the spectrum of cardiovascular diseases in the general population, in whom a significant seasonal variability has been observed for ischemic heart disease and cerebrovascular disease, is different from that of dialysis patients. In the latter, relative incidence of acute cardiac death is much higher, and the relative incidence of thromboembolic processes is much lower than in the general population (6). Insight into seasonal variations of mortality, as well as other physiologic and laboratory parameters, might be relevant for interpretation and design of studies in dialysis patients. In addition, it is not known whether geographical variables associated with different climates are also related to variations in mortality and clinical and laboratory parameters in dialysis patients.
The aim of this study was to assess seasonal differences in mortality, as well as in physiologic and laboratory parameters, in a large cohort of dialysis patients in different climate regions of the United States over a 5-year period.
Materials and Methods
Data Sources and Study Population
We conducted a retrospective record review of chronic in-center hemodialysis patients treated in 51 Renal Research Institute (RRI) and New York Dialysis Services clinics between April 1, 2004 and March 31, 2009. For the analysis of mortality, an open cohort of patients was included that comprised any chronic hemodialysis patient who was treated in a RRI clinic during this time period (N=15,056). The cause of death is documented in the clinical database using International Classification of Diseases-9 codes.
If a patient dies within 30 days from withdrawal from one of the RRI clinics, it is the institute’s policy to track the death in the clinical database. For those patients, cause of death is still documented in the system based on the death record; withdrawal is not classified as a cause of death.
Seasons were defined according to the meteorological definition of winter as December through February, spring as March through May, summer as June through August, and autumn as September through November (7). All-cause, as well as cardiovascular versus noncardiovascular, mortality was noted per season per year and expressed as deaths per 100 patient-years.
RRI dialysis clinics, located in six states, were grouped in distinct major climate groups (8): Continental (n=14,015 patients in New York, Connecticut, Michigan, and Illinois), Mediterranean (n=316 patients in coastal California), and Subtropical (n=737 patients in North Carolina). For the mortality analysis, any patient with even one treatment was included in order to exclude survival bias of prevalent patients. We used the European Renal Association classification system, which separates patients into groups of <75 and ≥75 years of age.
For the analysis of other parameters, 10,303 (Table 1) patients in the RRI database with at least one treatment in each of the four calendar seasons were included, which was done to ensure that patients contribute to more than one season. Predialysis and postdialysis systolic BPs were recorded at each treatment and were averaged over each month and season. Intradialytic change in systolic BP was defined as the difference between predialysis and postdialysis BPs.
Table 1.
Patient characteristics
| Characteristic | All Patients | Continental | Mediterranean | Subtropical |
|---|---|---|---|---|
| Number of patients | 10,303 | 9605 | 226 | 472 |
| Demographics, % | ||||
| black | 49 | 49 | 2 | 64 |
| white | 42 | 41 | 84 | 34 |
| male | 55 | 55 | 56 | 53 |
| diabetic | 49 | 48 | 41 | 55 |
| age, yr | 61.7 (15.4) | 61.7 (15.3) | 68.2 (14.9) | 59.3 (16.1) |
| vintage , yr | 3.2 (3.5) | 3.2 (3.5) | 2.8 (3.3) | 3.3 (3.5) |
| Hemodialysis data | ||||
| predialysis systolic BP (mmHg) | 149.2 (17.6) | 149.2 (17.5) | 145.3 (18.2) | 150 (18.9) |
| predialysis diastolic BP (mmHg) | 77.7 (11) | 77.8 (11) | 74 (10.6) | 78.9 (11.5) |
| predialysis weight (kg) | 78.6 (21) | 78.5 (20.9) | 76 (20.4) | 80.6 (22.1) |
| predialysis temperature (°C) | 36.5 (0.2) | 36.5 (0.2) | 36.4 (0.2) | 36.1 (0.2) |
| interdialytic weight gain (kg) | 2.7 (0.9) | 2.7 (0.9) | 2.3 (1) | 2.9 (1) |
| pre/postdialysis systolic BP (mmHg) | 10.2 (10.8) | 10.1 (10.7) | 9.1 (10.9) | 11.8 (11.6) |
| pre/postdialysis temperature (°C) | −0.1 (0.1) | −0.1 (0.1) | 0 (0.1) | −0.1 (0.1) |
| Plasma measures | ||||
| albumin (g/dl) | 3.8 (0.4) | 3.8 (0.4) | 3.8 (0.3) | 3.8 (0.4) |
| hemoglobin (g/dl) | 11.9 (0.7) | 11.8 (0.7) | 11.9 (0.6) | 12 (0.7) |
| neutrophil/lymphocyte ratio | 3.9 (2.5) | 3.9 (2.5) | 4.1 (2.2) | 3.8 (2.5) |
| phosphorus (mg/dl) | 5.2 (1.1) | 5.2 (1.1) | 5.1 (1.2) | 5.2 (1.2) |
| calcium (mg/dl) | 9 (0.6) | 9 (0.6) | 9 (0.5) | 8.9 (0.5) |
| platelet (103/µl) | 221 (70.8) | 221.4 (70.9) | 128.3 (54.8) | 217.8 (69.2) |
| ferritin (ng/dl) | 673.5 (457.7) | 673.6 (463.5) | 575.3 (343.2) | 719.5 (373.5) |
| potassium (mEq/L) | 4.8 (0.5) | 4.8 (0.5) | 5 (0.5) | 4.6 (0.5) |
The data are presented as the mean (SD).
Laboratory results in the RRI database were automatically downloaded from Spectra Laboratories (Rockleigh, NJ). Data on BP, body temperature, and weight were recorded by the clinic staff, and cleaning procedures were followed to correct any clear data-entry errors.
This analysis of the RRI database was approved by the Beth Israel Medical Center Institutional Review Board.
Statistical Analyses
Chi-squared tests were used to compare mortality rates between seasons. Univariate cosinor analysis was conducted to test for seasonality in mortality and other variables (9). For seasonal variations in mortality, all values are presented with 95% confidence intervals (95% CIs; lower limit–upper limit). For seasonal variations in interdialytic weight gain and BP, all values are presented with 95% CIs (±95% CI).
All P values are two-sided. The analyses were conducted in SPSS (version 18; IBM, Somers, NY) and SAS (version 9.2; SAS Institute, Cary, NC) software.
Cosinor Analysis
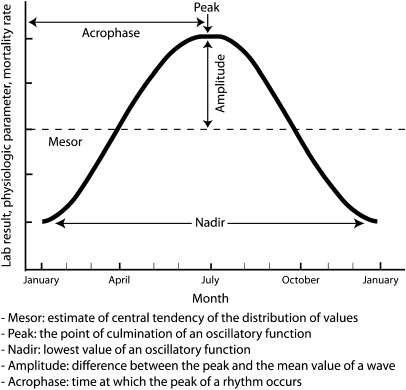
Cosinor analysis is a statistical methodology that fits a cosine function to a time series. It is often used in the analysis of biologic time series that demonstrate predictable rhythms (10). Cosine functions have the following characteristics (11), which are graphically shown in (Figure 1). In general, a cosine function of the following form was fitted for each variable of interest (12):
 |
where y is the variable of interest (e.g., mortality rate per season, mean predialysis systolic BP per season, mean albumin per season); T is the fundamental time period during which the cycle occurs (in this study, cyclical patterns over a course of 1 year or four seasons); M is the mesor or the mean value over the year; a is amplitude; t is the time period for which the value is fitted (e.g., summer or spring); θ is the acrophase; and ε is the error term.
Figure 1.
Cosinor characteristics. Mesor, estimate of central tendency of the distribution of values; peak, the point of culmination of an oscillary function; nadir, lowest value of an oscillatory function; amplitude, difference between the peak and the mean value of a wave; acrophase, time at which the peak of a rhythm occurs.
Using a simple trigonometric identity, one can transform the above relationship to a linear regression model as follows:
 |
where A = a cos(θ) and B = −a sin(θ).
For every year and season, one can calculate 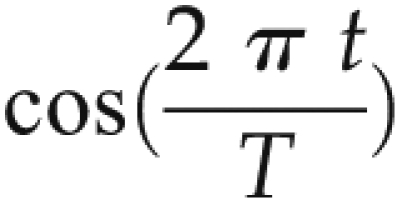 and
and  terms. Using simple linear regression coefficients, A and B can be estimated. Significant coefficients of A and B suggest that there exists a cyclical relationship to the variables of interest. In this analysis, this suggests that variables of interest follow a seasonal pattern. Predicted values presented here are those predicted by the linear model above; actual values are the mean values per season.
Results
We studied 15,056 in-center hemodialysis patients for the mortality analysis (open cohort of patients) and 10,303 in-center hemodialysis patients for the analysis of physiologic and laboratory parameters. The majority of the population was male (55%) with a mean age of 61.7 years and mean vintage of 3.2 years at the start of this study. Black patients accounted for 49% of the population and white patients accounted for 42%. Diabetic patients comprised 49% of the population.
For the mortality analysis, patients were followed for anywhere between 1 day and 4.9 years, with a median follow-up of 13.8 months.
Seasonal Variations in Mortality
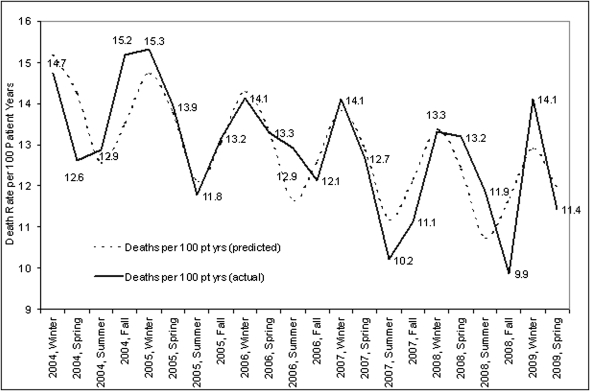
All-cause mortality was highest in winter (14.2 [95% CI, 13.3–15.1] deaths/100 patient-years), followed by spring (13.1 [12.2–14.0] deaths/100 patient-years), and autumn (12.3 [11.4–13.2] deaths/100 patient-years), with lowest mortality in summer (11.9 [11.1–12.7] deaths/100 patient-years) (Figure 2). Cosinor analysis over a 5-year period clearly demonstrated a seasonal component of mortality. The results were confirmed by comparing seasonal variations across three climate zones, with highest mortality in winter.
Figure 2.
Seasonal variations in mortality. The figure demonstrates seasonal aspects of mortality rate calculated in deaths per 100 patient years calculated per season and year. Pt yrs, patient-years.
In the continental climate clinics, there were significant differences between mortality rates among all four seasons (P<0.05). In the subtropical climate clinics, there were significant differences between winter and summer as well as winter and fall (P<0.05). In the Mediterranean climate, although the summer mortality rate was lower than winter, the only significant differences were between winter and fall, which may be attributed to small number of deaths and patients in the Mediterranean climate.
Using linear regression transformation to cosinor analysis, coefficients for seasonal factors (mesor, amplitude, acrophase) were significantly different from zero. Highest mortality (peak) was in winter and lowest mortality was in summer (nadir). Overall mortality declined over a 5-year period by an average of 0.46 deaths per 100 patient-years (P<0.01).
In subgroup analyses, the mortality during the winter period (compared with all other seasons) was significantly higher in males, in patients aged <75 years, in whites (compared with summer and autumn), and in patients with diabetes (compared with summer and autumn) (Table 2).
Table 2.
Seasonal variations in mortality by demographic groups
| Demographic | Winter | Spring | Summer | Autumn |
|---|---|---|---|---|
| Sex | ||||
| male | 14.87a,b,c | 12.92 | 11.92 | 11.78 |
| female | 13.47 | 13.22 | 11.97 | 12.88 |
| Race | ||||
| black | 11.64 | 10.31 | 10.2 | 10.18 |
| white | 18.6b,c | 17.77 | 14.84 | 15.71 |
| other | 11.01 | 9.98 | 10.21 | 10.07 |
| Diabetic status | ||||
| no | 12.47b | 11.68 | 10.84 | 11.09 |
| yes | 16.25b,c | 14.65 | 13.22 | 13.64 |
| Age | ||||
| <75 yr | 11.29a,b,c | 9.98 | 9.08 | 9.74 |
| ≥75 yr | 26.08 | 25.6 | 23.59 | 22.52 |
Data are deaths per 100 patient-years.
Winter versus spring, P<0.05.
Winter versus summer, P<0.05.
Winter versus autumn, P<0.05.
The main cause of death in the population was cardiovascular disease, which was significantly higher in the winter period (compared with all other seasons) for all climates. Death rates for infection-related reasons were highest in autumn but the differences were not significantly different across seasons, which may be attributed to a relatively small number of deaths (<90 deaths in each season) (Table 3).
Table 3.
Seasonal variations in mortality by causes of death
| Cause of Death | Winter | Spring | Summer | Autumn |
|---|---|---|---|---|
| Cardiovascular | 8.74a,b,c | 7.48 | 7.16 | 7.05 |
| Infection | 1.23 | 0.95 | 1.01 | 1.29 |
| Neoplasm | 0.45 | 0.44 | 0.28 | 0.27 |
Data are deaths per 100 patient-years.
Winter versus spring, P<0.05.
Winter versus summer, P<0.05.
Winter versus autumn, P<0.05.
Patient physiologic and laboratory parameters are not confounders to this cosinor analysis of mortality because they are in the hypothesized causal pathway between seasons and mortality (13). To understand whether it is the seasonality in patient physiologic and laboratory parameters that affects the seasonality in mortality, we analyzed whether mortality remains seasonally significant when adjusting by interdialytic weight gain, predialysis BP, intradialytic change in BP, neutrophil/lymphocyte ratio, platelet count, and calcium. After these adjustments, season itself was no longer a significant predictor of mortality.
Seasonal Variations in Interdialytic Weight Gain and BP
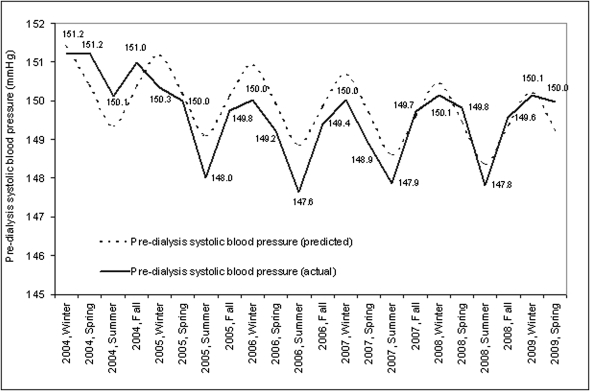
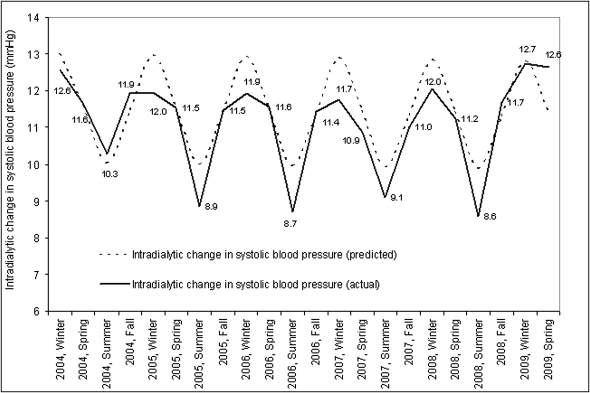
Cosinor analysis over a 5-year period demonstrated a seasonal component for predialysis systolic BP with higher BP in the winter months. Coefficients for seasonal factors (mesor, amplitude, acrophase) were significantly different from zero (P<0.01) (Figure 3). The largest intradialytic drop in systolic BP occurred in winter and was smallest in summer (Figure 4).
Figure 3.
Seasonal variations in predialysis systolic BP. The figure demonstrates seasonal aspects of predialysis systolic BP calculated as mean predialysis systolic BP by season and year in mmHg.
Figure 4.
Seasonal variations in intradialytic change in systolic BP. The figure demonstrates seasonal aspects of intradialytic change in systolic BP calculated as mean intradialytic change in systolic BP by season and year in mmHg.
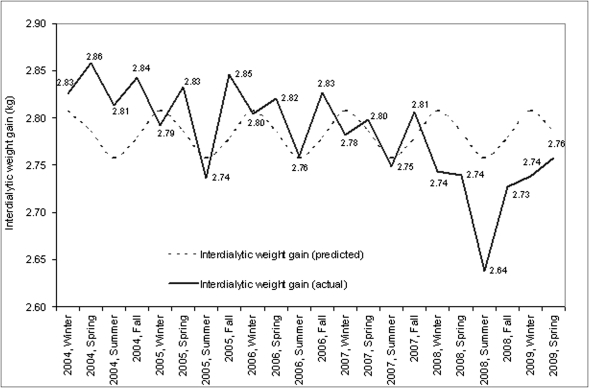
Across all three climatic zones, predialysis systolic BP (in mmHg) was also highest in the winter (continental, 150.4 [0.15]; Mediterranean, 146.3 [1.08]; subtropical, 152.03 [0.72]) and lowest in the summer (continental, 148.4 [0.15]; Mediterranean, 143.2 [1.04]); subtropical, 151.0 [0.74]). Interdialytic weight gain followed a cyclical pattern (Figure 5) with highest weight gains in the winter and lowest in the summer (P<0.01).
Figure 5.
Seasonal variations in interdialytic weight gain. The figure demonstrates seasonal aspects of interdialytic weight gain calculated as mean interdialytic weight gain by season and year in kilograms.
Seasonal Variations in Laboratory and Dialysis Adequacy Parameters
Cosinor analysis over a 5-year period demonstrated a seasonal component of neutrophil/lymphocyte ratio, serum potassium, and platelet count with highest values in winter and lowest in summer. Highest serum calcium values were observed in autumn and lowest in spring (data not shown). Coefficients of seasonal factors (mesor, amplitude, acrophase) were different from zero (P<0.01). No seasonal pattern was noted for albumin, hemoglobin, phosphate, and ferritin.
Discussion
The main results of this study are the large seasonal variations in mortality, with highest values for the winter. Seasonal variation in various clinical and laboratory parameters was also observed. Mortality differences between seasons are no longer significant when adjusting for seasonally variable clinical and laboratory parameters. This finding suggests that the relationship between season and mortality is either mediated by the variation in risk factors or by an underlying factor (e.g., intercurrent disease), which is seasonally variable and affects both risk factors as well as mortality.
Variations in mortality have been described in the general population, but not previously in dialysis patients. Despite milder winters, comparable differences in seasonal mortality were also apparent in coastal California, which is in agreement with European observations in the general population in which seasonal differences in mortality were even higher in Mediterranean countries than in Scandinavian countries (2,13–15). Because of the relatively small number of patients in climate zones other than continental, these data should be interpreted with some caution.
Although, due to the higher background mortality, absolute differences in mortality are much larger in this study compared with studies in the general population, relative differences seemed to be comparable. In this study, relative mortality was 19% higher in winter compared with the summer period, which is comparable to the differences in myocardial infarction in a study by Crawford et al. of the general population (16). In this study, the seasonal amplitude of standardized mortality rates fell in general between 10% and 25%.
The higher mortality in winter was largely due to cardiovascular causes. This is in agreement with data from the general population, in which mortality from cardiovascular diseases, such as cardiac arrhythmias, strokes, and ischemic heart disease, is the largest contributory factor to winter mortality (1,2). Possible explanations advanced for this phenomenon in the general population are hemoconcentration and an increased tendency for thrombosis (13,16), although it remains to be determined whether this phenomenon would also play a role in dialysis patients. Other factors, such as variations in sympathetic nervous system activity, might also contribute to an increased propensity for arrhythmias (17,18), although no seasonal variations in catecholamine excretion have been observed in nonuremic patients (19).
Although mortality from infectious disease was higher in the winter in the general population (2), no significant differences between seasons were observed in this study, which is likely due to the low rate of death from this complication in the database. It cannot be excluded that infections themselves lead to cardiovascular complications and subsequent mortality. The neutrophil/lymphocyte ratio, a surrogate marker of inflammation, was higher in the winter period for all climates. In earlier studies, higher neutrophil count and lower lymphocyte count were related to mortality in chronic dialysis patients (20).
Predialytic BP, as well as a intradialytic drop in BP, was highest in the winter period for all climates. In several studies on dialysis patients, seasonal variations in BP have been observed (3,4,21). Fine did not observe seasonal variations in BP in normotensive treated patients of a Canadian dialysis center despite large differences in outside temperatures, and suggested that BP variations in European studies might be related to nonclimatic factors (22). However, our results confirm the results of a study by Cheung et al. in National Institutes of Health–sponsored Hemodialysis study participants in a North American population (3). Admittedly, unlike the study by Fine, neither in the present nor in the National Institutes of Health–sponsored Hemodialysis data was a distinction made between patients treated with or without antihypertensive agents. Ultrafiltration volume was lowest in summer and highest in winter, which is in agreement with other studies in which seasonal variations in BP and interdialytic weight gain were observed (3,23,24). However, in other studies, no relationship between variations in extracellular volume and seasonal variations in BP was observed.21
Of the laboratory parameters, serum potassium showed a seasonal variation with highest values in winter, in agreement with the results of Yanai et al. (5), which might seem somewhat counterintuitive in view of a higher purposed fruit intake during summer (25). Although this might reflect a higher dietary intake in winter (1), phosphate levels were not significantly different between the various seasons in our study. No reliable data on phosphate binders were available in this study. In general, seasonal variations in laboratory parameters are not completely consistent between studies (3,5).
Limitations of this study are the fact that several relevant laboratory parameters were not included in the database and that patients in the different climate regions in the United States were unevenly distributed in the data. Clinic staff recorded data on BP, body temperature, and weight, and although some human error component is possible, additional data-cleaning procedures were followed to ensure that errors in the data entry were accounted for. If there are any remaining data-entry errors, they are expected to be random and not systematic. Vitamin D levels, which have been previously related to seasonal variability in BP (26) and perhaps even mortality (27), were not systematically measured.
Strong points of this study are the inclusion of a large number of dialysis patients, which makes it by far the largest dialysis cohort in which the concept of seasonal variations has been studied, and that this is the first study reflecting seasonal differences in mortality, as well as risk factors for mortality, in this population. An increased understanding of the effect of these variations may be useful for future interventional trials.
In conclusion, in a large cohort of dialysis patients, both overall and cardiovascular mortality were significantly higher in winter compared with other seasons. This variation was consistent in different climate regions. The relative increase in mortality seemed to be most pronounced in younger patients, as well as in whites and in men. Various physiologic and laboratory parameters were also seasonally different and were related to the seasonality in mortality. This study provides additional knowledge on the variation of the mortality risks of dialysis patients. Seasonal variations should be taken into account when designing and interpreting longitudinal studies in dialysis patients.
Disclosures
None.
Acknowledgments
We thank Peter Watson of the Medical Research Council Cognition and Brain Sciences Unit at the University of Cambridge for insight into cosinor models.
Footnotes
Published online ahead of print. Publication date available at www.cjasn.org.
References
- 1.Shephard RJ, Aoyagi Y: Seasonal variations in physical activity and implications for human health. Eur J Appl Physiol 107: 251–271, 2009 [DOI] [PubMed] [Google Scholar]
- 2.The Eurowinter Group: Cold exposure and winter mortality from ischaemic heart disease, cerebrovascular disease, respiratory disease, and all causes in warm and cold regions of Europe. Lancet 349: 1341–1346, 1997 [PubMed] [Google Scholar]
- 3.Cheung AK, Yan G, Greene T, Daugirdas JT, Dwyer JT, Levin NW, Ornt DB, Schulman G, Eknoyan G. Hemodialysis Study Group: Seasonal variations in clinical and laboratory variables among chronic hemodialysis patients. J Am Soc Nephrol 13: 2345–2352, 2002 [DOI] [PubMed] [Google Scholar]
- 4.Argilés A, Mourad G, Mion C: Seasonal changes in blood pressure in patients with end-stage renal disease treated with hemodialysis. N Engl J Med 339: 1364–1370, 1998 [DOI] [PubMed] [Google Scholar]
- 5.Yanai M, Satomura A, Uehara Y, Murakawa M, Takeuchi M, Kumasaka K: Circannual rhythm of laboratory test parameters among chronic haemodialysis patients. Blood Purif 26: 196–203, 2008 [DOI] [PubMed] [Google Scholar]
- 6.Meier P, Vogt P, Blanc E: Ventricular arrhythmias and sudden cardiac death in end-stage renal disease patients on chronic hemodialysis. Nephron 87: 199–214, 2001 [DOI] [PubMed] [Google Scholar]
- 7.American Meteorological Society: Classification of seasons. Available at: http://amsglossary.allenpress.com/glossary/search?id=winter1 Accessed September 7, 2011
- 8.Köppen climate classification. Encyclopædia Britannica Online. Available at: http://www.britannica.com/EBchecked/topic/322068/Koppen-climate-classification Accessed September 7, 2011
- 9.Moen AN, Boomer GS: A tandem cosine algorithm for modeling rhythmic change. Ecol Modell 134: 275–282, 2000 [Google Scholar]
- 10.Barnett A, Dobson A: Analysing Seasonal Health Data, New York, Springer, 2010
- 11.O’Dell LE, Chen SA, Smith RT, Specio SE, Balster RL, Paterson NE, Markou A, Zorrilla EP, Koob GF: Extended access to nicotine self-administration leads to dependence: Circadian measures, withdrawal measures, and extinction behavior in rats. J Pharmacol Exp Ther 320: 180–193, 2007 [DOI] [PubMed] [Google Scholar]
- 12.Padhye NS, Hanneman SK: Cosinor analysis for temperature time series data of long duration. Biol Res Nurs 9: 30–41, 2007 [DOI] [PubMed] [Google Scholar]
- 13.Keatinge WR, Donaldson GC: The impact of global warming on health and mortality. South Med J 97: 1093–1099, 2004 [DOI] [PubMed] [Google Scholar]
- 14.Mercer JB: Cold—an underrated risk factor for health. Environ Res 92: 8–13, 2003 [DOI] [PubMed] [Google Scholar]
- 15.Grut M: Cold-related deaths in some developed countries. Lancet 1: 212, 1987 [DOI] [PubMed] [Google Scholar]
- 16.Crawford VL, McCann M, Stout RW: Changes in seasonal deaths from myocardial infarction. QJM 96: 45–52, 2003 [DOI] [PubMed] [Google Scholar]
- 17.Fries RP, Heisel AG, Jung JK, Schieffer HJ: Circannual variation of malignant ventricular tachyarrhythmias in patients with implantable cardioverter-defibrillators and either coronary artery disease or idiopathic dilated cardiomyopathy. Am J Cardiol 79: 1194–1197, 1997 [DOI] [PubMed] [Google Scholar]
- 18.Anand K, Aryana A, Cloutier D, Hee T, Esterbrooks D, Mooss AN, Mohiuddin SM: Circadian, daily, and seasonal distributions of ventricular tachyarrhythmias in patients with implantable cardioverter-defibrillators. Am J Cardiol 100: 1134–1138, 2007 [DOI] [PubMed] [Google Scholar]
- 19.Nicolau GY, Haus E, Popescu M, Sackett-Lundeen L, Petrescu E: Circadian, weekly, and seasonal variations in cardiac mortality, blood pressure, and catecholamine excretion. Chronobiol Int 8: 149–159, 1991 [DOI] [PubMed] [Google Scholar]
- 20.Reddan DN, Klassen PS, Szczech LA, Coladonato JA, O’Shea S, Owen WF, Jr, Lowrie EG: White blood cells as a novel mortality predictor in haemodialysis patients. Nephrol Dial Transplant 18: 1167–1173, 2003 [DOI] [PubMed] [Google Scholar]
- 21.Cheng LT, Jiang HY, Tang LJ, Wang T: Seasonal variation in blood pressure of patients on continuous ambulatory peritoneal dialysis. Blood Purif 24: 499–507, 2006 [DOI] [PubMed] [Google Scholar]
- 22.Fine A: Lack of seasonal variation in blood pressure in patients on hemodialysis in a North American center. Am J Kidney Dis 36: 562–565, 2000 [DOI] [PubMed] [Google Scholar]
- 23.Spósito M, Nieto FJ, Ventura JE: Seasonal variations of blood pressure and overhydration in patients on chronic hemodialysis. Am J Kidney Dis 35: 812–818, 2000 [DOI] [PubMed] [Google Scholar]
- 24.Argilés A, Lorho R, Servel MF, Chong G, Kerr PG, Mourad G: Seasonal modifications in blood pressure are mainly related to interdialytic body weight gain in dialysis patients. Kidney Int 65: 1795–1801, 2004 [DOI] [PubMed] [Google Scholar]
- 25.Cox BD, Whichelow MJ, Prevost AT: Seasonal consumption of salad vegetables and fresh fruit in relation to the development of cardiovascular disease and cancer. Public Health Nutr 3: 19–29, 1999 [DOI] [PubMed]
- 26.Argilés A, Lorho R, Servel MF, Couret I, Chong G, Mourad G: Blood pressure is correlated with vitamin d(3) serum levels in dialysis patients. Blood Purif 20: 370–375, 2002 [DOI] [PubMed] [Google Scholar]
- 27.Wolf M, Shah A, Gutierrez O, Ankers E, Monroy M, Tamez H, Steele D, Chang Y, Camargo CA, Jr, Tonelli M, Thadhani R: Vitamin D levels and early mortality among incident hemodialysis patients. Kidney Int 72: 1004–1013, 2007 [DOI] [PubMed] [Google Scholar]


