Abstract
The identification of optimal candidates for ventricular assist device (VAD) therapy is of great importance for future widespread application of this life-saving technology. During recent years, numerous traditional statistical models have been developed for this task. In this study, we compared three different supervised machine learning techniques for risk prognosis of patients on VAD: Decision Tree, Support Vector Machine (SVM) and Bayesian Tree-Augmented Network, to facilitate the candidate identification. A predictive (C4.5) decision tree model was ultimately developed based on 6 features identified by SVM with assistance of recursive feature elimination. This model performed better compared to the popular risk score of Lietz et al. with respect to identification of high-risk patients and earlier survival differentiation between high- and low- risk candidates.
Keywords: Decision Tree, Support Vector Machine, Bayesian Tree-Augmented Network
I. Introduction
Heart failure affects approximately 5.8 million people in the United States each year with associated costs accounting for 2–3% of the national budget for health care [1]. Mechanical circulatory support, particularly ventricular assist devices (VADs) are becoming accepted options for treatment of end-stage heart failure. The advancing technology is now moving beyond the small scope of bridge-to-cardiac-transplant (BTT) and into the wider population for which durable long-term support (destination therapy, DT) and occasionally bridge-to-recovery (BTR) may be appropriate. Due to the limited availability of donor organs and the low incidence of cardiac recovery, VAD DT is the only remaining option for tens of thousands of patients with end-stage heart failure. The landmark clinical study, Randomized Evaluation of Mechanical Assistance in the Treatment of Congestive Heart Failure (REMATCH) found that VAD DT provides better survival for end-stage heart failure compared to optimal medical therapy [2]. However, utilization of VADs remains far below the projected tens of thousands of patients that potentially would benefit. The future growth of this therapy remains optimistic however, on account of the new generation of VAD technology which is more reliable, durable and smaller [3].
Following FDA approval of VAD DT in 2002, several statistical studies have been conducted to develop predictive models to facilitate candidate selection [4–8]. One of the important pre-operative risk scores was introduced in 2007 by Lietz et al., which was based on a meta analysis of cohort of 222 patients receiving a HeartMate XVE VAD (Thoratec, Pleasanton, CA, US) at 56 hospitals in United States between 2001 and 2005. Their study suggests that VAD implantation in less severely ill patients provides justifiable survival benefit over medical treatment; while further investigation of outcomes remains to be conducted. [7]
The present study was undertaken to explore the utility of modern machine learning techniques to translate retrospective patient data into a prognostic tool that could be used on a personalized basis. Similar tools have been successfully developed for a wide range of applications from business tasks to scientific tasks as well as disease diagnosis, such as cancer, pneumonitis, etc. [9, 10]. However, to our best knowledge, modern data mining and machine learning techniques have not yet been applied to VAD therapy. In this study, we considered several classification algorithms to stratify the VAD patients to high- and low- risk groups with respect to survival at 90 days after VAD implantation. The Lietz’s model was used as a benchmark for evaluating the efficacy of this risk prognosis model. We compared three well-known classification algorithms: C4.5 decision tree, Bayesian Tree-Augmented Network (B-TAN) and Support Vector Machine (SVM). C4.5 is a landmark decision tree program that is most widely used in practice [11]. B-TAN is an extension of Naïve Bayesian Network. It is a simple probabilistic classifier that has previously demonstrated very good performance in many class-prediction scenarios [12]. SVM, introduced by Boser, Guyon and Vapnik in 1992 [13], performs classification by linearly / non-linearly mapping the n-dimensional input into a higher dimensional feature space. In this high dimensional feature space, a linear classifier is constructed. The introduction of Kernel methods resolves unreasonable computation for SVM and makes it more attractive. SVM has been used effectively in medical applications, including breast cancer diagnosis and electrocardiology [14, 15].
This paper is organized as follows: Section 2 introduces the descriptions of dataset, management of missing values and three algorithms. Section 3 reports the comparative performance of the machine learning algorithms and the existing Lietz’s model. Section 4 provides a discussion of results and future work.
II. Methods
A. Patient data
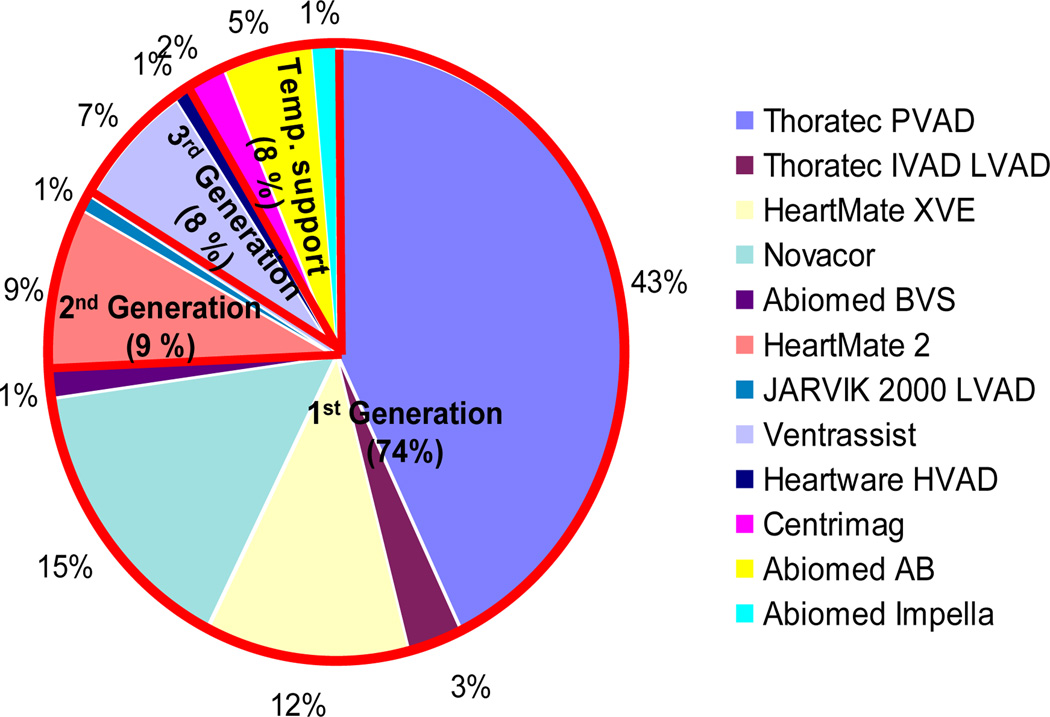
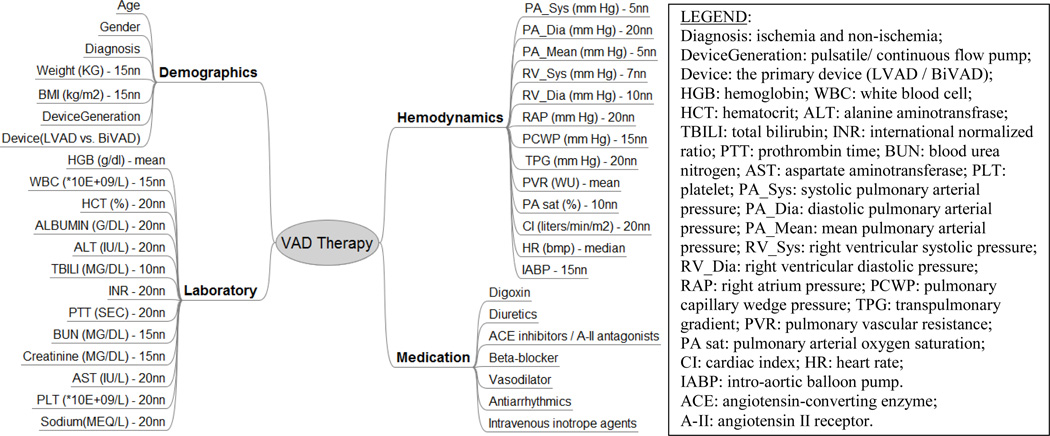
The data set for the present study was extracted from clinical records of a cohort of 310 patients who were enrolled in the Artificial Heart Program (AHP) at University of Pittsburgh Medical Center (UPMC) from May 1996 to Oct. 2009. Since this is a single center study spanning almost 13 years, these data comprise 12 different VAD devices (See Fig. 1). To access the 90-day survival rate of VAD patients, 72 patients who received a heart transplant within 90 days after VAD implantation were excluded from this study, as well as 17 patients with tracking days less than 90 days and 25 patients that were “weaned” off their device. Besides these 114 patients, another 2 patients were also excluded from this study who had expired within 24 hours of receiving a temporary VAD. The resulting cohort for risk stratification comprises 194 VAD patients. Each patient record included (up to) 40 features, among whom 120 VAD patients were alive at 90-day of post-VAD implantation; while 74 VAD patients expired within 90 days. These features were grouped into four sets: demographics (7), laboratory test (13), hemodynamics (13), and medication (7) (See Fig. 2).
Figure 1.
Distribution of initial VAD implantations in patient cohort at AHP UPMC. The red border separates the pie into 1st, 2nd, 3rd generation of pump and temporary (Temp.) support.
Figure 2.
Data features (n=40) for risk stratification in VAD therapy. The descriptions after the dash line demonstrate the method to fill the missing values for each feature.
B. Management of missing data elements
Each of the data records used for classification was limited to the time period 14 days prior to surgery. In the case of multiple records, the one closest to surgery was used. In some cases there were data elements unavailable within this time period, in which case the data element was deemed as missing. Two exceptions were the designation of the type of device (DeviceGeneration: pulsatile or continuous flow) and number of devices implanted (one for left ventricular device, LVAD or two for Bi-Ventricular VAD, BiVAD.) Nine different methods were compared to fill the missing elements: mean, median, and seven varieties of nearest neighbor (nn), of various sizes: 1, 3, 5, 7, 10, 15, and 20. For each feature, the mean predictive errors were calculated from 10-fold cross prediction in available records. It means that after computing the predicted values of 1/10th patients from the remaining 9/10th data, the difference between these 1/10th calculated values and the same 1/10th original data can be attained. Repeating this procedure on ten different folds of available data and averaging the difference yielded the mean predictive error, which served as a criterion to choose the corresponding method to fill the missing value per feature (See Fig. 2).
C. Algorithm selections
The patients were divided into two risk groups: low risk, defined as those who survive through 90 days after VAD implantation; and high risk, those deceased within 90 days. Three different algorithms were compared to classify the patient cohort using pre-intervention features. The evaluation was based on a 10-times 10-fold cross validation. Metrics included: area percentage under the received operative curve (ROC), Cohen's Kappa statistics (a robust measure of the agreement of two raters) and prediction accuracy.
Decision Tree is a divide-and-conquer non-linear classifier and has several variations. In this study, we employed a well-known Decision Tree algorithm C4.5, implemented in an open-source software library (WEKA, J48, University of Waikato, New Zealand) [16], which employs an information-theoretic measure to rank the features according to information gain, defined as:
| (1) |
| (2) |
| (3) |
where H(Y) is the entropy of patient outcomes yi ∈ {“deceased”, “alive”}, P(yi) is the associated probability of a certain patient outcome yi; H(Y|X) is the entropy of patient outcomes for a given set of observed feature (X) values xj ∈ {x1,…, xv}, P(yi|xj) is the conditional probability of yi for a given a value of feature xj. Information gain IG(X) is therefore the difference between the entropy before and after observing a given feature. By recursively applying the highest information gain criterion to select predictive feature, C4.5 creates a tree of classificatory decision with respect to a previously chosen target classification [17].
The SVM classification technique in this study implements linear class boundary by maximizing the margin of the hyperplane built on a “support vector,” a small subset of training examples closest to the hyperplane. Polynomial kernel with exponent value = 1 was used to transform the features to avoid overfitting.
B-TAN is probabilistic generic method. It generalizes the naïve Bayesian classifier and outperforms naïve Bayesian, yet maintains its computational simplicity [12]. Rather than the strong independence assumption among features given classes in naïve Bayesian; B-TAN seeks the mutual information between features conditional upon their class variables. This function is defined as
| (4) |
where, X1 and X2 are two features and Y is the class variable. Equation (4) reflects the information X2 provides about X1 when the class value Y is known. Using this criterion, a maximum weighted spanning tree is constructed that represents the dependences among features and class variable (outcome variable in the present study).
D. Feature selection
Equally important as the selection of the classifier algorithm is the selection of the data features. Identifying only the most predictive features would improve the overall efficiency by reducing the dimensions of data feature space and avoiding overfitting. Two kinds of methods were employed to rank the available features: SVM based on recursive feature elimination (RFE) [18] and Chi-Square statistics. The former maximizes the margin of the decision boundary, which is equivalent to minimize the weights of features in the decision function. In this way, the corresponding weight serves as a criterion to rank the features. The latter evaluates the utility of a feature by computing the Chi-square value with regard to the class. As before, 10-times 10-fold cross validation was used to identify subset of predictive features according to Kappa statistics.
Overall error analysis was conducted to compare the differences of mean values of each feature among the four groups – true and false high risk groups, true and false low risk groups. It is beneficial to identify problems in data mining and further improve performance of algorithm. Fig.3 illustrates the overall procedure for data analysis.
Figure 3.
Schematic demonstration of the procedures for algorithm and feature selection.
III. Results
A. Algorithm performance
Table I summarizes the predictive performance of the algorithms according to Kappa statistics, area percentage under ROC and prediction accuracy for three algorithms. It demonstrates that decision tree performs significantly better than B-TAN on this problem (Kappa= 0.18 versus −0.01; percentage area under ROC: 61% versus 50%) and slightly better than SVM.
TABLE I.
Performance Summary of Three Different Classification Algorithms.
| Algorithm | Kappa | Area under ROC | Prediction accuracy |
|---|---|---|---|
| Decision Tree | 0.18 | 0.61 | 61.20% |
| SVM | 0.16 | 0.57 | 62.34% |
| B-TAN | −0.01* | 0.50* | 57.54% |
indicates significantly worse performance compared to Decision Tree
B. Decision tree model
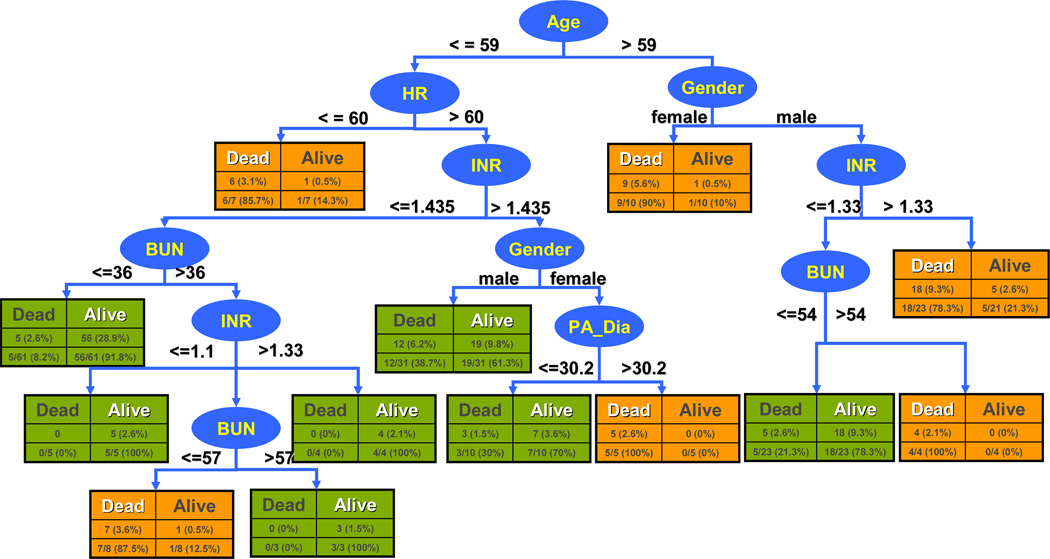
The completed Decision Tree model is depicted in Fig.4. It is based on 6 features selected by SVM RFE; namely, age, heart rate (HR), gender, international normalized ratio (INR), blood urea nitrogen (BUN), diastolic pulmonary arterial pressure (PA_Dia). The respective break points of each feature within each branch are inter-related. The classification initially distinguishes the patient groups by age with threshold 59. This is followed by gender and HR, and so on. For example, a male patient older than 59 with INR larger than 1.33, would be classified as potential high-risk candidate, while with the same patient with reduced INR below 1.33 and BUN under 54 would be classified as low-risk candidate (likely to survive through 90 days after VAD implantation). Using this model, all patients in the cohort were classified. The 10-fold cross validation results are also indicated in the figure. Within each rectangle, the columns differentiate between the correctly identified by the model (white heading) and those incorrectly classified (black heading). The rows provide respective number and percentages within each branch (bottom row) and overall (top row.)
Figure 4.
Risk stratification model for patients in VAD therapy. Ellipses indicate features used for classification; rectangles indicate outcome green=low risk (predicted survival at 90 days) orange = high risk (predicted death within 90 days.) Each rectangle also indicates the number of patients correctly identified by the model (white heading) and those incorrectly classified (black heading), as well as the respective percentages within each branch (bottom row) and overall (top row.)
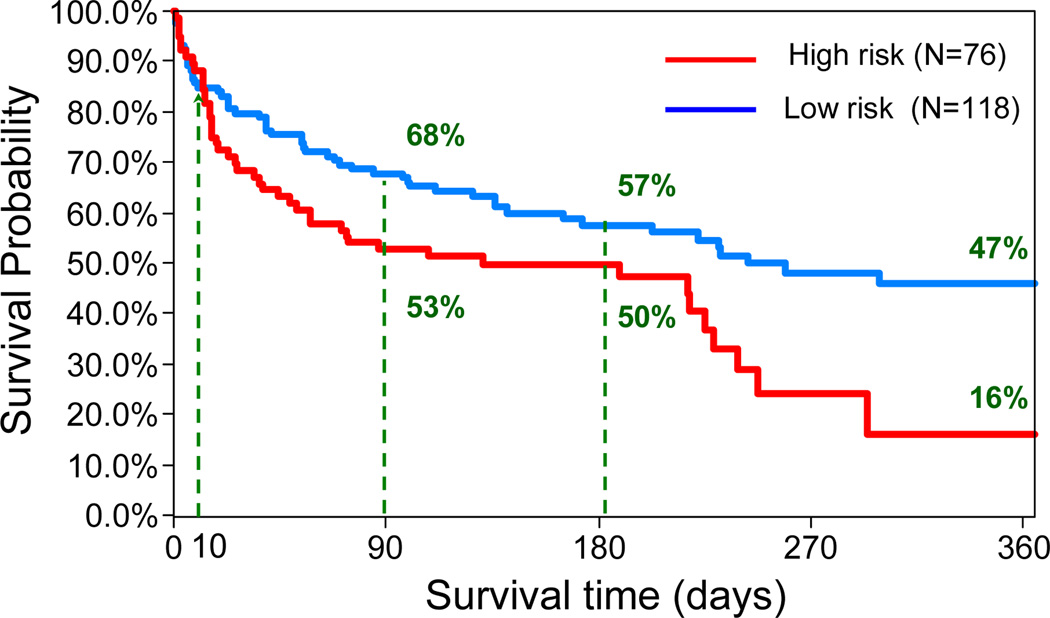
Table II summarizes the accuracy of the classifier for predicting 90-day survival of the 194 patients in the VAD cohort. The overall predictive accuracy is 60% with 67% sensitivity (true alive/low risk) and 49% specificity (true deceased/high risk). The area percentage under the ROC is 61%. The corresponding Kaplan Meier survival curves of the two groups are shown in Fig.5. Even though the prediction accuracy of this model is not very high, the survival rates between these two groups are significantly different with log-rank p=0.03. The survival rates of 118 low-risk candidates was 68%, 57% and 47% at 3, 6 months and 1 year compared with the survival rates of 76 high-risk candidates, which was 53%, 50% and 16%, respectively.
TABLE II.
Performance of Decision Tree Model in Prediction of 90-day Survival.
| Predict Alive | Predict Diseased | |
|---|---|---|
| True Alive | 80 (67%) | 40 |
| True Diseased | 38 | 36 (49%) |
Figure 5.
Kaplan Meier plots based on risk stratification for VAD patients using the decision tree model. The survival rates in two groups are significantly different (log-rank p=0.03).
C. Comparison with Lietz model
The survival index of Lietz et al. provides a weighted pre-operative risk score for 90-day in-hospital mortality after LVAD implantation [7]. It was computed for this patient cohort using 9 features and associated weights published by Letiz et al. According to the published definition, the breakpoint of 17 was used to discriminate between high risk and low risk score. The performance of Lietz’s model on the VAD cohort is summarized in Table III. Fig. 6 shows the corresponding Kaplan-Meier survival curves. Lietz’s model identifies 40 patients in high-risk group with 43%, 27% and 7% survival rates at 3, 6 months and 1 year, compared with 154 patients in low-risk group, who have survival rates as 67%, 62% and 45%, respectively. It demonstrated 65% predictive accuracy with 85.8% sensitivity (true low-risk) and 31.1% specificity (true highrisk). Compared to the performance of the current model, it is more conservative in predicting high-risk candidates (n=40 vs 76). Fig.6 demonstrates that this model was not able to discriminate between groups within 36 days post operatively, as compared to the present model which differentiates the groups at approximately 10 days.
TABLE III.
Performance of Model of Leitz et al. in Prediction of 90-day Survival.
| Predict Low Risk | Predict High Risk | |
|---|---|---|
| True Low Risk | 103 (85.8%) | 17 |
| True High Risk | 51 | 23 (31.1%) |
Figure 6.
Kaplan Meier survival for VAD patients stratified by the Lietz’s model. The two groups are indistinguishable up to 36 days post operatively.
IV. Discussion
A decision tree model to diagnose patient risk on VAD therapy was developed based on a C4.5 Decision Tree classifier using six variables. Its performance in predicting 90-day survival was far from perfect, correctly predicting 67% of the surviving patients and 49% of those who expired within 90 days. Compared to a linearly weighted index of Leitz et al, the decision tree performed better in predicting high-risk/deceased patients and less well in predicting survivors. It exhibited a more aggressive (less conservative) use of VAD therapy. This raises an important question in evaluating such a model: whether it is more desirable to err on the side of implanting a VAD in a patient with a poor chance of survival versus denying a patient of a potentially-beneficial VAD, hence reserving for only the “best” candidates.
By utilizing modern machine learning techniques, the risk prognosis of our model is better than the existing index with regard to identification of more high-risk patients and earlier discrimination between low- and high- risk patients (10 days versus 36 days), both of which are crucial for optimal candidates identification. One explanation for the improved prognostic ability is that decision tree algorithm is capable to capture the mutual and non-linear information among pre-operative features; whereas the traditional methods make implicit orthogonality assumptions by either pure univariate analysis or multivariate analysis of the features identified as significant predictors from univariate analysis. This study implies that the mutual information among pre-operative features is essential for risk prognosis in VAD patients, which, to some extent, reflects the complex physiology and pathology in human system.
In addition to differences in accuracy, the models differ in transparency. The decision tree model for example is much easier to be interpreted by the physicians following the tree branches. By contrast, there is more “blind faith” in accepting the results of a purely mathematically derived index. Nevertheless, it is interesting to note the differences and overlap between the respective feature sets. Only 3 of the 9 variables of the Leitz’s index were identified by the decision tree algorithm. This might be explained by the interrelationship between variables. For example, the use of vasodilator therapy in the Leitz’s model might be determined by a combination of variables in the decision tree such as HR and pulmonary pressure. These relationships are worthy of future investigation and exploration.
Of the three algorithms considered, the B-TAN performed the worst. This might be explained from the small size of the dataset and quantity of missing values, which affect the confidence and correctness of probability computation. Due to the small data size, SVM is chosen with exponent=1 polynomial kernel to avoid overfitting; but with additional data, a greater exponent could be used, perhaps improving its performance over the decision tree.
The results of this study provide encouragement that decision tree analysis, with additional refinement, may have the potential to assist the physician to identify the optimal candidates for VAD therapy. A decision tree, or any decision support algorithm, is unlikely to replace the physician’s knowledge, reasoning and judgment; rather, this algorithm would assist the physician in processing and interpreting the large magnitude of data associated with the patient. Patients identified as high-risk, for example, may need to more carefully consider the costs and benefits of VAD therapy.
A significant limitation of present study is the relatively small sample size, which combined with a large portion of incomplete data records greatly degrades the predictive accuracy and confidence of the prognostic model. Despite using nine different methods to fill-in the missing data, there is no substitute for actual data. Consequently, ongoing research is aimed to collect, prospectively, more complete patient records which will allow the model to be recalibrated with the hope of its introduction into the standard practices of end-stage cardiac care, and greater utilization of VAD therapy.
Acknowledgment
This study was supported by NIH grant 1R01HL086918-01. We would like to thank Michelle D. Navoney, the honest broker in AHP program, who deidentifies the patient data for us.
Contributor Information
Yajuan Wang, Email: yajuanw@andrew.cmu.edu, School of Engineering, Carnegie Mellon University, Pittsburgh, PA, US.
Carolyn Penstein Rosé, Email: cprose@cs.cmu.edu, School of Computer Science, Carnegie Mellon University, Pittsburgh, PA, US.
Antonio Ferreira, Email: antonio.ferreira@andrew.cmu.edu, School of Engineering, Carnegie Mellon University, Pittsburgh, PA, US, Department of Mathematics, Universidade Federal do Maranhao, Brazil.
Dennis M. McNamara, Email: mcnamaradm@upmc.edu, Cardiovascular Institute, University of Pittsburgh Medical Center, Pittsburgh, PA, US.
Robert L. Kormos, Email: kormosrl@upmc.edu, Cardiac Surgery, University of Pittsburgh Medical Center, Pittsburgh, PA, US.
James F. Antaki, Email: antaki@andrew.cmu.edu, School of Engineering & Computer Science, Carnegie Mellon University, Pittsburgh, PA, US.
Rfeerences
- 1.Heart disease and stroke statistics - 2010 update. American Heart Association Dallas, TX. 2010 [Google Scholar]
- 2.Rose EA, Gelijns AC, Moskowitz AJ, Heitjan DF, Stevenson LW, Dembitsky W, et al. Long-term mechanical left ventricular assistance for end-stage heart failure. N Engl J Med. 2001 Nov;vol. 345:1435–1443. doi: 10.1056/NEJMoa012175. [DOI] [PubMed] [Google Scholar]
- 3.Lietz K, Miller LW. Destination therapy: current results and future promise. Semin Thorac Cardiovasc Surg. 2008 Fall;vol. 20:225–233. doi: 10.1053/j.semtcvs.2008.08.004. [DOI] [PubMed] [Google Scholar]
- 4.Klotz S, Vahlhaus C, Riehl C, Reitz C, Sindermann JR, Scheld HH. Pre-operative prediction of post-VAD implant mortality using easily accessible clinical parameters. J Heart Lung Transplant. 2009 Jan;vol. 29:45–52. doi: 10.1016/j.healun.2009.06.008. [DOI] [PubMed] [Google Scholar]
- 5.Levy WC, Mozaffarian D, Linker DT, Farrar DJ, Miller LW. Can the Seattle heart failure model be used to risk-stratify heart failure patients for potential left ventricular assist device therapy? J Heart Lung Transplant. 2009 Mar;vol. 28:231–236. doi: 10.1016/j.healun.2008.12.015. [DOI] [PubMed] [Google Scholar]
- 6.Levy WC, Mozaffarian D, Linker DT, Sutradhar SC, Anker SD, Cropp AB, et al. The Seattle Heart Failure Model: prediction of survival in heart failure. Circulation. 2006 Mar;vol. 113:1424–1433. doi: 10.1161/CIRCULATIONAHA.105.584102. [DOI] [PubMed] [Google Scholar]
- 7.Lietz K, Long JW, Kfoury AG, Slaughter MS, Silver MA, Milano CA, et al. Outcomes of left ventricular assist device implantation as destination therapy in the post- REMATCH era: implications for patient selection. Circulation. 2007 Jul;vol. 116:497–505. doi: 10.1161/CIRCULATIONAHA.107.691972. [DOI] [PubMed] [Google Scholar]
- 8.Schaffer JM, Allen JG, Weiss ES, Patel ND, Russell SD, Shah AS, et al. Evaluation of risk indices in continuous-flow left ventricular assist device patients. Ann Thorac Surg. 2009 Dec;vol. 88:1889–1896. doi: 10.1016/j.athoracsur.2009.08.011. [DOI] [PubMed] [Google Scholar]
- 9.Green AR, Garibaldi JM, Soria D, Ambrogi F, Ball G, Lisboa PJG, et al. Identification and definition of novel clinical phenotypes of breast cancer through consensus derived from automated clustering methods. Breast Cancer Research. 2008;vol. 10:S36–S36. [Google Scholar]
- 10.Das SK, Chen SF, Deasy JO, Zhou SM, Yin FF, Marks LB. Combining multiple models to generate consensus: Application to radiation-induced pneumonitis prediction. Medical Physics. 2008 Nov;vol. 35:5098–5109. doi: 10.1118/1.2996012. [DOI] [PMC free article] [PubMed] [Google Scholar]
- 11.Witten IH, Frank E. Data Mining: practical machine learning tools and techniques. 2nd edition. San Francisco: Morgan Kaufmann; 2005. pp. 161–175.pp. 189–199. [Google Scholar]
- 12.Friedman N, Geiger D, Goldszmidt M. Bayesian network classifiers. Machine Learning. 1997 Nov–Dec;vol. 29:131–163. [Google Scholar]
- 13.Boser BE, Guyon IM, Vapnik VN. A training algorithm for optimal margin classifiers. 5th Annual ACM Workshop on COLT; Pittsburgh, PA. 1992. pp. 144–152. [Google Scholar]
- 14.Moavenian M, Khorrami H. A qualitative comparison of artificial neural networks and support vector machines in ECG arrhythmias classification. Expert system with application. 2009;vol. 37:3088–3093. [Google Scholar]
- 15.Zafiropoulos E, Maglogiannis I, Anagnostopoulos I. A Support Vector Machine Approach to Breast Cancer Diagnosis and Prognosis. Artificial Intelligence Application and Innovations. 2006;vol. 204:500–507. [Google Scholar]
- 16.Hall M, Frank E, Holmes G, Pfahringer B, Reutemann P, Witten IH. The WEKA data mining software: an update. SIGKDD Explorations. 2009;vol. 11 [Google Scholar]
- 17.Quinlan J. C4.5 Programs for machine learning. Los Altos, California: Morgan Kaufmann; 1993. ch. 2. [Google Scholar]
- 18.Guyon I, Weston J, Barnhill S, Vapnik V. Gene selection for cancer classification using support vector machines. Machine Learning. 2002;vol. 46:389–422. [Google Scholar]


