Abstract
The nature of light as an electromagnetic wave with transverse components has been confirmed using optical polarizers, which are sensitive to the orientation of the electric field. Recent advances in nanoscale optical technologies demand their magnetic counterpart, which can sense the orientation of the optical magnetic field. Here we report that subwavelength metallic apertures on infinite plane predominantly sense the magnetic field of light, establishing the orientation of the magnetic component of light as a separate entity from its electric counterpart. A subwavelength aperture combined with a tapered optical fibre probe can also serve as a nanoscale polarization analyser for the optical magnetic field, analogous to a nanoparticle sensing the local electric polarization. As proof of its functionality, we demonstrate the measurement of a magnetic field orientation that is parallel to the electric field, as well as a circularly polarized magnetic field in the presence of a linearly polarized electric field.
 Determining the direction of the magnetic field of light is important for optical applications. Here, scattering of light from a subwavelength aperture in a metal plane is shown to be governed by its magnetic vector, providing the magnetic field orientation independently of the electric field.
The orientation of the electric field has been considered as the light vector ever since Wiener's classic experiments in 1890 showed that the electric field of light initiates photochemical reactions on a photographic film1,2. The electric field direction of light can be sensed by existing polarizers and the electric field alone has been sufficient to describe the polarization of optical fields, as electric and magnetic fields are usually perpendicular and equal in strength in free space (Gaussian units). On the other hand, for optical fields close to charges and current sources in the quasistatic limit involving evanescent wavevector components, electric and magnetic fields are neither perpendicular nor equal in strength to each other. In these quasistatic cases, which are characteristic of optical fields on nanometre length scales, a magnetic field orientation as a separate entity from its electric counterpart is required for a complete description of the local optical field. The concept of magnetic field polarization is particularly relevant, as recent advances in optical technologies such as plasmonics3,4,5,6, negative index metamaterials7,8,9,10,11, artificial structures with large magnetic dipole moments12,13, optical antennas and circuits14 and subwavelength optics15,16,17,18,19,20,21,22,23,24,25,26,27 have revived the idea that the magnetic field of light is an equally important component of the light vector.
Detection of the optical magnetic field, using a subwavelength aperture15,16,17,18, on metallic probes, has been achieved. An alternative method is to perform a curl operation on the measured electric field20,21,22 to deduce the magnetic field. It has also been shown that a subwavelength aperture on metallic probe tip can induce the magnetic interaction with photonic crystal nanocavity28. However, a direct method for determining the unknown magnetic field orientation is yet to be achieved; we need a magnetic polarizer at the optical frequency.
Here we show that a metallic circular nanoscale aperture is a magnetic scatterer in complete agreement with Bethe's theoretical analysis on diffraction by a circular aperture29, allowing the magnetic field direction to be determined, independent of the electric field direction. This structure is, therefore, a device that functions as a polarization analyser for the magnetic field component of light. We demonstrate that a circular aperture on a flat-bottomed metallic tip is also a polarization analyser for the optical magnetic field, which we use to identify an unusual polarization configuration at which the local magnetic and electric field components of light are parallel to each other, made possible by the interference of two counter-propagating plane waves with orthogonal polarizations.
Results
Bethe's single hole determines magnetic field orientation
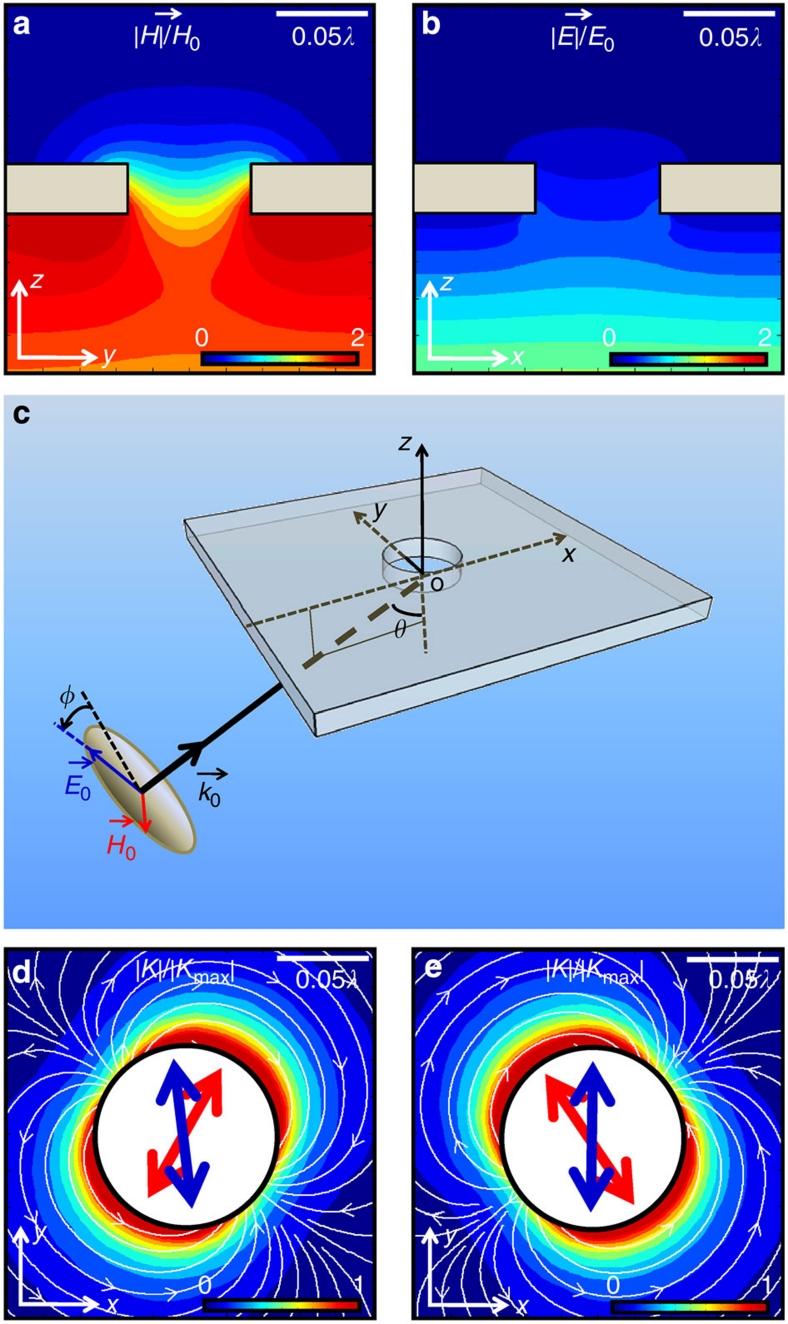
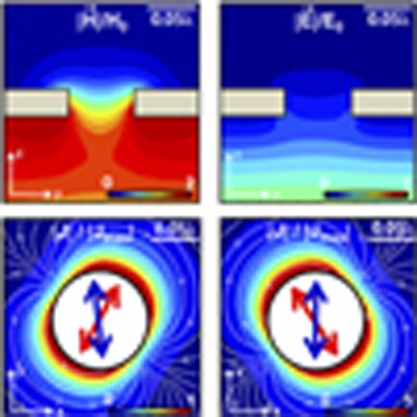
Time-varying magnetic fields induce Eddy currents in metals, which is the principle behind induction heating and welding, as well as metal detection. When light is incident on a subwavelength aperture in a metallic film with a large dielectric constant, the small size of the aperture and the large dielectric constant of the metal result in strong evanescent fields in this quasistatic regime. The tangential magnetic field enters the subwavelength hole with a certain distortion (Fig. 1a), with its amplitude at the centre of the aperture equal to that of the incident field. In contrast, the tangential electric field is primarily reflected, its influence being much weaker on both sides of the plane and inside the hole (Fig. 1b). Therefore, the scattering properties of an aperture in a metal film are mainly determined by the incident magnetic field-inducing surface currents, which in turn function as a source for far-field radiation29,30. It should be noted that the magnetic field-dominated scattering process is generally possible with non-circular apertures, but for the present study, a circular hole has been chosen for clarity31.
Figure 1. Calculated field and current distributions around a subwavelength hole.
The metal film has been assumed to be a near-perfect electric conductor with a hole diameter of 0.08λ and a thickness of 0.02λ. (a,b) Normalized electric and magnetic field strength distribution with the normal incidence (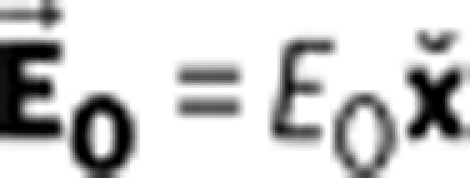 ,
,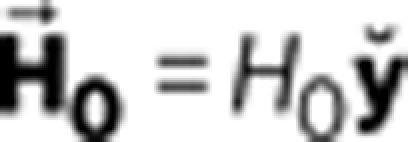 ), respectively. (c) Schematic of setup with an oblique incidence (θ≠0°)
  in the xz plane, with the polarization angle φ. (d,e) Surface current distribution on the exit side of the hole for φ=21° and 159° with fixed θ of 80°, respectively.
 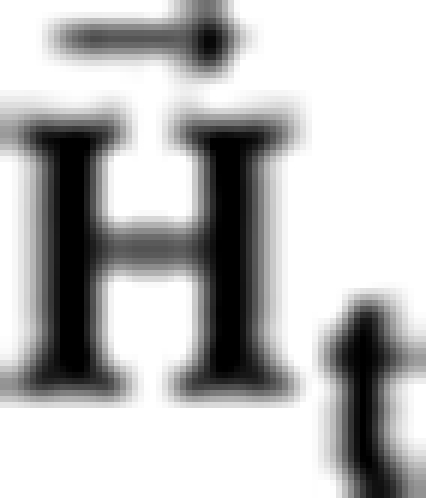 and
and 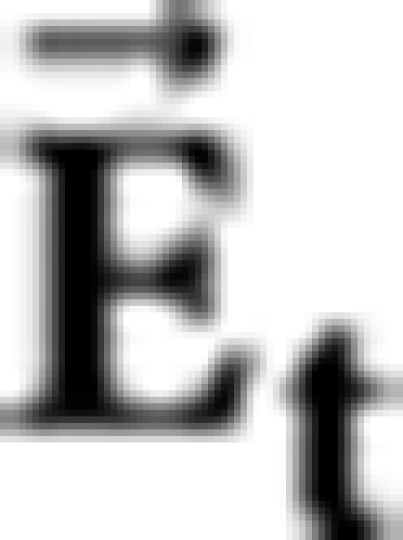 are depicted as red and blue arrows inside the hole, respectively. The white arrows represent the direction of the surface current.
The best way to separate the effects of electric and magnetic fields on this metallic aperture is to probe the structure with light at oblique incidence angles, having an asymmetric polarization that is neither purely transverse electric (TE, φ=0°) nor transverse magnetic (TM, φ=90°), where φ is the polarization angle (Fig. 1c). We consider a detector placed along the z axis and hence insensitive to the normal field components. In this case, the incident electric and magnetic fields projected onto the reflecting plane,  and
and  are, in general, not orthogonal, which creates an ideal situation to discriminate the electric and magnetic nature of the scattering.
In Figure 1d,e, finite-difference-time-domain (FDTD) calculations of surface currents on the scattering side of the structure, for the case of an oblique incident angle (θ=80°) with φ=21° and 159°, respectively, are shown, with  and
and  depicted by blue and red arrows, respectively. For both the cases, the surface current
  profile is aligned perpendicular to the tangential magnetic field, with the incident electric field direction seemingly irrelevant. Continuously changing the electric field direction while maintaining a constant magnetic field direction can be achieved by varying the wavevector of the incident light with almost no effect on the surface current distribution. These observations strongly suggest that the surface currents on the scattering side of the structure are of an induced nature, with its symmetric axis determined by the incident magnetic field
  , where ñ is the unit vector normal to the plane, in our case
  .
.
With the surface current profile on the scattering side determined primarily by the incident magnetic field, the far-field radiation polarization also reflects the magnetic field direction, at least for the above example of a nearly perfect conductor. As its far-field polarization is invariant with respect to changes in the incident electric field direction because of the negligible tangential electric field on the metal surface, the subwavelength aperture, when combined with far-field polarization analysis, senses the orientation of magnetic vector field. The incident magnetic field direction can be obtained simply by rotating the polarization of the scattered light by 90°. The critical question is whether the surface current profile and radiation polarization of the aperture would still be determined primarily by the incident optical frequency magnetic field in which the metal has less-than-ideal metal conductivities, and when the aperture is larger than the pure quasistatic regime analysed here.
Experimental realization of Bethe's magnetic analyser
To find out whether a subwavelength hole of these more easily realizable dimensions and materials can still sense the orientation of magnetic vector field, we experimentally investigate the scattering of 780 nm wavelength light by an 80 nm diameter circular aperture in an 80 nm thick gold film deposited on a sapphire substrate. Our strategy to assess the magnetic functionality of the hole relies on identifying the effects of  and
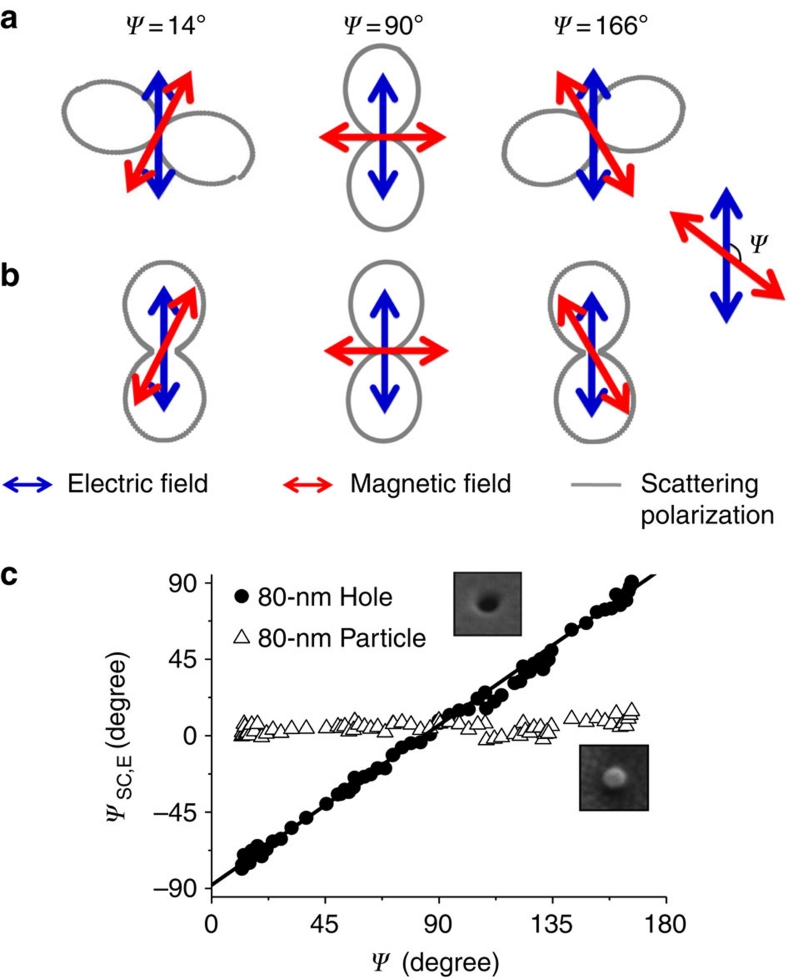
and  on the scattering polarization. Figure 2a shows the polarization analysis of the scattered light on the surface normal direction (z axis), for three different angles ψ between
  and
and  . The surface normal scattering angle for the detector is chosen so as to ignore the radiation by z axis dipoles. Strikingly, the scattered polarization is not along
  , but is perpendicular to
  , with <5° of deviation. For comparison, we also measure scattering from an 80 nm diameter gold nanoparticle (Fig. 2b). For the nanoparticle, a completely opposite behaviour relative to the subwavelength hole is observed with the polarization of scattered light following
  alone, essentially independent of the optical frequency magnetic field.
Figure 2. Scattering polarization from an aperture and a particle.
Measured (λ=780 nm) scattering polarization from an 80-nm aperture and an 80-nm gold nanoparticle. (a) Polar plot (grey) of the scattering polarization for the aperture, and (b) for the nanoparticle with the chosen relative angles (ψ=14°, 90°, 166°) of  (red) measured from
  (blue). (c) The scattering polarization (measured from
  , ψsc, E) versus ψ for the aperture (filled circles) and for the particle (open triangles).
To confirm that a single hole combined with far-field polarization analysis is indeed a polarization analyser for optical magnetic vector field, we continuously vary ψ, by changing both θ and φ, and analyse the scattered polarization (details provided in the Methods section). Plotted in Figure 2c, in which the direction of  is defined as 0°, the measured scattering polarization angle ψsc, E follows that of
  , with a slope of 0.997±0.005 (filled circles). Indeed, the polarization of
  can simply be determined by rotating the measured polarization by 90°, irrespective of
  . In stark contrast, the nanoparticle (open triangles), showing essentially a zero slope versus magnetic field orientation change, behaves as an electric field analyser20,22,32,33, sensitive to only the orientation of electric field. Our results show that from the normal angle scattering off a subwavelength circular aperture, the incident magnetic field can be determined simply by
  , where
 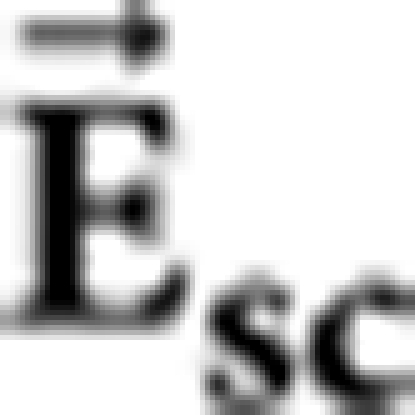 is the scattered electric field from the hole. It should be noted that as the size of the hole becomes larger, the scattered polarization begins to align more and more towards
  , eventually becoming consistent with the prediction of the vector Kirchhoff formalism (see Supplementary Information).
Flat-bottom NSOM probe for determining magnetic field orientation
With a realistic subwavelength aperture on an infinite metal plane behaving as a nanoscale polarization analyser for optical magnetic field, it logically follows to ask whether a circular aperture on a finite-size plane also shows this same behaviour. Recently, it has been shown theoretically that for a certain class of subwavelength optics problems, only a zone of the size ∼λ/2 (lambda zone) contributes to the scattering, with zones external to this volume contributing negligibly34. This raises the intriguing possibility that a flat region of a size ∼λ/2 surrounding at circular aperture of a metal-coated near-field optical scanning microscopy (NSOM) tip may be sufficient for magnetic functionality, for a straightforward integration of this concept into the existing NSOM technology.
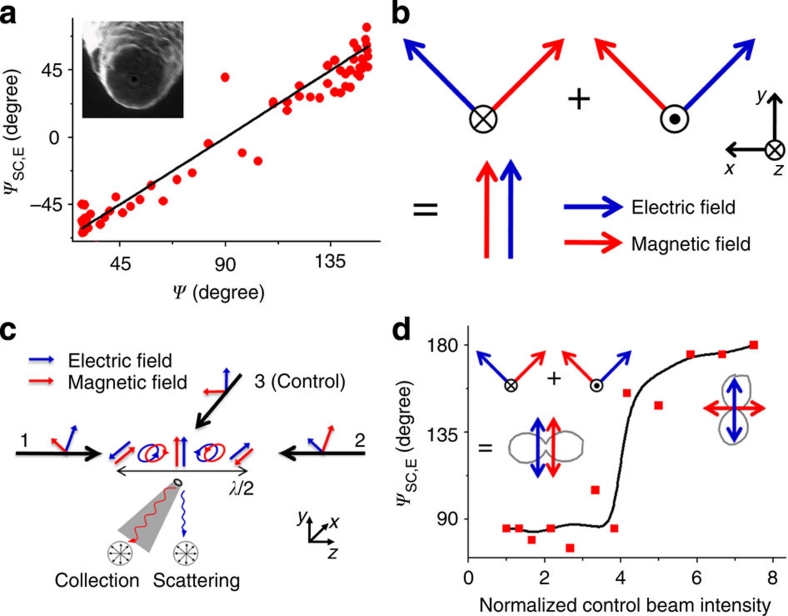
Shown in Figure 3a (inset) is an NSOM probe with a flat apex of about 0.6λ surrounding a circular aperture of size 0.1λ (λ=780 nm), made by focused ion beam milling of an aluminium-coated, etched optical fibre. Figure 3a shows the collection signal polarization ψsc, E versus ψ, showing a slope of unity, clearly demonstrating that an NSOM probe with a sufficiently large and flat metallic end facet is indeed an analyser for the tangential magnetic field direction. We note that the geometry of the probe apex is crucial in determining which component of light is measured through the probe. Tangential electric or vertical magnetic field15,16,17 may be predominantly measured using a metal-coated fibre probe, depending on the shape of the probe apex, such as the precise fraction of flat area on the probe tip; it is noted that an NSOM probe with a circular aperture-sensing vertical magnetic field would produce an unpolarized/circularly polarized light, which is not the case for our tip.
Figure 3. Measuring parallel electric and magnetic fields.
Measurements (λ=780 nm) of parallel electric and magnetic field polarizations for the demonstration of the magnetic field orientation as an independent entity. (a) The angle of polarization ψsc, E for the collection signal from a flat-bottomed near-field optical scanning microscopy (NSOM) probe plotted against ψ, showing that this probe is a magnetic field analyser. (b) Schematic for the generation of parallel electromagnetic fields using two counter-propagating, orthogonally polarized light. (c) Experimental schematic for the generation and measurement of parallel electromagnetic fields. Polarization on the probe aperture is controlled by applying an additional phase to beam 1. The collection signal is analysed by a linear polarizer in front of the detector. (d) Experimental control of magnetic field orientation by tuning the intensity of the control beam 3. Polar plots of the representative collection signal (grey) are shown in the inset, showing transition from the parallel electric and magnetic fields case to the normal case of perpendicular electric and magnetic fields.
Measurements of a magnetic field parallel to the electric field
A definitive proof of this nanomagnetic field polarization analyser functionality is to test its ability to discern a situation where the electric and magnetic fields of light are aligned in parallel. Another test would be to have a situation with a linear polarized electric field and a circularly polarized magnetic field. These two electromagnetic field configurations can be realized simply by interfering two counter-propagating and two orthogonally propagating beams, respectively. To measure the electric and magnetic field polarizations at a given position on the nanometre scale, two different detection channels of an NSOM probe are used: the orientation of magnetic vector field is determined by the collection signal through an aperture of the probe, whereas the electric polarization is determined by the electric dipole scattering at the apex of the probe22,32,33. Orientations of the electric and the magnetic field are determined by linear polarizers positioned in front of the scattering and collection mode detectors, respectively32.
We first create mutually parallel local electric and magnetic fields by interfering two counter-propagating beams with orthogonal polarizations (wavelength=780 nm; beams 1 and 2) as shown in Figure 3b. The mathematical expression of the electric and magnetic fields are given by
 |
,
 |
, respectively. k0 is defined as the wavevector, and ϕ is defined as the relative phase between beams 1 and 2. By controlling ϕ (k0z+ϕ/2=0 or π), positions at which the electric and magnetic fields are both linearly polarized as well as parallel to each other are created. As shown in Figure 3c, by measuring the polarization resolved collection and scattering signals from an NSOM probe35, we identify the position at which the electric field is along the y axis (vertical) where the magnetic field is expected to be parallel to the electric field. Indeed, the magnetic field direction obtained by the collection NSOM is parallel to the electric field (Fig. 3d, left side inset). Next, we use a control beam (beam 3), gradually increasing its intensity to restore the normal situation where the electric and magnetic fields are perpendicular to each other (Fig. 3d, right side inset). Our polarization measurements directly show this switching from the unusual situation of parallel electric and magnetic field components to the normal situation of perpendicular field components.
Circularly polarized magnetic and linearly polarized electric fields
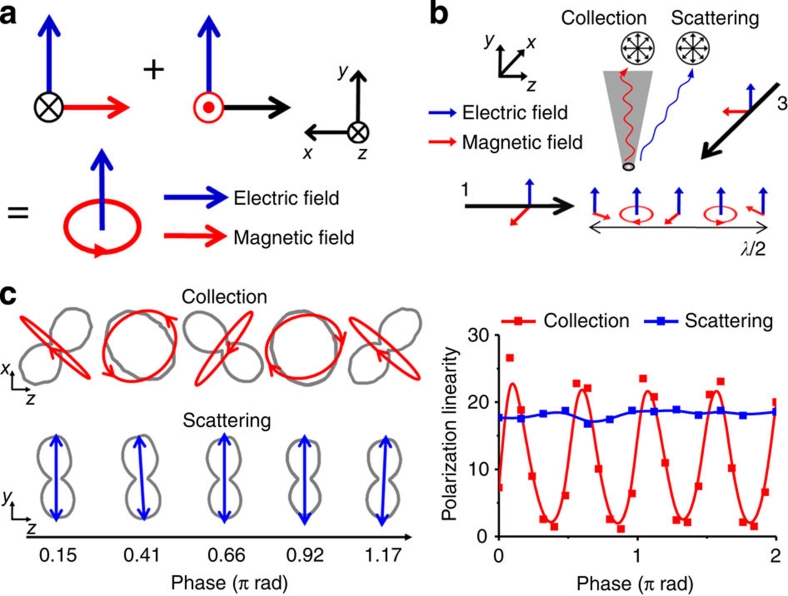
Second, by interfering orthogonally propagating, co-(electrically) polarized beams (beams 1 and 3; wavelength=780 nm), we create a linearly polarized electric field together with a circularly polarized magnetic field (Fig. 4a). The mathematical expressions for the electric and magnetic fields along the z axis are given by  ,
,  , respectively. By varying the relative phase between the two orthogonally propagating beams, the magnetic field is expected to switch between linear (k0z+ϕ′=0 or π) and circular polarizations (k0z+ϕ′=π/2 or 3π/2), whereas the electric field polarization is fixed along the y axis (Fig. 4b). Indeed, although the scattering signal of the electric field remains essentially linear (blue squares, Fig. 4c right inset), the collection signal of the magnetic field (red squares, Fig. 4c right inset) shows a strong modulation in the polarization linearity, defined as the intensity of the major axis polarization divided by that of the minor axis polarization. Ellipsometric experiments36 demonstrate that the orientation of magnetic field undergoes a transformation between essentially linear, right-handed and left-handed circularly polarized states with this phase change (Fig. 4c).
Figure 4. Measuring linearly polarized electric and circularly polarized magnetic fields.
(a) Schematic for the generation of linearly polarized electric and circularly polarized magnetic fields using two orthogonally propagating light (λ=780 nm). (b) Experimental schematic for the generation and measurement of circularly polarized magnetic field along with linearly polarized electric field. (c) Polar plots for the collection (up) and scattering (down) mode signals. Magnetic field orientation (red) is obtained from the collection near-field optical scanning microscopy (NSOM) signal, via 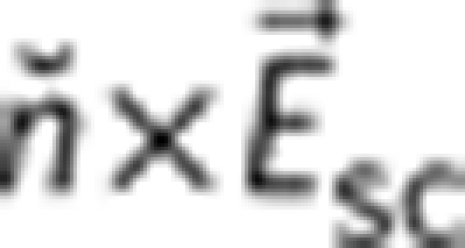 , showing alternation between circularly polarized states and linearly/highly elliptically polarized states. Electric field polarization (blue) remains fixed along the y axis. Phase-dependent polarization linearity for the scattering and collection signal, in which the polarization linearity is defined as the intensity ratio of major axis polarization and minor axis polarization (right inset).
Discussion
To understand why a single subwavelength aperture functions as a Babinet analogue37 of a nanoparticle, despite the fact that the conductivity at optical frequencies is very low and that the aperture is only partially subwavelength, we invoke the Leontovich boundary condition38. Although metals are much poorer conductors in the optical regime than at microwave frequencies, gold and aluminium at near-infrared and visible frequencies still satisfy another condition for a reasonably good metal: δ;≪λ, with the skin depth δ in the order of 10–20 nm. Under this condition, the surface electric field and surface current are primarily determined by the surface magnetic field, and therefore the incident magnetic field:  , where ɛ is the dielectric constant of the metal. This is reflected on the scattering side of the subwavelength aperture, enabling it to sense the orientation of magnetic vector field. As the wavelength becomes shorter and |ɛ| gets smaller, the Leontovich boundary condition no longer holds, and the subwavelength aperture would lose its functionality (Supplementary Methods); the error would be of the order of 1/|ɛ|. If strong electric dipole sources such as fluorescing quantum dots39,40 or molecules41,42 would exist inside the aperture, the Leontovich boundary condition again would no longer hold and the magnetic functionality would be lost.
To conclude, we have shown that normal-angle scattering from a subwavelength aperture in a metal plane is governed by the magnetic field component of light, establishing the aperture as a polarization analyser for magnetic vector field. Magnetic field polarization as an independent physical reality, apart from the electric field polarization, is important when more than one wave vector is present: metamaterials provide specific examples of this, where the magnetic and electric field components are generally neither perpendicular to each other nor equal in strength. This work provides a unique, new optical component for the study of ultrahigh frequency magnetism in metamaterials and other high permittivity materials.
Methods
Simulation methods
Our 3D-FDTD analysis assumed a near perfect electric conductor metal film (ɛ=−5,000+5,000i) with an aperture of 0.08λ diameter punctured in a metal film thickness of 0.02λ. A minimum grid size of λ/400 was used after confirming the convergence of the solution as a function of grid resolution. The grid size was gradually increased to λ/20, as the region of interest moved to the far-field region, devoid of any metal structure. For the incident source, a 5λ×5λ-plane wave source was used. Perfectly matched layers of negligible reflectance were also used on the boundary.
The surface current density (K) distribution on the exit side of the metallic surface was extracted from FDTD-calculated tangential electric field on the metal–surface boundary, following the relation 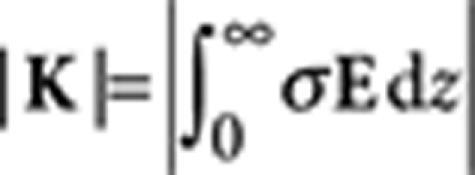 , where σ is conductivity of metal.
Experimental data analysis
The functionality of the subwavelength aperture as the polarization analyser for optical magnetic field is demonstrated when the effects of electric and magnetic fields on the scattering polarization are identified and compared with a gold nanoparticle.
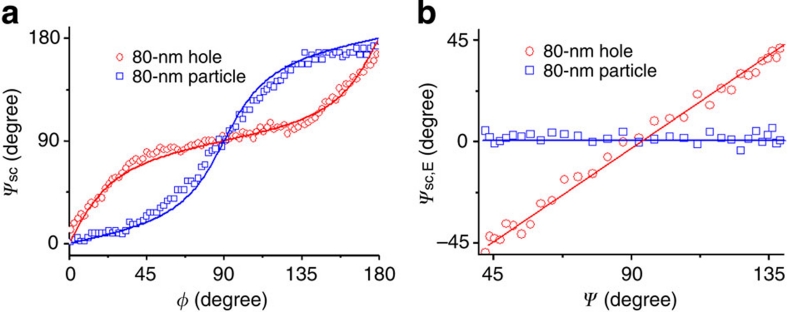
Following the notations of the experimental schematic depicted in Figure 1c, the scattering polarization (ψsc, angle between  and x̓) for the hole and for the gold nanoparticle as a function of incident polarization (φ), are experimentally measured as shown in Figure 5a. The diameters of the hole and particle are both 80 nm, and the incident angle θ is fixed at 70°.
Figure 5. Scattering polarizations of a nanohole and a nanoparticle.
The scattering polarizations of a nanohole and a nanoparticle are found to follow magnetic field and electric field orientations respectively. (a) Experimentally (λ=780 nm) measured scattering polarization (ψsc) of an 80 nm diameter gold nanoparticle (open blue square) and an 80 nm diameter hole punctured on an 80 nm thick gold film (open red circle). The lines denote fits assuming electric and magnetic dipolar radiations, respectively. (b) Scattering polarization measured from the tangential electric field, ψsc, E is plotted as a function of ψ. Red and blue lines are linear curves with slope of one and zero, respectively.
We first note that the relative angle ψ between  and
and  can be expressed as,
 |
1 |
Then, we obtain the other relative angle ψsc, E between  and
and  from the experimentally measured scattering polarization angle ψsc. The plot of ψsc, E versus ψ in Figure 5b shows that the scattering angle follows the orientation of
  with an offset of ∼90° for the hole, whereas the scattering angle by the nanoparticle is fixed along
  , regardless of the
  orientation.
Author contributions
D.S.K. had the original idea. D.S.K. and H.W.K. designed the experiment. H.W.K., Q.H.K., J.E.K., W.S.B. and S.H.E. performed experiments and analysed the data. S.M.K. and K.B. performed the FDTD calculations. D.S.K., C.L., P.N., N.J.H., N.K.P., H.K. and H.W.K. wrote the paper. All authors discussed the results and commented on the manuscript.
Additional information
How to cite this article: Kihm, H. W. et al. Bethe-hole polarization analyser for the magnetic vector of light. Nat. Commun. 2:451 doi: 10.1038/ncomms1430 (2011).
Supplementary Material
Supplementary Figure S1 and Supplementary Methods.
Acknowledgments
This work was supported by the National Research Foundation of Korea (NRF) grant funded by the Korea government (MEST) (SRC, No. R11-2008-095-01000-0) (No. 2010-0029648), KICOS (GRL, K20815000003), Hi Seoul Science/Humanities Fellowship, and the Deutsche Forschungsgemeinschaft (SPP 1391).
References
- Wiener O. Stehende lichtwellen und die schwingungrichtung polarisirten lichtes. Ann. Phys. Chem. 40, 203–243 (1890). [Google Scholar]
- Jenkins F. & White H. Fundamentals of Optics 4th edn (McGraw-Hill, 1957). [Google Scholar]
- Ebbesen T. W., Lezec H. J., Ghaemi H. F., Thio T. & Wolff P. A. Extraordinary optical transmission through subwavelength hole arrays. Nature 391, 667–669 (1998). [Google Scholar]
- Liu H. & Lalanne P. Microscopic theory of the extraordinary optical transmission. Nature 452, 728–731 (2008). [DOI] [PubMed] [Google Scholar]
- Bergman D. J. & Stockman M. I. Surface plasmon amplification by stimulated emission of radiation: quantum generation of coherent surface plasmons in nanosystems. Phys. Rev. Lett. 90, 027402 (2003). [DOI] [PubMed] [Google Scholar]
- Gompf B., Braun J., Weiss T., Giessen H., Dressel M. & Hübner U Periodic nanostructures: spatial dispersion mimics chirality. Phys. Rev. Lett. 106, 185501 (2011). [DOI] [PubMed] [Google Scholar]
- Smith D. R., Pendry J. B. & Wiltshire M. C. K. Metamaterials and negative refractive index. Science 305, 788–792 (2004). [DOI] [PubMed] [Google Scholar]
- Shelby R. A., Smith D. R. & Schultz S. Experimental verification of a negative index of refraction. Science 292, 77 (2001). [DOI] [PubMed] [Google Scholar]
- Shalaev V. M. Optical negative-index metamaterials. Nat. Photon. 1, 41 (2007). [Google Scholar]
- Zhang X. & Liu Z. W. Superlenses to overcome the diffraction limit. Nat. Mater. 7, 435 (2008). [DOI] [PubMed] [Google Scholar]
- Soukoulis C. M., Linden S. & Wegener M. Negative refractive index at optical wavelengths. Science 315, 47 (2007). [DOI] [PubMed] [Google Scholar]
- Mirin N. A. & Halas N. J. Light-bending nanoparticles. Nano Lett. 9, 1255 (2009). [DOI] [PubMed] [Google Scholar]
- Fan J. A. et al. Self-assembled plasmonic nanoparticle clusters. Science 328, 1135 (2010). [DOI] [PubMed] [Google Scholar]
- Alù A. & Engheta N. Tuning the scattering response of optical nanoantennas with nanocircuit loads. Nat. Photon. 2, 307 (2008). [Google Scholar]
- Burresi M. et al. Probing the magnetic field of light at optical frequencies. Science 326, 550 (2009). [DOI] [PubMed] [Google Scholar]
- Devaux E. et al. Local detection of the optical magnetic field in the near zone of dielectric samples. Phys. Rev. B. 62, 10504 (2000). [Google Scholar]
- Girard C. et al. Optical magnetic near-field intensities around nanometer-scale surface structures. Phys. Rev. B 55, 16487 (1997). [Google Scholar]
- Rhodes S. K., Nugent K. A. & Roberts A. Precision measurement of the electromagnetic fields in the focal region of a high-numerical aperture lens using a tapered fiber probe. J. Opt. Soc. Am. A 19, 1689 (2002). [DOI] [PubMed] [Google Scholar]
- Merlin R. Metamaterial and the Landau-Lifshitz permeability argument: large permittivity begets high-frequency magnetism. Proc. Natl Acad. Sci. USA 106, 1693 (2009). [DOI] [PMC free article] [PubMed] [Google Scholar]
- Seo M. A. et al. Fourier-transform terahertz near-field imaging of one-dimensional slit arrays: mapping of electric-field-, magnetic-field-, and Poynting vectors. Opt. Express 15, 11781 (2007). [DOI] [PubMed] [Google Scholar]
- Bitzer A. & Walther M. Terahertz near-field imaging of metallic subwavelength holes and hole arrays. Appl. Phys. Lett. 92, 231101 (2008). [Google Scholar]
- Olmon R. L. et al. Determination of electric field, magnetic field, and electric current distributions of infrared optical antennas: a nano-optical vector network analyzer. Phys. Rev. Lett. 105, 167403 (2010). [DOI] [PubMed] [Google Scholar]
- Schnell M. et al. Controlling the near-field oscillations of loaded plasmonic nanoantennas. Nat. Photon. 3, 287 (2009). [Google Scholar]
- Novotny L., Pohl D. W. & Regli P. Light propagation through nanometer-sized structures: the two-dimensional-aperture scanning near-field optical microscope. J. Opt. Soc. Am. A. 11, 1768 (1994). [Google Scholar]
- Obermueller C. & Karrai K. Far-field characterization of diffracting circular apertures. Appl. Phys. Lett. 67, 3408 (1995). [Google Scholar]
- Drezet A., Woehl J. C. & Huant S. Diffraction by a small aperture in conical geometry: application to metal-coated tips used in near-field scanning optical microscopy. Phys. Rev. E. 65, 046611–046618 (2002). [DOI] [PubMed] [Google Scholar]
- Degiron A., Lezec H., Yamamoto N. & Ebbesen T. W. Optical transmission properties of a single subwavelength aperture in a real metal. Opt. Comm. 239, 61 (2004). [Google Scholar]
- Burresi M Magnetic light-matter interactions in a photonic crystal nanocavity. Phys. Rev. Lett. 105, 123901 (2010). [DOI] [PubMed] [Google Scholar]
- Bethe H. A. Theory of diffraction by small holes. Phys. Rev. 66, 163 (1944). [Google Scholar]
- Jackson J. D. Classical Electrodynamics. 3rd edn (John Wiley & Sons Inc, 1999). [Google Scholar]
- Nikitin A.Yu., Zueco D., Garcia-Vidal F. J. & Martin-Moreno L. Electromagnetic wave transmission through a small hole in a perfect electric conductor of finite thickness. Phys. Rev. B. 78, 165429 (2008). [Google Scholar]
- Lee K. G. et al. Vector field microscopic imaging of light. Nat. Photon. 1, 53–56 (2007). [Google Scholar]
- Kalkbrenner T., Hakanson U. & Sandoghdar V. Tomographic plasmon spectroscopy of a single gold nanoparticle. Nano Lett. 4, 2309–2314 (2004). [Google Scholar]
- Kang J. H., Kim D. S. & Park Q.- H. Local capacitor model for plasmonic electric field enhancement. Phys. Rev. Lett. 102, 093906 (2009). [DOI] [PubMed] [Google Scholar]
- Kihm H. W. et al. Control of surface plasmon generation efficiency by slit-width tuning. Appl. Phys. Lett. 92, 051115 (2008). [Google Scholar]
- Lee K. G. et al. Surface plasmon polariton detection discriminating the polarization reversal image dipole effects. Opt. Express 15, 14993 (2007). [DOI] [PubMed] [Google Scholar]
- Koo S. et al. Extraordinary magnetic field enhancement with metallic nanowire: Role of surface impedance in Babinet's principle for sub skin-depth regime. Phys. Rev. Lett. 103, 263901 (2009). [DOI] [PubMed] [Google Scholar]
- Leontovich M. A. Investigation of Propagation of Radio Waves, Part II, Soviet Union Academy of Sciences Publishing House, Russia (1948). [Google Scholar]
- Curto A. G., et al. Unidirectional emission of a quantum dot coupled to a nanoantenna. Science 329, 930 (2010). [DOI] [PubMed] [Google Scholar]
- Farahani J. N. et al. Single quantum dot coupled to a scanning optical antenna: a tunable superemitter. Phys. Rev. Lett. 95, 017402 (2005). [DOI] [PubMed] [Google Scholar]
- Maier S. A. et al. Local detection of electromagnetic energy transport below the diffraction limit in metal nanoparticle plasmon waveguide. Nat. Mat. 2, 229 (2003). [DOI] [PubMed] [Google Scholar]
- Betzig E. & Chichester R. J. Single molecules observed by near-field scanning optical miscroscopy. Science 262, 1422 (1993). [DOI] [PubMed] [Google Scholar]
Associated Data
This section collects any data citations, data availability statements, or supplementary materials included in this article.
Supplementary Materials
Supplementary Figure S1 and Supplementary Methods.


