Abstract
Multiple DNA repair pathways are involved in the orderly development of neural systems at distinct stages. The homologous recombination (HR) pathway is required to resolve stalled replication forks and critical for the proliferation of progenitor cells during neural development. BCCIP is a BRCA2 and CDKN1A interacting protein implicated in HR and inhibition of DNA replication stress. In this study, we determined the role of BCCIP in neural development using a conditional BCCIP knock-down mouse model. BCCIP deficiency impaired embryonic and postnatal neural development, causing severe ataxia, cerebral and cerebellar defects, and microcephaly. These development defects are associated with spontaneous DNA damage and subsequent cell death in the proliferative cell populations of the neural system during embryogenesis. With in vitro neural spheroid cultures, BCCIP deficiency impaired neural progenitor's self-renewal capability, and spontaneously activated p53. These data suggest that BCCIP and its anti-replication stress functions are essential for normal neural development by maintaining an orderly proliferation of neural progenitors.
Introduction
Deficiencies of distinct DNA repair pathways affect specific cell populations at different developmental stages, thus cause various degrees of neural degeneration and developmental disorders [1]–[3]. Early in development, when proliferation of progenitor cells is critical for neurogenesis, the homologous recombination (HR) machinery is crucial to ensure proper completion of DNA replication with high fidelity, thus an orderly development. Among post-mitotic cell populations, the non-homologous end joining (NHEJ) pathway may be critical to maintain genome stability and orderly differentiation. In the mature neural tissues when there is little cell proliferation or differentiation, accumulation of oxidative damage is a major obstacle for normal function. In this case, DNA repair pathways relieving oxidative damage (such as excision repair) are critical to prevent neurodegenerative syndromes [4], [5].
BCCIP was originally known as a BRCA2 and CDKN1A (Cip1/waf1/p21) interacting protein, and it plays a wide range of regulatory roles in the HR pathway, cytokinesis, and cell cycle regulation [6]–[16]. In addition, BCCIP may have functions in neurite growth, cell mobility, and nuclear and cytoplasmic shuttling [17]–[19]. Because the HR machinery is critical for neural development, we hypothesized that BCCIP plays a role in neural development. In this study, we found that BCCIP deficiency causes proliferation arrest among progenitor cells, leading to severe neurogenesis defects, including: microcephaly, ataxia, cerebral and cerebellar development disorders, and growth retardation. These observations suggest a key role of BCCIP in neural development.
Results
Establishment of a glial fibrillary acidic protein promoter driven (GFAP) Cre-mediated conditional BCCIP knockdown mice
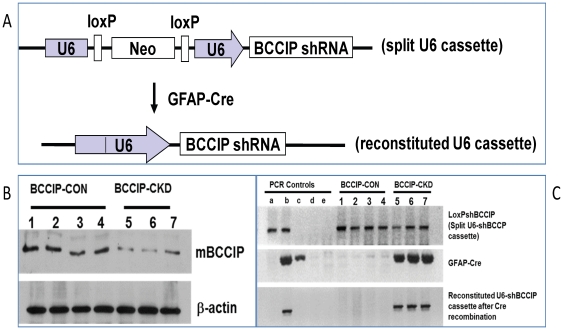
In humans, two major alternative splicing products of BCCIP (BCCIPα and BCCIPβ are expressed, with BCCIPβ being the main isoform. However, it appears that mouse tissues expressed only the BCCIPβ isoform. To investigate the functions of BCCIP in neurogenesis, we used a conditional BCCIP knockdown transgenic mouse line [16], designated LoxPshBCCIP. As briefly illustrated in Figure 1A, in this model, the expression of Cre-recombinase enables the expression of a short hairpin RNA against mouse BCCIP (shBCCIP). We crossed the LoxPshBCCIP mice with heterozygous GFAP-Cre+/− transgenic mice, which express the Cre recombinase under the control of the human glial fibrillary acidic protein promoter (GFAP) [20]. The GFAP promoter becomes active at around embryonic day 13.5 (E13.5) in multi-potential stem cells in multiple regions during embryogenesis, including neuron and glial progenitors [20]. However, in adult mice the GFAP-Cre recombinase is expressed mainly in glial cells [20]. After crossing LoxPshBCCIP+/+ with GFAP-Cre+/− transgenic mice, we obtained 67 mice with a 32∶35 ratio between LoxPshBCCIP+/−;GFAPCre−/− and LoxPshBCCIP+/−;GFAPCre+/− (hereafter referred as BCCIP-CON and BCCIP-CKD, respectively) among 7 liters. Effective BCCIP knockdown and Cre-mediated reconstitution of the functional U6 promoter in BCCIP-CKD mice was verified by Western blots of brain protein extracts (Figures 1B) and by genotyping on genomic DNA from brain extracts (Figure 1C).
Figure 1. GFAP-Cre mediated conditional knockdown of BCCIP.
(A) shows the strategy of LoxP-Cre mediated conditional expression of shRNA against mouse BCCIP gene. The U6 promoter is split and inactivated by the insertion of a LoxP-neo-LoxP fragment (upper panel). Upon expression of Cre-recombinase, the deletion of the Neo cassette between the LoxP sites reconstitutes a functional U6 promoter that drives the expression of the shRNA. (B) BCCIP protein levels from a representative litter of 7 mice resulting from breeding between LoxPshBCCIP+/+ and GFAP-Cre +/−. The brain tissues from 4 BCCIP-CON and 3 BCCIP-CKD mice at age P1 were used for DNA and protein extractions. Shown are Western blots of the brain protein extracts, and b-actin (loading control). (C) genotyping of the same litter of mice as panel B. The upper two panels are results from tail DNA to verify the presence of the split U6 promoter LoxPshBCCIP and the GFAP-Cre cassettes. The bottom panel is results verifying the reconstituted U6-shBCCIP cassette using DNA from the brain tissue of the mice. Five lanes (a, b, c, d, and e) of controls are also shown: a - DNA from the BCCIP-CON mice (LoxPshBCCIP +/−;GFAPCre −/−) ; b – DNA from a BCCIP-CKD mouse (LoxPshBCCIP +/−;GFAP-Cre +/−); c – DNA from a GFAPCre mouse; d - DNA from wild type mouse; and e - water as a negative PCR control. As shown here, all 7 (No. 1-7) littermates contain the original split U6 cassette in their tail DNA. But only the littermates (No. 5-7) with the GFAPCre cassette have reconstituted U6-shBCCIP cassette in the DNA extracted from brain tissues at P1.
Growth retardation, ataxia, and balance disorder of BCCIP-CKD mice
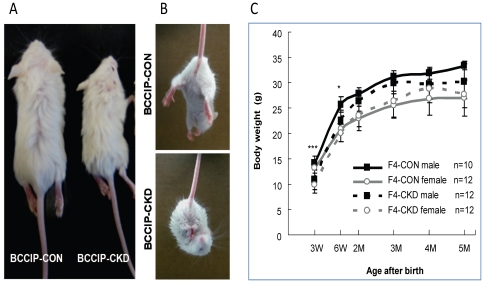
The BCCIP-CKD mice had similar body weight as their BCCIP-CON littermates at birth. However, postnatal growth delay of BCCIP-CKD mice became evident in the first few weeks. By weaning (age P21), the body weight of BCCIP-CKD mice reduced to ∼70% of the BCCIP-CON mice (Figures 2A). After age P14, all BCCIP-CKD mice displayed various degrees of walking disorders and unkempt coats, which are likely caused by poor motor coordination. All BCCIP-CKD mice show balance disorder, tremors, and akinesis. About 60% BCCIP-CKD mice had severe ataxia (see Supplement Movie S1), and could not pass the balance beam test at age P21. Because those symptoms implicate motor neuron defects, we assessed motor reflex by the hind-limb extension test. In this test, an extension reflex of the hind-limbs (Figure 2B, top panel) can be observed when a normal mouse is suspended by its tail. When BCCIP-CKD mice were suspended by its tail, 80% of BCCIP-CKD mice displayed hind-limb retraction in a crossed posture (Figure 2B, bottom panel).
Figure 2. Growth retardation, ataxia, and motor reflex defects in BCCIP-CKD mice.
(A) shows a representative pair of littermates at age P21. (B) shows a typical motor reflex response by control (top panel) and BCCIP knockdown mice (bottom panel) at age P21. (C) The body weight of control (BCCIP-CON) and knockdown (BCCIP-CKD) mice were measured at various ages. Shown are averages (+/− standard deviation) of male and female mice at different ages. The n-values represent the numbers of the mice at each age. *: p<0.05; **: P<0.01; ***: P<0.001.
The BCCIP-CKD mice did not show a significantly shorter lifespan compared with BCCIP-CON mice. While most of the ataxic symptoms among BCCIP-CKD mice persist between the ages of P14 and P28, which is the time period critical for the development of motor neurons and dendritic growth in the cerebellum, we noticed a gradual relief of the severe ataxic symptoms after age P42. By age P56, the severe ataxic symptoms were not noticeable, although the BCCIP-CKD still failed the balance beam test throughout their life. Coincidental with the relief of ataxia symptom around age p28, the BCCIP-CKD mice began to gain weight. After P56, the BCCIP-CKD mice body weight was similar to that of the BCCIP-CON mice (Figure 2C).
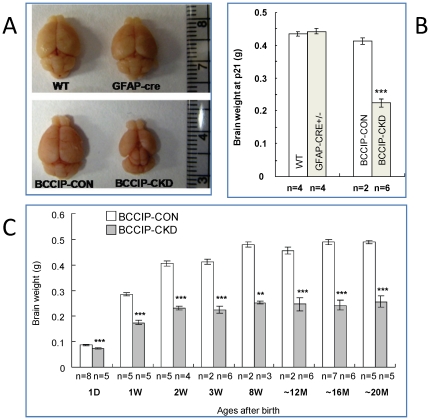
To elucidate the cause of these abnormalities among BCCIP-CKD mice, we surveyed gross brain development. At postnatal day 21 (P21), the brain weight of BCCIP-CKD mice was significantly reduced compared to littermate BCCIP-CON mice, GFAP-Cre mice, and wild type mice (Figures 3A and 3B). The reduction in brain size of BCCIP-CKD mice was observed as early as postnatal day 1 (P1), and throughout adulthood it remained at approximately 50% of the littermate control brain after postnatal day 14 (P14) (Figure 3C). In contrast, a relatively mild difference was observed on body weight (Figure 2C). The affected regions in BCCIP-CKD brain include both cerebrum and cerebellum (Figure 3A).
Figure 3. GFAP-Cre mediated conditional knockdown of BCCIP causes microcephaly.
(A) a representative set of brains from wild type (WT), GFAP-Cre, BCCIP-CON, and BCCIP-CKD mice at P21, illustrating the reduced cerebrum and cerebellum in the BCCIP-CKD mice. (B) the brain weight of wild type (WT), GFAP-Cre, BCCIP-CON and BCCIP-CKD mice at age P21. (C) brain weight of BCCIP-CON (white bar) and BCCIP-CKD (gray bar) mice at various ages, ranging from day 1 (1D) to approximately 18 months. Asterisks indicate the statistic significance between BCCIP-CON and BCCIP-CKD of the same age (*: P<0.05; **: P<0.01; ***: P<0.001). The “n” values indicate the number of mice measured at the time point. D: day; W: week; and M: month.
Widespread defects in neurogenesis among BCCIP deficient mice
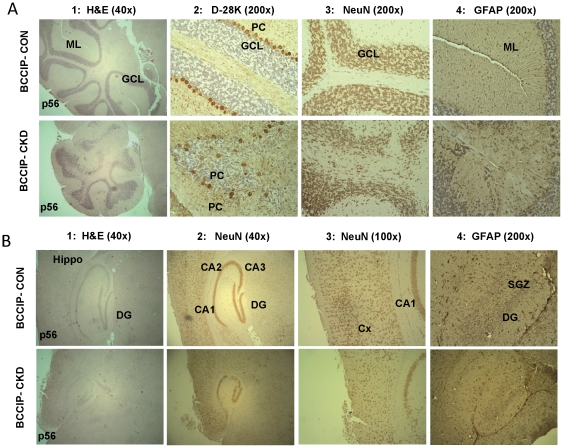
Between embryonic day 10 (E10) to postnatal day 2 (P2), various regions of the mouse brain, including the cerebral cortex, the midbrain, and the cerebellum, undergo rapid expansion [21]. The hGFAP promoter actively drives expression of the Cre recombinase at around E13.5 in multi-potential neural stem cell in the afore-mentioned regions [20]. To understand the cause of microcephaly, we performed histological analyses on cerebellum and cerebrum regions. In the cerebellum of BCCIP-CKD mice, we found an agenesis in foliation and lobule structure (Figure 4A). The BCCIP-CKD cerebellum displayed reduced granule cell number, disrupted granule cell layers, and abnormal lining pattern of Purkinje cells (Figure 4A). Furthermore, reduced number of Bergmann glial cells was also observed in BCCIP-CKD cerebellum (Figure 4A). In the cerebrum of BCCIP-CKD mice, despite that the cortical laminar structure and the gross structures of hippocampus were largely preserved, there was a significant reduction of neuron cell density in BCCIP-CKD cortex (Figure 4B). These observations suggest that BCCIP defect impairs the development of both cerebellum and the cerebrum.
Figure 4. Histological analysis of cerebellum and sagittal brain sections of BCCIP-CON and BCCIP-CKD mice.
(A) Histology of cerebellum of BCCIP-CON (top row) and BCCIP-CKD (bottom row) mice at age P56. Column 1 shows Hematoxylin and Eosin (H&E) staining of cerebellum at magnification of 40×. Columns 2–4 show the immuno-histochemical staining for Calbindin (D-28K) that is specific for Purkinje cells (brown color in column 2), NeuN that is specific for neurons (brown color in column 3), and for GFAP is specific for glial cells (brown color in column 4). ML: molecular layers; GCL: granule cell layer; PC: Purkinje cells. (B) Histology of cerebrum of BCCIP-CON and BCCIP-CKD mice at age P56. Column 1 shows the H&E staining at 40× magnification. Columns 2 and 3 show the reduced neuron density in BCCIP-CKD mice as visualized by anti-NeuN staining. Columns 4 shows reduced density of glial cells (stained with anti-GFAP) in the BCCIP-CKD mice. Hippo: hippocampus; DG: dentate gyrus; CA1, CA2 and CA3: pyramidal cell layer of the hippocampus; Cx: cortex; SGZ: subgranular zone.
Increased apoptosis and reduced proliferation in the progenitor rich embryonic external germinal layer of cerebellum and ventricular zone of cortex of the BCCIP-CKD mice
The gross evaluation of the brains BCCIP deficient mice (Figure 3A) revealed a smaller size in both the cerebellum and the cerebrum regions. Reduced neurogenesis and microcephaly may be a consequence of an increased rate of apoptosis or reduced neural progenitor proliferative capacity. We investigated the effect of BCCIP deficiency on the progenitor cell populations that contribute to the development of cerebellum and cerebrum.
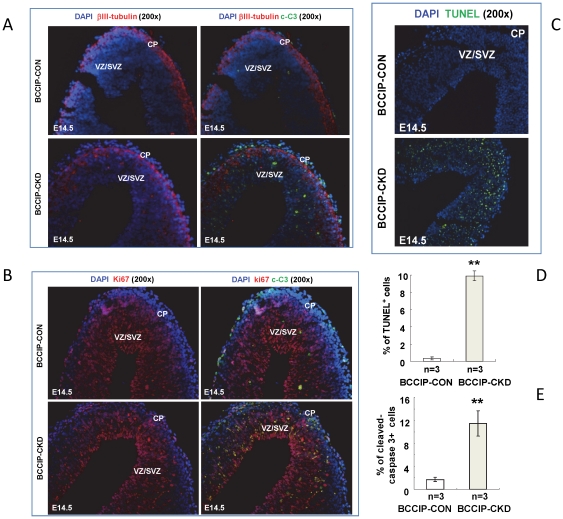
Mouse cortical neurogenesis occurs mostly from embryonic days 11 to 19 (E11–E19). It derives from a germinal layer of the dorsal telencephalon at E11 and begins to form during mouse mid-embryogenesis [21], [22]. To determine the cell type affected by BCCIP down-regulation in neocortices, we stained Ki67 and βIII-tubulin to label proliferating neural progenitor cells and newly differentiated neurons at embryonic day 14.5 (E14.5). At this stage the cortical neural progenitors including radial glial cells and short neural precursors proliferate in the ventricular zone (VZ), while intermediate progenitor cells (derived from radial glial cells) divide in the subventricular zone (SVZ). As shown in Figure 5, these progenitor layers displayed a decreased breadth on the BCCIP deficient mice. By contrast, the width of βIII-tubulin-positive zone (corresponding to the differentiated region) was not affected in BCCIP deficient mice (Figure 5A). The boundary of differentiated βIII-tubulin-positive zone in BCCIP-CKD mice was not as well defined as in BCCIP-CON mice (Figure 5A). Increased apoptosis in both VZ and SVZ occur mainly in Ki67 positive region but âIII-negative layer (Figure 5B) as seen in immunoflourescent co-staining for cleaved Caspase-3 (a marker for apoptosis) with βIII-tubulin (Figure 5A) and Ki67 (Figures 5B and 5E), and TUNEL assay (Figure 5C and 5D). Little apoptosis was observed in βIII-tubulin-positive postmitotic region (Figure 5A). These observations indicate that defects in neocortical development in BCCIP-CKD embryos likely resulted from reduction of proliferative capacity and increased apoptosis of progenitors.
Figure 5. BCCIP knock-down increased apoptosis in the mitotic proliferating region of BCCIP-CKD neocortices.
(A) βIII-tubulin staining identifies the differentiating neural cell populations. Analysis of apoptosis was done by cleaved-caspase 3 (c-C3) staining in E14.5 using BCCIP-CON and BCCIP-CKD embryos. The merged composites are overlay of βIII-tubulin and DPAI staining. (B) Ki67 staining identifies the proliferating mitotic region. Analysis of apoptosis was done by cleaved-caspase 3 (c-C3) staining in E14.5 using BCCIP-CON and BCCIP-CKD embryos. (C) Apoptosis was analyzed by TUNEL assay in E14.5 using BCCIP-CON and BCCIP-CKD embryos. (D) Quantification of TUNEL staining. The amount of apoptosis was quantified in the VZ/SVZ of E14.5 embryos. (E) Quantification of cleaved-caspase 3 staining. The amount of apoptosis was quantified in the VZ/SVZ of E14.5 embryos. CP: cortical plate. VZ/SVZ: ventricular zone/subventricular zone. White bars: BCCIP-CON; Gray bars: BCCIP-CKD. The merged composites are overlay of Ki67 and DAPI staining. CP: cortical plate. VZ/SVZ: ventricular zone/subventricular zone. *: P<0.05; **: P<0.01; ***: P<0.001.
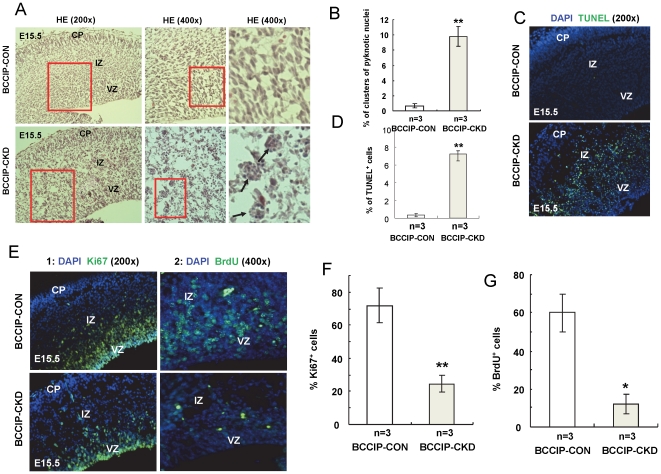
To further investigate the cause of cerebrum defects, we examined BCCIP-CON and BCCIP-CKD neocortices at E15.5. As shown in Figure 6A and 6B, about two days after the activation of Cre (E15.5), there was a reduction of cell density in the cortical layer in the BCCIP-CKD embryos. We observed clusters of pyknotic nuclei in BCCIP-CKD embryos (Figure 6A and 6B). This is associated with increase of TUNEL positive cells in the same region (Figure 6C and 6D). During the same period of time, there was reduced cell proliferation capability in BCCIP-CKD mice based on in vivo bromodeoxyuridine (BrdU) incorporation assay and anti-Ki67 staining (Figure 6E). We observed much less BrdU-positive and Ki67 cells in ventricular zone (VZ) of forebrain at E15.5 than in their littermates BCCIP-CON (Figures 6F and 6G). These data clearly suggest a widespread proliferation defect and apoptotic activities in the progenitor cell population that later would be developed into the cerebrum structure. It further supports the essential requirement for BCCIP in progenitor viability and function during neurogenesis.
Figure 6. BCCIP knock-down causes apoptotic cell death and reduction of cell proliferation capacity in the neocortices progenitor cells.
The brain tissues form E15.5 embryos were subjected to IHC and H&E staining analyses. In all panels: CP - cortical plate; IZ - intermediate zone; VZ - ventricular zone. (A) illustrates the magnified views of H&E staining of littermate BCCIP-CON and BCCIP-CKD brain sections. Representative of clusters of pyknotic cell nuclei in the BCCIP-CKD ventricular zone are indicated by arrows. The right panels of 6A show the enlarged images of selected areas of the middle panels. (B) Quantification of clusters of pyknotic nuclei. (C) The apoptotic cells from the same were detected by TUNEL staining. (D) Quantification of TUNEL staining. (E) Proliferative cells were detected by anti-Ki67 staining (column 1), and BrdU incorporation (column 2) at E15.5 (about 2 days after the GFAP-Cre is expressed). (F) Quantification of Ki67 staining. (G) Quantification of BrdU staining. Error bars are standard deviation. White bars: BCCIP-CON; Gray bars: BCCIP-CKD. The asterisks indicate the statistic significance between the BCCIP-CON and BCCIP-CKD, *: P<0.05; **: P<0.01; ***: P<0.001.
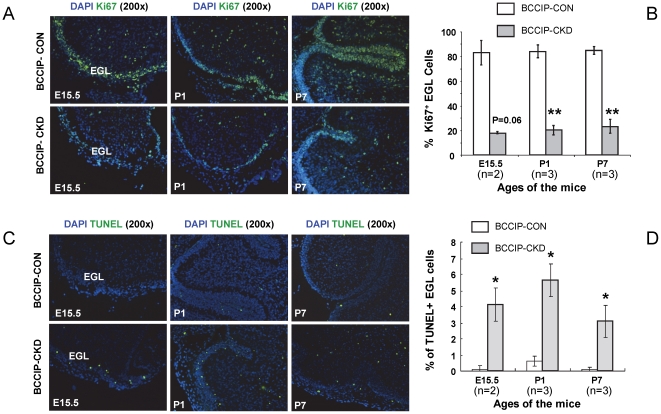
The mouse cerebellum development normally initiates from the dorsal region of the posterior neural tube around age E10–E12. A pool of neural progenitor cells migrates from the rhombic lip to form the external germinal layer (EGL) and give rise to the granular neuron precursor cells. Those granule neuron precursor cells are required to develop a well-structured cerebellum which undergoes over 1000-fold increase in volume during postnatal maturation [23]. We initially investigated the proliferation and cell death status at day E15.5, when the EGL structures can be readily identified. At this time, there was significantly reduced cell proliferation based on anti- Ki67 staining in EGL (Figures 7A–B), while there were significant increases of apoptotic cells in EGL (Figures 7C–D). These changes can also be observed postnatal at age P1 and P7 (Figures 7A–B). The reduced proliferation and increased apoptosis were more evident in the EGL of the cerebellum corresponding to the proliferating granule neuron progenitors.
Figure 7. proliferation defects and excessive cell death in the external germinal layer (EGL) granule cell progenitors.
Ki67 IHC staining was used to identify the proliferative cells (Green in panel A) and TUNEL assay was performed to identify the apoptotic cells (Green in panel C). DAPI staining (Blue) was used to identify the nuclei of the cells. (A) Ki67 staining positive proliferative cells. (B) Quantification of Ki67 staining. (C) Apoptotic cells in the EGL at age E15.5, P1, and P7. (D) Quantification of TUNEL staining. The “n” values indicate the pairs of littermate matched mice used in the assay. Data are averages and standard errors from the indicated number of mice. *: P<0.05; **: P<0.01; ***: P<0.001.
In vitro cell proliferation and self-renewal defects in BCCIP deficient neural progenitors
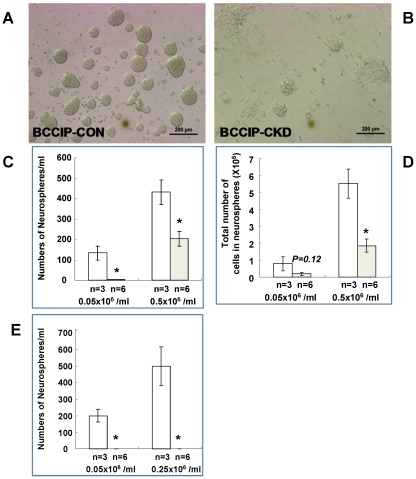
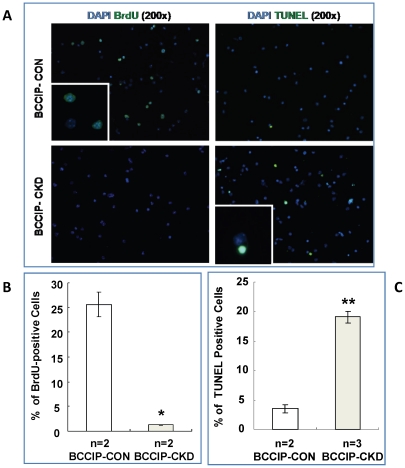
The previous data (Figures 5, 6, 7) suggest that BCCIP knockdown causes proliferation defects and massive apoptotic cell death in the progenitor cell population early in embryogenesis. To confirm that BCCIP defect impairs the proliferation of neural progenitor cells, we generated neurosphere cultures from BCCIP-CKD and BCCIP-CON mice. We plated the dissociated neural cells derived from E15.5 mice (see Material and Methods). After 7 days, cultures from BCCIP- CKD brains formed a significantly lower number of neurospheres and of smaller size than those of BCCIP-CON mice (Figures 8A–8C). Accordingly, the total number of cells grown in neurospheres was significantly lower in BCCIP-CKD mice than BCCIP-CON mice (Figure 8D). To access the self-renewal capacity from primary neurospheres, we re-dissociated the collected spheroids from the primary culture, re-plated in fresh medium, and cultured for additional 7 days. As shown in Figure 8E, the re-suspended cells from BCCIP-CON primary neurospheres retained their ability to form secondary spheroids, but the cells from the BCCIP-CKD mice failed to do so. This suggests that although BCCIP-CKD neuron progenitor cells formed a few viable neuropsheroids, these cells had reduced ability to maintain the self-renewal potential. We further evaluated DNA synthesis by BrdU-labeling and apoptosis by TUNEL assay (Figure 9A). BCCIP knockdown decreased cell proliferation and increased the percentage of apoptotic cells (Figures 9A–9C). These data suggest that lack of BCCIP significantly impairs the proliferation of neural progenitor cells. Consistent with the in situ observations (Figures 5, 6, 7), they suggest that BCCIP function is essential for proliferative cells.
Figure 8. BCCIP knockdown leads to neural progenitor cell proliferation and self-renewal defects.
Neural stem and progenitor cells from E15.5 brains of BCCIP-CON and BCCIP-CKD were isolated and cultured in serum-free media to allow neurosphere formation at two seeding concentrations (0.05×10⁶ cells/ml or 0.25×10⁶ cells/ml) . After 7 days in culture, and the cells were counted and re-plated to assess self-renewal ability by culturing for another 7 days. (A) and (B) shows the morphology of neurospheres originated from E15.5 BCCIP-CON and BCCIP-CKD mice. Scale bar = 200 mm.(C) shows the number of neurospheres and (D) shows the total cell numbers grown from the primary culture, panel (E) shows the number of neurospheres formed from re-suspended primary neurospheres to assess the self-renewal capability. The initial concentrations of cells plated are indicated in the figures. *: P<0.05; **: P<0.01; ***: P<0.001. Asterisks indicate significant differences and n indicates the number of individual neuroprogenitor cell lines analyzed.
Figure 9. BCCIP knockdown leads to reduced BrdU incorporation and increased apoptosis in neural progenitor cells.
BrdU incorporation and TUNEL assays on single cell suspension of the primary spheroid cultures were performed to assess the proliferation and apoptosis (see Materials and Methods for details). (A) shows representative images of BrdU and TUNEL staining. (C) and (B) show the quantification of BrdU staining and TUNEL staining. We scored 500 cells for each cell line after 7 days culture. In all panels, white bars: BCCIP-CON; gray bars: BCCIP-CKD. *: P<0.05; **: P<0.01; ***: P<0.001. Asterisks indicate significant differences and n indicates the number of individual neuroprogenitor cell lines analyzed.
BCCIP knockdown results in DNA-damage induced p53-dependent apoptosis
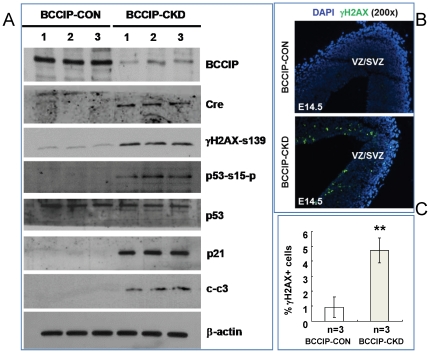
To further define the mechanisms by which BCCIP deficiency impairs progenitor cell proliferation, we analyzed the protein extracts from the in vitro neurospheres of BCCIP-CON and BCCIP-CKD mice (Figure 10). We found a higher level of serine-15 phosphorylation on p53 proteins in BCCIP-CKD neurospheres than that of the BCCIP-CON mice. In contrast, the total level of p53 protein was unaffected after BCCIP knockdown. The downstream effector of p53, p21 that mediates the p53-dependent cell cycle G1 phase arrest, was significantly increased in BCCIP-CKD neurospheres (Figure 10A). We also observed an elevated γH2AX level on immunoblots from neurosphere extract (Figure 10A), and a higher frequency of γH2AX-positive staining of the VZ and SVZ in situ (Figures 10B and 10C). These data further suggest that BCCIP deficiency causes spontaneous accumulation of DNA damage in the proliferative progenitor cells, which may trigger the activation of p53 and expression of p21 to impair proliferation of the progenitor cells.
Figure 10. BCCIP down-regulation shows activation of phosphorylation of p53 at ser15.
(A) Western blot from E15.5 neurospheres showed down-regulation of BCCIP expression with CRE expression. Three independent cell populations of BCCIP-CON and BCCIP-CKD were indicated on the top. Higher level of phosphorylation of H2AX (γH2AX) was shown in BCCIP-CKD neurospheres. All BCCIP-CKD neurospheres showed higher level of phosphorylation of p53 at Ser15 and p21 (a p53 downstream effector). Apoptosis was also detected of BCCIP-CKD mice by active caspase 3 (cleaved-caspase 3) blotting. (B) Immunostaining analysis of γH2AX in E14.5 BCCIP-CKD and BCCIP-CON embryos. Insets show higher magnification of γH2AX staining (magnification: 400). (C) Quantification of γH2AX staining. The amount of γH2AX was quantified in the VZ/SVZ of E14.5 embryos. CP: cortical plate. VZ/SVZ: ventricular zone/subventricular zone. White bars: BCCIP-CON; Gray bars: BCCIP-CKD. CP: cortical plate. VZ/SVZ: ventricular zone/subventricular zone. *: P<0.05; **: P<0.01; ***: P<0.001.
Discussion
Our data revealed a critical role of BCCIP in both cerebrum and cerebellum development (Figure 3). Because a reduction in proliferation was found in the VZ and EGL but not in the regions of postmitotic neurons of BCCIP-CKD mice (Figure 5), and an increase of apoptosis was detected in highly proliferating regions of the neocortices and EGL of BCCIP-CKD mice (Figures 5C, 6, 7), we suggest that BCCIP plays its roles in neural-development by supporting proliferation of neural progenitors. This conclusion is further supported by the in vitro neural progenitor spheroid culture studies (Figure 8), and the fact that the γH2AX foci were predominantly found in the proliferative VZ of neocortices in BCCIP deficient mice (Figure 10).
Although defective DNA damage response leads to general neurogenesis disorders, due to the preferential involvement of the each repair pathway in distinct cell population and developmental stages, deficiency on a particular DNA repair pathway often causes unique consequences [1]–[3]. Early in development and among the progenitor cell population, when cell proliferation is critical, the HR and replication related mechanisms are crucial to ensure replication fidelity and orderly development. It has been reported that conditional knockout of genes involved in HR, such as BRCA2 and Xrcc2, causes abnormalities predominantly in proliferative progenitor cells [3], [24]. In contrast, disruptions of genes involved in NHEJ, such as Ku70, DNA ligase IV, and Xrcc4, result in apoptosis of differentiating cells at later developmental stages [3], [25], [26]. The role of BCCIP in the proliferation of neural progenitor cells is consistent with a function of BCCIP in DNA replication and recombination.
In an earlier report, Frappart et al showed that conditional homozygous BRCA2 deletion in Brca2Nestin-cre mice resulted in neural development defects [24]. As a BRCA2 interacting protein, BCCIP has been shown to play a role in HR, cell cycle regulation, and chromosome stability [8], [11], [14], [16]. Although certain features, such as viable mice with no tumor formation, are common to conditional deletion of BRCA2 or BCCIP knockdown in neural cells, some features of the BCCIP-CKD mice are distinguishable from the BRCA2 knockout mice. It was noted that while the body weight of the BCCIP-CKD mice catches up with the littermate BCCIP-CON controls in adulthood, the brain size of the BCCIP-CKD mice remained to be at ∼50% of the controls (Figure 1F). The severity of the microcephaly is distinct from BRCA2 homozygous deletion mice, where a milder microcephaly phenotype was observed. In addition, severe ataxia was not reported in the BRCA2 deficient mice, while BCCIP-CKD mice displayed severe ataxia. Thus, it seems that BCCIP deficiency has a more profound effect on neurogenesis than BRCA2 deficiency.
In BRCA2, XRCC1 and NBS1 brain conditional knockout mouse models using Nestin-Cre [24], [27], [28], the Nestin promoter becomes active at around embryonic day 11 (E11), primarily in the central and peripheral nervous system during embryogenesis [29]. In our study, we crossed FVB-LoxPshBCCIP+/+ mice with FVB-Tg(GFAP-Cre) transgenic mice that expresses Cre recombinase under the control of the human GFAP promoter. It is known that the onset of GFAP-mediated transgene expression occurs in the dorsal and medial regions of the telencephalon around embryonic day 13.5 (E13.5) [20]. Although only glial cells are immune-reactive for GFAP in adult brain, embryonic GFAP-promoter activity is not restricted to glial progenitor cells. Much like Nestin-Cre, GFAP-promoter is active in multi-potential stem cells including neuron progenitor cells during embryogenesis [20]. However, there is a difference between the two transgenic mouse strains. Nestin-Cre mice express Cre recombinase in common neural progenitors mostly during embryogenesis, while GFAP-Cre transgenic mice express Cre recombinase in both embryonic common progenitor cells as well as in adult glial cells. Thus, development defects observed in our mouse model may be attributed by defects of both neuron-progenitors and glial progenitors during the embryogenesis.
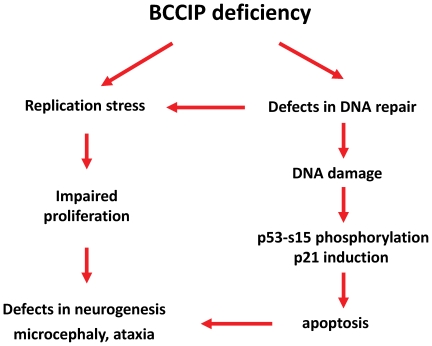
Deletion of p53 can rescue the neurogenesis defects conferred by BRCA2 deficiency, but this leads to rapid formation of medulloblastoma[24]. Nbs1 is another gene involved in DNA damage response. The Nbs1Nestin-Cre conditional knockout mice had severe neural degeneration, ataxia, and microcephaly, to a similar extent as our BCCIP-CKD mice [27]. The p53 deletion remarkably rescued the microcephaly and neural degeneration phenotype of Nbs1Nestin-Cre knockout mice [27]. Coincidentally, BCCIP deficiency resulted in activation of p53 (Figure 10), suggesting that p53 activation may be required for BCCIP deficiency induced neural development defects (Figure 11). It would be interesting to determine whether concurrent deletion of p53 in BCCIP deficient mice can rescue the neural development defects.
Figure 11. Mechanisms by which BCCIP deficiency lead to proliferation defect of the progenitor cells during brain development.
It is worthwhile to point out that we adapted a conditional BCCIP knockdown approach, in contrast to the conventionally used knockout approach. The knockdown approach enabled us to observe the phenotype of down-regulation of BCCIP gene rather than null BCCIP mutation. This may more naturally mimic the consequence of down-regulation of gene expression in development. Interestingly, in an independent transgenic line (LoxPshBCCIP+/+-13) that has a lower BCCIP knockdown efficiency than the LoxPshBCCIP+/+-4 used in this report, a milder microcephaly phenotype can be observed (Supplement Figure S1). This suggests that there is a dosage-effect relationship between the degree of BCCIP down-regulation and the severity of neural development defects. An intriguing observation is that while the severe ataxia phenotype among the BCCIP deficient mice gradually improved when the mice grow into adults, we observed consistent microcephaly throughout the life span, and the majority of adult BCCIP deficient mice failed balance beam test. In addition, the reconstituted U6 promoter resulted from Cre-mediated recombination and the down regulation of BCCIP were detectable in adult BCCIP deficient mice. These observations imply that the BCCIP deficient mice may be able to make adjustment to the cerebellum defects resulted from embryogenesis.
In summary, our study suggests that BCCIP down-regulation causes severe neural development retardation due to proliferation defects of the neural progenitors. This defect is associated with a spontaneous activation of p53 and accumulation of spontaneous DNA damage in the progenitor cells. These data illustrate the critical roles of BCCIP in neural development and progenitor cell proliferation.
Materials and Methods
Ethics statement
The animal works presented in this study were approved by Institutional Animal Use and Care Committee of Robert Wood Johnson Medical School, University of Medicine and Dentistry of New Jersey. We follow our institutional guideline regarding to animal welfare issues.
Mouse strains and PCR genotyping
The generation of FVB-LoxPshBCCIP+/+ (founder line 4) has been described previously [16]. The GFAP-Cre transgenic mice (FVB-Tg(GFAP-Cre)25Mes/J) were obtained from the Jackson Laboratory (stock number: 004600). These mice were interbred to obtain LoxPshBCCIP+/−;GFAP-Cre−/− and LoxPshBCCIP+/−;GFAP-Cre+/− (referred to as BCCIP-CON and BCCIP-CKD) mice. During breeding, the GFAP-Cre transgene was routinely carried by the male to avoid germ-line BCCIP disruption due to spurious Cre expression in the ovary. The genotypes were identified by PCR of DNA prepared from tail snips. Primer sets used for genotyping are listed in the Table 1. Routine handling of mice was approved by and performed according to the guidelines for the institutional animal care committee. Balance beam test was conducted with a beam consisted of a piece of hardwood (1.5 cm wide×60 cm long) suspended 35 cm above bedding. The time that mice used to pass the beam was recorded as described by others [30].
Table 1. Primer sets used for genotyping.
| Transgenes | Forward primer sequence(5′-3′) | Reverse primer sequence(5′-3′) | Product (bp) |
| U6-pLoxPneo-BCCIP | TCTAGAACTGGATCCGAC | TCGTATAGCATACATTATACG | 235 |
| GFAP-Cre | ACTCCTTCATAAAGCCCTCG | ATCACTCGTTGCATCGACCG | 190 |
| Recombined U6-BCCIP | TCTAGAACTGGATCCGAC | AGGCTTTTCTCCAAGGGATATT | 317 |
Histological and immune-histochemical (IHC) analysis
Embryonic brains were fixed in 4% paraformaldehyde for 24 hr, cryoprotected in 30% sucrose/PBS, and frozen for cryostatsection. All cryostatsections were cut at 8 µm. Postnatal brains were fixed in 10% buffered formalin for 24–48 hr before paraffin embedding. All paraffin embedding sections were cut at 5 µm. These sections were stained with hematoxylin and eosin (H&E) according to standard procedures. IHC analysis of tissue were performed by permeablizing with 0.1% Triton X-100 in PBS for 10 mins, quenching endogenous peroxides with 3% hydrogen peroxide for 10 mins, followed by blocking, primary and secondary antibody incubation. Immunoreactivity was visualized with 3,3′- diaminobenzidine (DAB) (D5637, Sigma). Positive staining appears as brown nuclear staining, whereas nuclei counterstained with hematoxylin appear as blue color. For fluorescence signals, Fluorescein isothiocyanate (FITC) or Rhodamine conjugated secondary antibodies were used. DAPI (4′,6-diamidino-2-phenylindole) (H-1200, VECTOR) staining was used for counterstaining. All cryosection immunofluorescence staining was performed after antigen retrieval by boiling in 0.01 M Citric acid buffer (pH 6.0). The following primary antibodies were used: calbindin D-28K (1∶500, C9848, Sigma), NeuN (1∶100, MAB377, Millipore), GFAP (1∶400, ab360, Abcam), Ki67 (1∶300, ab15580, Abcam), cleaved-caspase3 (1∶200, #9661, Cell Signaling), γH2AX(ser-139) (1∶200, #2577, Cell Signaling), BrdU (1∶100, B2531, Sigma), p53-Ser15 phosphorylated (1∶200, #9284, Cell Signaling), βIII-tubulin (1∶200, T8578, Sigma), and p21 (1∶100, sc-6246, Santa Cruz). Apoptosis was measured on cryosections after proteinase K treatment using DeadEnd Fluorometric TUNEL system (G3250, Promega).
In vivo BrdU labeling
BrdU (B5002, Sigma) labeling was carried out by intraperitoneal injection of 50 mg/kg (in PBS) five times with a 2-hour interval. Mice were sacrificed 24 hours after injection and embryonic brains were processed for cryosectioning. Then, the cryosections were subjected to a 30-minute 2 M HCl treatment at 37°C, followed by routine IHC.
Neurosphere cultures, in vitro progenitor cell proliferation and TUNEL assays
Embryonic day 15.5 brains were dissected in a serum-free culture medium (Dulbecco's modified Eagle medium DMEM/F-12 (1∶1). The isolated brain tissues were mechanically dissociated with a fire-polished pasture pipette and digested using an enzyme mix solution containing 30 U/ml papain (P4762, Sigma), 240 µg/ml D,L-cysteine (C7477, Sigma) and 400 µg/ml DNase I (D4527, Sigma) in DMEM/F-12 (Invitrogen). After 1 h incubation at 37°C, the enzyme mix solution was neutralized with an inhibitor solution: 0.1125% ovomucoid trypsin inhibitor (T9253, Sigma), 0.0525% BSA (A30075, Research Products International Corp.), 400 µg/ml DNase I (D4527, sigma) in L-15 medium (21083, Invitrogen). Primary cells were grown in DMEM/F-12 medium with B27 (17504-044, Invitrogen), 20 ng/ml of epidermal growth factor (EGF; E4127, Sigma) and 20 ng/ml basic fibroblast growth factor (bFGF; F0291, Sigma).
The neurosphere were grown in suspension for 6 days and in the presence of 30 µM BrdU (B5002, Sigma) for 24 hr. These spheres were collected and digested into single cell suspension, then plated on poly-L-lysine (P4832, Sigma) coated coverslips for 30 min at 37°C to allow neurosphere cells adhesion but not differentiation. Cells were fixed by 4% paraformaldehyde (P6148, Sigma) solution in PBS for 30 min at room temperature. The fixed cells were then processed for BrdU staining.
Single neurosphere cells were prepared and adhered to coverslips as described above. The fixed cells were then processed for TUNEL staining using DeadEnd Fluorometric TUNEL system (G3250, Promega). Briefly, the fixed cells were permeabilized by immersing the slides in PBS containing 0.2% Triton X-100 solution for 5 mins. Cells were incubated for 10 min in terminal-deoxynucleotidyl-transferase (TdT) buffer (Promega) before incubation with TdT and fluorescein-12-dUTP for 1 hr at 37°C. The coverslips were mounted with DAPI for nuclear stain. Localized green fluorescence of apoptotic cells were detected by fluorescence microscopy.
Western blot
Western blots were performed with procedures as described previously [16]. Primary antibodies used were mBCCIP [16], Cre (1∶2000, 69050-3, Novagen), p53 (1∶2000, sc-6243, Santa Cruz), p53-Ser15 phosphorylated (1∶1000, #9284, Cell Signaling), p21 (1∶200, sc-6246, Santa Cruz), cleaved-caspase3 (1∶500, #9661, Cell Signaling) and γH2AX(ser-139) (1∶500, #2577, Cell Signaling).
Statistic analyses
Data in the graphs are represented as Mean ± S.D. of replicate experiments, with the number of mice as indicated in the figures. IHC estimates were made on 3 sections per mouse, and the number of mice analyzed is indicated in each figure legend. Data obtained from BCCIP-CKD mice were compared with those from BCCIP-CON littermate controls using two-tailed Student's t-test. P-value is indicated in the graphs (* P<0.05; ** P<0.01; *** P<0.001). The level of statistical significance was set at P<0.05.
Supporting Information
Conditional knockdown of mouse BCCIP in brain tissues using an independent founder line F13. Panel A shows the genotyping of a representative litter of 8 mice resulting from breeding between LoxPshBCCIP +/+ (founder F13) and GFAP-Cre +/−. The brain tissues from a litter of four BCCIP-CON (lanes 1–4) and four BCCIP-CKD (lanes 5–8) mice at age P1 were used for DNA and protein extractions. The upper two panels are genotyping results from tail DNA for the presence of the split U6 promoter LoxPshBCCIP and the GFAP-Cre cassettes. The bottom panel is results of PCR genotying for the reconstituted U6-shBCCIP cassette using DNA from the brain tissue of mice. Five (lanes a, b, c, d, and e) PCR controls are: a: DNA from a (LoxPshBCCIP +/−;GFAPCre −/−) mouse derived from founder line F13. b: DNA from a (LoxPshBCCIP +/−;GFAP-Cre +/−) mouse derived from founder line F13. c: DNA from a GFAPCre mouse d: DNA from a wild type mouse e: water as a negative PCR control All 8 (No. 1-8) littermates contain the original split U6 cassette in their tail DNA. But only the littermates (No. 5-8) with the GFAPCre cassette have reconstituted U6-shBCCIP cassette in the DNA extracted from brain tissues at P1. Panel B shows the levels of mouse BCCIP and β-actin (loading control) protein levels from the same mice as panel A, based on Western blot analysis on the brain protein extracts. As shown here, there was a modest reduction of BCCIP protein level in BCCIP-CKD mice obtained from founder F13. The knockdown efficiency from F13 appears not as strong as founder line F4, which are shown in Figure 1 and the main text of the manuscript. Panel C shows the reduced brain size at p21 of F13-BCCIP-CKD compared with F4-BCCIP-CKD (the same images of the control and F4-BCCIP-CKD brains as in Figure 3 are used for comparison). Panel D shows the brain weight of F13-BCCIP-CON (white bar) and F13-BCCIP-CKD (gray bar) mice at various ages, ranging from day 1 (1D) to approximately 24 months. Asterisks indicate the statistic significance between BCCIP-CON and BCCIP-CKD of the same age (*: P<0.05; **: P<0.01; ***: P<0.001). The “n” values indicate the number of mice measured at the time point. D: day; W: week; and M: month.
(TIF)
Ataxia of BCCIP deficient mice. Shown in the video is the movement behavior of representative BCCIP-CON and BCCIP-CKD (tail tagged with the blue tape) littermates at age P21. As shown here, the BCCIP-CKD littermate has severe walk disability and balance disorders.
(MPEG)
Acknowledgments
We thank Dr. Chuxia Deng (National Institute of Diabetes and Digestive and Kidney Disease, NIH) for offering the vector used to construct conditional BCCIP knockdown plasmid, Dr. Gabriella D'Arcangelo (Rutgers University) for suggestions on neural tissue analysis, and Ms. Jingmei Liu for technical support.
Footnotes
Competing Interests: The authors have declared that no competing interests exist.
Funding: This research was supported by NIH R01CA156706 to ZS, and by the Transgenic & Knockout Mouse and the Histopathology & Imaging shared resources of The Cancer Institute of New Jersey (P30CA072720). The funders had no role in study design, data collection and analysis, decision to publish, or preparation of the manuscript.
References
- 1.McKinnon PJ. DNA repair deficiency and neurological disease. Nat Rev Neurosci. 2009;10:100–112. doi: 10.1038/nrn2559. [DOI] [PMC free article] [PubMed] [Google Scholar]
- 2.O'Driscoll M, Jeggo PA. The role of the DNA damage response pathways in brain development and microcephaly: insight from human disorders. DNA Repair (Amst) 2008;7:1039–1050. doi: 10.1016/j.dnarep.2008.03.018. [DOI] [PubMed] [Google Scholar]
- 3.Orii KE, Lee Y, Kondo N, McKinnon PJ. Selective utilization of nonhomologous end-joining and homologous recombination DNA repair pathways during nervous system development. Proc Natl Acad Sci U S A. 2006;103:10017–10022. doi: 10.1073/pnas.0602436103. [DOI] [PMC free article] [PubMed] [Google Scholar]
- 4.Wilson DM, Bohr VA, McKinnon PJ. DNA damage, DNA repair, ageing and age-related disease. Mech Ageing Dev. 2008;129:349–352. doi: 10.1016/j.mad.2008.02.013. [DOI] [PMC free article] [PubMed] [Google Scholar]
- 5.Katyal S, McKinnon PJ. DNA strand breaks, neurodegeneration and aging in the brain. Mech Ageing Dev. 2008;129:483–491. doi: 10.1016/j.mad.2008.03.008. [DOI] [PMC free article] [PubMed] [Google Scholar]
- 6.Liu J, Yuan Y, Huan J, Shen Z. Inhibition of breast and brain cancer cell growth by BCCIPalpha, an evolutionarily conserved nuclear protein that interacts with BRCA2. Oncogene. 2001;20:336–345. doi: 10.1038/sj.onc.1204098. [DOI] [PubMed] [Google Scholar]
- 7.Meng X, Liu J, Shen Z. Inhibition of G1 to S cell cycle progression by BCCIP beta. Cell Cycle. 2004;3:343–348. [PubMed] [Google Scholar]
- 8.Lu H, Guo X, Meng X, Liu J, Allen C, et al. The BRCA2-interacting protein BCCIP functions in RAD51 and BRCA2 focus formation and homologous recombinational repair. Mol Cell Biol. 2005;25:1949–1957. doi: 10.1128/MCB.25.5.1949-1957.2005. [DOI] [PMC free article] [PubMed] [Google Scholar]
- 9.Ono T, Kitaura H, Ugai H, Murata T, Yokoyama KK, et al. TOK-1, a novel p21Cip1-binding protein that cooperatively enhances p21-dependent inhibitory activity toward CDK2 kinase. J Biol Chem. 2000;275:31145–31154. doi: 10.1074/jbc.M003031200. [DOI] [PubMed] [Google Scholar]
- 10.Mao N, Zhou Q, Kojic M, Perez-Martin J, Holloman WK. Ortholog of BRCA2-interacting protein BCCIP controls morphogenetic responses during DNA replication stress in Ustilago maydis. DNA Repair (Amst) 2007;6:1651–1660. doi: 10.1016/j.dnarep.2007.05.012. [DOI] [PMC free article] [PubMed] [Google Scholar]
- 11.Meng X, Fan J, Shen Z. Roles of BCCIP in chromosome stability and cytokinesis. Oncogene. 2007;26:6253–6260. doi: 10.1038/sj.onc.1210460. [DOI] [PMC free article] [PubMed] [Google Scholar]
- 12.Meng X, Lu H, Shen Z. BCCIP functions through p53 to regulate the expression of p21Waf1/Cip1. Cell Cycle. 2004;3:1457–1462. doi: 10.4161/cc.3.11.1213. [DOI] [PubMed] [Google Scholar]
- 13.Meng X, Liu J, Shen Z. Genomic structure of the human BCCIP gene and its expression in cancer. Gene. 2003;302:139–146. doi: 10.1016/s0378-1119(02)01098-3. [DOI] [PubMed] [Google Scholar]
- 14.Lu H, Yue J, Meng X, Nickoloff JA, Shen Z. BCCIP regulates homologous recombination by distinct domains and suppresses spontaneous DNA damage. Nucleic Acids Res. 2007;35:7160–7170. doi: 10.1093/nar/gkm732. [DOI] [PMC free article] [PubMed] [Google Scholar]
- 15.Fan J, Wray J, Meng X, Shen Z. BCCIP is required for the nuclear localization of the p21 protein. Cell Cycle. 2009;8:3019–3024. [PMC free article] [PubMed] [Google Scholar]
- 16.Lu H, Huang Y, Droz-Rosario R, Liu J, Bhaumik M, et al. Essential Roles of BCCIP in Mouse Embryonic Development and Structural Stability of Chromosomes. PLoS Genet. 2011;7(9):e1002291. doi: 10.1371/journal.pgen.1002291. doi: 10.1371/journal.pgen.1002291 Pages: 1–18. [DOI] [PMC free article] [PubMed] [Google Scholar]
- 17.Ash SC, Yang DQ, Britt DE. LYRIC/AEG-1 overexpression modulates BCCIPalpha protein levels in prostate tumor cells. Biochem Biophys Res Commun. 2008;371:333–338. doi: 10.1016/j.bbrc.2008.04.084. [DOI] [PMC free article] [PubMed] [Google Scholar]
- 18.Audhya A, Emr SD. Regulation of PI4,5P2 synthesis by nuclear-cytoplasmic shuttling of the Mss4 lipid kinase. Embo J. 2003;22:4223–4236. doi: 10.1093/emboj/cdg397. [DOI] [PMC free article] [PubMed] [Google Scholar]
- 19.Phillips-Mason PJ, Mourton T, Major DL, Brady-Kalnay SM. BCCIP associates with the receptor protein tyrosine phosphatase PTPmu. J Cell Biochem. 2008;105:1059–1072. doi: 10.1002/jcb.21907. [DOI] [PMC free article] [PubMed] [Google Scholar]
- 20.Zhuo L, Theis M, Alvarez-Maya I, Brenner M, Willecke K, et al. hGFAP-cre transgenic mice for manipulation of glial and neuronal function in vivo. Genesis. 2001;31:85–94. doi: 10.1002/gene.10008. [DOI] [PubMed] [Google Scholar]
- 21.Ruiz i Altaba A, Palma V, Dahmane N. Hedgehog-Gli signalling and the growth of the brain. Nat Rev Neurosci. 2002;3:24–33. doi: 10.1038/nrn704. [DOI] [PubMed] [Google Scholar]
- 22.Dehay C, Kennedy H. Cell-cycle control and cortical development. Nat Rev Neurosci. 2007;8:438–450. doi: 10.1038/nrn2097. [DOI] [PubMed] [Google Scholar]
- 23.Goldowitz D, Hamre K. The cells and molecules that make a cerebellum. Trends Neurosci. 1998;21:375–382. doi: 10.1016/s0166-2236(98)01313-7. [DOI] [PubMed] [Google Scholar]
- 24.Frappart PO, Lee Y, Lamont J, McKinnon PJ. BRCA2 is required for neurogenesis and suppression of medulloblastoma. Embo J. 2007;26:2732–2742. doi: 10.1038/sj.emboj.7601703. [DOI] [PMC free article] [PubMed] [Google Scholar]
- 25.Narasimhaiah R, Tuchman A, Lin SL, Naegele JR. Oxidative damage and defective DNA repair is linked to apoptosis of migrating neurons and progenitors during cerebral cortex development in Ku70-deficient mice. Cereb Cortex. 2005;15:696–707. doi: 10.1093/cercor/bhh171. [DOI] [PMC free article] [PubMed] [Google Scholar]
- 26.Gao Y, Sun Y, Frank KM, Dikkes P, Fujiwara Y, et al. A critical role for DNA end-joining proteins in both lymphogenesis and neurogenesis. Cell. 1998;95:891–902. doi: 10.1016/s0092-8674(00)81714-6. [DOI] [PubMed] [Google Scholar]
- 27.Frappart PO, Tong WM, Demuth I, Radovanovic I, Herceg Z, et al. An essential function for NBS1 in the prevention of ataxia and cerebellar defects. Nat Med. 2005;11:538–544. doi: 10.1038/nm1228. [DOI] [PubMed] [Google Scholar]
- 28.Lee Y, Katyal S, Li Y, El-Khamisy SF, Russell HR, et al. The genesis of cerebellar interneurons and the prevention of neural DNA damage require XRCC1. Nat Neurosci. 2009;12:973–980. doi: 10.1038/nn.2375. [DOI] [PMC free article] [PubMed] [Google Scholar]
- 29.Tronche F, Kellendonk C, Kretz O, Gass P, Anlag K, et al. Disruption of the glucocorticoid receptor gene in the nervous system results in reduced anxiety. Nat Genet. 1999;23:99–103. doi: 10.1038/12703. [DOI] [PubMed] [Google Scholar]
- 30.Takahashi E, Niimi K, Itakura C. Motor coordination impairment in aged heterozygous rolling Nagoya, Cav2.1 mutant mice. Brain Res. 2009;1279:50–57. doi: 10.1016/j.brainres.2009.05.016. [DOI] [PubMed] [Google Scholar]
Associated Data
This section collects any data citations, data availability statements, or supplementary materials included in this article.
Supplementary Materials
Conditional knockdown of mouse BCCIP in brain tissues using an independent founder line F13. Panel A shows the genotyping of a representative litter of 8 mice resulting from breeding between LoxPshBCCIP +/+ (founder F13) and GFAP-Cre +/−. The brain tissues from a litter of four BCCIP-CON (lanes 1–4) and four BCCIP-CKD (lanes 5–8) mice at age P1 were used for DNA and protein extractions. The upper two panels are genotyping results from tail DNA for the presence of the split U6 promoter LoxPshBCCIP and the GFAP-Cre cassettes. The bottom panel is results of PCR genotying for the reconstituted U6-shBCCIP cassette using DNA from the brain tissue of mice. Five (lanes a, b, c, d, and e) PCR controls are: a: DNA from a (LoxPshBCCIP +/−;GFAPCre −/−) mouse derived from founder line F13. b: DNA from a (LoxPshBCCIP +/−;GFAP-Cre +/−) mouse derived from founder line F13. c: DNA from a GFAPCre mouse d: DNA from a wild type mouse e: water as a negative PCR control All 8 (No. 1-8) littermates contain the original split U6 cassette in their tail DNA. But only the littermates (No. 5-8) with the GFAPCre cassette have reconstituted U6-shBCCIP cassette in the DNA extracted from brain tissues at P1. Panel B shows the levels of mouse BCCIP and β-actin (loading control) protein levels from the same mice as panel A, based on Western blot analysis on the brain protein extracts. As shown here, there was a modest reduction of BCCIP protein level in BCCIP-CKD mice obtained from founder F13. The knockdown efficiency from F13 appears not as strong as founder line F4, which are shown in Figure 1 and the main text of the manuscript. Panel C shows the reduced brain size at p21 of F13-BCCIP-CKD compared with F4-BCCIP-CKD (the same images of the control and F4-BCCIP-CKD brains as in Figure 3 are used for comparison). Panel D shows the brain weight of F13-BCCIP-CON (white bar) and F13-BCCIP-CKD (gray bar) mice at various ages, ranging from day 1 (1D) to approximately 24 months. Asterisks indicate the statistic significance between BCCIP-CON and BCCIP-CKD of the same age (*: P<0.05; **: P<0.01; ***: P<0.001). The “n” values indicate the number of mice measured at the time point. D: day; W: week; and M: month.
(TIF)
Ataxia of BCCIP deficient mice. Shown in the video is the movement behavior of representative BCCIP-CON and BCCIP-CKD (tail tagged with the blue tape) littermates at age P21. As shown here, the BCCIP-CKD littermate has severe walk disability and balance disorders.
(MPEG)


