Abstract
The aim of this study was to assess the effect of extracellular matrix (ECM) deposited by synovium-derived stem cells (SDSCs) on articular chondrocyte expansion and maintenance of differentiation status and redifferentiation capacity. Passage 0 (P0) pig articular chondrocytes were expanded for six passages on plastic flasks (Plastic), SDSC-derived ECM (ECM), or substrate switching from either Plastic to ECM (PtoE) or ECM to Plastic (EtoP). Cell morphology, gene expression profiles, and immunophenotypes at each passage were used to characterize differentiation status of expanded cells. Chondrocytes at P0, P2, and P6 were assessed for redifferentiation capacity in a pellet culture system treated with either TGF-β1- or serum-containing medium for 14 days, using histology, immunohistochemistry, biochemistry, western blot, and real-time PCR. We found that ECM not only greatly enhanced chondrocyte expansion but also delayed dedifferentiation of expanded chondrocytes. Intriguingly, compared to a dramatic decrease in CD90+/CD105+ cells and CD90+ cells, CD105+ cells dramatically increased when chondrocytes were plated on Plastic; on the contrary, ECM expansion dramatically increased CD90+ cells and delayed the decrease of CD90+/CD105+ cells. Interestingly, expanded chondrocytes on ECM also acquired a strong redifferentiation capacity, particularly in the pellets treated with TGF-β1. In conclusion, the ratio of CD90 to CD105 may serve as a marker indicative of proliferation and redifferentiation capacity of dedifferentiated chondrocytes. ECM deposited by SDSCs provides a tissue-specific three-dimensional microenvironment for ex vivo expansion of articular chondrocytes while retaining redifferentiation capacity, suggesting that ECM may provide a novel approach for autologous chondrocyte - based cartilage repair.
Keywords: Extracellular matrix, Cartilage regeneration, Synovium-derived stem cell, Chondrocyte, Dedifferentiation, Redifferentiation
1. Introduction
Articular cartilage is a unique, hypocellular and avascular tissue, mostly made of extracellular collagens and proteoglycans (PGs); it has a limited ability to self heal after trauma and degenerative disease (Redman et al., 2005). Since the last century, various clinical and research approaches have been adopted to repair articular cartilage damage, including arthroscopic abrasion, transplantation of chondrocytes, periosteum graft, mesenchymal stem cells (MSCs), or tissue constructs derived from MSCs. Each method, however, has disadvantages in achieving satisfactory results in patients or animal studies. Autologous chondrocyte transplantation (ACT), the most current and clinically accepted method for cartilage repair, depends on the introduction of autologous chondrocytes into the defect area (Brittberg et al., 1994; Peterson et al., 2000). The big hurdle for this technique is the limited expandability and dedifferentiation of chondrocytes characterized by losing their round morphology and changing to a spindle shape. Meanwhile, collagen II and aggrecan dramatically decrease in contrast to the increase in collagen I (Benya and Shaffer, 1982; Giovannini et al., 2010; von der et al., 1977). There is an increasing number of studies investigating the role of growth factors in chondrocyte expansion and redifferentiation capacity (Benz et al., 2002; Pei et al., 2002a). Dedifferentiated chondrocytes are also able to redifferentiate to express cartilage-specific genes and proteins in three-dimensional (3D) culture systems, such as pellet (Pei et al., 2009; Tallheden et al., 2004), agarose gel (Benya and Shaffer, 1982), alginate beads (Benz et al., 2002; Hauselmann et al., 1994), or hybrid scaffold (Pei et al., 2002a&b); however, late-passage chondrocytes tend to lose their capacity to generate cartilage tissue (Dell'Accio et al., 2001).
The prevention of dedifferentiation or the preservation of chondrocyte characteristics during in vitro expansion is one of the major tasks necessary for the innovation of regenerative cartilage medicine. Plastic dishes coated with collagen II favored expanded chondrocytes' chondrogenic potential and dishes coated with a ceramic material favored expanded chondrocytes' osteogenic lineage capacity (Barbero et al., 2006). However, traditional cell culture on a two-dimensional (2D) substrate lacks a proper microenvironment and is proposed to be responsible for the dedifferentiation of chondrocytes. This problem can be overcome by using an in vitro 3D model because of its ability to mimic the in vivo environment (Yamada and Cukierman, 2007). There is increasing evidence demonstrating that superficial zone protein (SZP) synthesized by both chondrocytes and synovial cells bordering the joint cavity (Schumacher et al., 1999) provides a protective microenvironment for cartilage progenitor cells at the surface of articular cartilage (Dowthwaite et al., 2004). Our recent study developed a novel 3D expansion system based on the extracellular matrix (ECM) deposited by synovium-derived stem cells (SDSCs), which dramatically enhanced SDSC proliferation and chondrogenic differentiation potential (He et al., 2009; Li and Pei, 2011). In this study, we hypothesized that SDSC-derived ECM could provide a tissue-specific microenvironment by improving articular chondrocyte proliferation, delaying dedifferentiation, and enhancing redifferentiation potential.
2. Materials and methods
2.1. Isolation of pig articular chondrocytes and SDSCs
Three-month-old pigs were collected from a local slaughterhouse and harvested to provide articular cartilage and synovial tissue from the knee joints. The minced cartilage was digested in 0.2% collagenase P (Roche, Indianapolis, IN) at 37°C overnight. The finely minced synovial tissue was digested in 0.1% trypsin (Roche) and then placed in 0.1% collagenase P at 37°C for 2 h. After filtration through a 70-μm nylon filter, chondrocytes and synovial fibroblasts from two pigs were separately pooled, and plated in culture medium [DMEM containing 10% fetal bovine serum (FBS), 100 U/mL penicillin, 100 μg/mL streptomycin, and 0.25 μg/mL fungizone (Invitrogen, Carlsbad, CA)]. Synovial fibroblasts were isolated and characterized as SDSCs in our previous study (Pei et al., 2008).
2.2. Preparation of cell-free SDSC-derived ECM
The preparation of SDSC-derived ECM was described in our previous study (He et al., 2009). Briefly, cell culture flasks were pre-coated with fibronectin (BD Biosciences, Bedford, MA) for 1 h at 37°C. When the plated SDSCs reached 90% confluence, 50 μM L-ascorbic acid phosphate (Wako, Richmond, VA) was added for eight days. ECM was incubated in phosphate buffered saline (PBS) containing 0.5% Triton X-100 and 20 mM ammonium hydroxide for 5 min followed by100 units/mL DNase (Sigma-Aldrich, St. Louis, MO) for 60 min. After washing with PBS three times, cell-free ECM was stored in PBS at 4°C.
2.3. Ex vivo expansion of chondrocytes
Passage 0 (P0, freshly isolated) chondrocytes were expanded at an initial seeding density of 3,000 cells/cm2 for six passages in 75 cm2 flasks on two substrates: plastic flasks (“Plastic”) and plastic flasks coated with fibronectin and SDSC-derived ECM (“ECM”). For each passage, cells were expanded for seven days (reaching 90-95% confluence in the Plastic group). Trypsin-EDTA was used to detach cells and total cell number was counted using a hemocytometer. To identify if the substrate switch would affect cell expansion and redifferentiation capacity (short-term effect), P4 chondrocytes initially expanded on Plastic were plated on ECM for two more passages (“PtoE”) or from ECM to Plastic for two more passages (“EtoP”). Chondrocyte morphology expanded on Plastic or ECM was assessed using a phase contrast microscope and immunofluorescent microscope. Briefly, P4 chondrocytes were stained with Vybrant DiI cell-labeling solution (Invitrogen) and plated on Plastic or ECM for three days. The samples were fixed in 4% paraformaldehyde for 15 min and blocked in 1% bovine serum albumin (BSA, Sigma) for 30 min, followed by a one-hour incubation in a primary antibody against collagen I (Abcam, Cambridge, MA) and then a secondary antibody of Alexa Fluor® 488 donkey anti-mouse IgG (H+L) (Invitrogen). The samples were counterstained by mounting in Slow Fade® Gold anti-fade reagent with DAPI (Invitrogen). Immunofluorescent images were obtained with a Nikon Eclipse E800 microscope (Japan) and processed by SPOT software (Diagnostic Instruments Inc., Sterling Heights, MI).
2.4. Flow cytometry
The chondrocytes from each passage were analyzed using the following primary antibodies: CD14 (mouse anti-pig, clone number MIL-2; AbD Serotec, Oxford, UK), CD90 (conjugated with FITC, mouse anti-human, cross reaction with pig and rabbit, clone number 5E10; BD Biosciences Pharmingen, San Diego, CA), and CD105 (mouse anti-human, cross reaction with pig, clone number MEM-229; GeneTex Inc., San Antonio, TX). IgG1 and IgG2a (Beckman Coulter, Fullerton, CA) were used as the isotype controls, and R-Phycoerythrin Conjugated Goat Anti-Mouse IgG (H+L) was used as the secondary antibody. Samples (n = 3) of each 0.2 × 10⁶ chondrocytes were incubated in cold PBS containing 0.1% ChromPure Swine IgG (Jackson ImmunoResearch Laboratories, West Grove, PA) and 1% NaN3 for 30 min. Chondrocytes were then incubated in the dark in the primary antibodies for 30 min followed by the secondary antibody for 30 min. The labeled chondrocytes were analyzed on a BD dual laser FACS Calibur (BD Biosciences) using FCS Express software package (De Novo Software, Los Angeles, CA).
2.5. Redifferentiation of expanded chondrocytes in a pellet culture system
The chondrocytes (3 × 10⁵) from P0, P2, and P6 were centrifuged in a 15-mL polypropylene tube at 500 g for 5 min. After a 24-hour incubation in culture medium (referred to as day 0), the pellets were incubated in two culture media. One was a serum-free chondrogenic medium [high-glucose DMEM, 40 μg/mL proline (Sigma), 100 nM dexamethasone (Sigma), 100 U/mL penicillin, 100 μg/mL streptomycin, 0.1 mM ascorbic acid-2-phosphate, and ITS™ Premix (BD Biosciences) with the supplementation of 10 ng/mL of transforming growth factor beta1 (TGF-β1, R&D Systems, Minneapolis, MN)] (Pei et al., 2008) (“TGF-β1-containing medium”). The other culture medium was regular medium for chondrocyte-based tissue construct culture [high-glucose DMEM, 10% FBS, 100 U/mL penicillin, 100 μg/mL streptomycin, 10 mM HEPES (Sigma), 0.1 mM non-essential amino acids (Sigma), 0.4 mM proline, and 50 mg/L L-ascorbic acid] (Pei et al., 2002a&b) (“serum-containing medium”). The pellets were incubated at 5% CO2, 5% O2, 37°C for 14 days.
2.6. Histology and immunohistochemistry
The chondrocyte pellets (n = 2) were fixed in 4% paraformaldehyde at 4°C overnight, followed by dehydrating with a gradient ethanol series, clearing with xylene, and embedding in paraffin blocks. Five-μm-thickness sections were stained with Alcian blue to detect sulfated glycosaminoglycans (GAGs) with fast red as a counterstain. For immunohistochemical analysis, the sections were immunolabeled with primary antibodies against collagen I (clone number COL-1; Sigma), collagen II [II-II6B3, Developmental Studies Hybridoma Bank (DSHB), Iowa City, IA], and collagen X (clone number COL-10; Sigma), respectively. A secondary antibody of biotinylated horse anti-mouse IgG (Vector, Burlingame, CA) was incubated on the sections for 30 min. Immunoactivity was detected using Vectastain ABC reagent (Vector) with 3,3′-diaminobenzidine (DAB) as a substrate. Hematoxylin (Vector) served as a counterstain. Positive controls were shown in our previous study (Pei et al., 2008).
2.7. Biochemical analysis for DNA and GAG content
For biochemical analysis, pellets (n = 5) were digested at 60°C for 6 h with 125 μg/mL papain in PBE buffer (100 mM phosphate, 10 mM EDTA, pH 6.5) containing 10 mmol/L cysteine. The amount of DNA in each pellet was measured using the QuantiT™ PicoGreen® dsDNA assay kit (Invitrogen) with a CytoFluor® Series 4000 (Applied Biosystems, Foster City, CA). Sulfated GAGs were measured using 16 μg/mL of dimethylmethylene blue (DMMB) dye and a Spectronic™ BioMate™ 3 Spectrophotometer (Thermo Scientific, Milford, MA) with bovine chondroitin sulfate (Sigma) as a standard. (Pei et al., 2002)
2.8. TaqMan® quantitative real-time PCR
Total mRNA from pellets (n = 5) and pig articular cartilage (after mortar-and-pestle grinding in liquid nitrogen) was extracted using TRIzol® (Invitrogen) and 1 μg of mRNA was converted to cDNA with the High-Capacity cDNA Archive Kit as recommended by the manufacturer (Applied Biosystems). Chondrogenic (aggrecan, Sox9, and collagens I and II), and hypertrophic [collagen X, matrix metalloproteinase 13 (MMP13), and alkaline phosphatase (ALP)] marker genes were customized by Applied Biosystems as part of the Custom TaqMan® Gene Expression Assays (Table I). Eukaryotic 18S RNA (Assay ID: HS99999901_s1 ABI) was carried out as the endogenous control gene. Real-time PCR was performed with the iCycler iQ™ Multi Color RT-PCR Detection System (Perkin-Elmer, Waltham, MA). (He et al., 2009)
Table I. TaqMan® Customized Porcine Marker Gene Primers and Probes.
| Name | Primer/Probe | Sequence (5′-3′) | Applied Biosystem Catalog Number | Gene ID |
|---|---|---|---|---|
| Chondrogenic Markers | ||||
| Aggrecan | Forward | GCCACTGTTACCGCCACTT | AI2Z4PP | 397255 |
| Reverse | CACTGGCTCTCTGCATCCA | |||
| Probe | CTGACCGGGCGACCTG | |||
| Type I Collagen α1 | Forward | CCGTGCCCTGCCAGATC | AI0H8C9 | 397571 |
| Reverse | CAGTTCTTGATTTCGTCGCAGATC | |||
| Probe | TCGCACAACACATTGC | |||
| Type II Collagen α1 | Forward | TCCTGGCCTCGTGGGT | AIJ9V6I | 397323 |
| Reverse | GGGATCCGGGAGAGCCA | |||
| Probe | CTCCCCTGGGAAACC | |||
| Sox9 | Forward | TGGCAAGGCTGACCTGAAG | AI1Q6JH | 396840 |
| Reverse | GCTCAGCTCGCCGATGT | |||
| Probe | CCCCATCGACTTCCGC | |||
| Hypertrophic Markers | ||||
| Type X Collagen α1 | Forward | GGCCCGGCAGGTCATC | AI382VX | 448809 |
| Reverse | TGGGATGCCTTTTGGTCCTT | |||
| Probe | TCAGACCTGGTTCCCC | |||
| ALP | Forward | CCCTTCACTGCCATCCTGTAC | AI1Q8RQ | 100170147 |
| Reverse | CCATGGAGACGTTCTCTCTCTCA | |||
| Probe | ACGGCCCTGGCTACAA | |||
| MMP13 | Forward | AGTTTGGCCATTCCTTAGGTCTTG | AIWRF2U | 397346 |
| Reverse | GGCTTTTGCCAGTGTAGGTATAGAT | |||
| Probe | ACCACTCCAAGGACCC |
2.9. Western blot
To assess non-dissolvable collagen II expression in extracellular matrix, SDSC pellets (n = 3) were lyophilized and incubated in 4 M guanidine hydrochloride (GuHCl, Sigma) for 20 h at 4°C, then digested with 0.6 mg/ml of pepsin (Sigma) in 0.5 M acetic acid at 4°C for 48 h at a ratio of 10:1 (mg/mg) dry sample to pepsin. The samples were centrifuged at 48,000 g for 1 h, and the supernatant was lyophilized and dissolved in radioimmunoprecipitation assay (RIPA) buffer with protease inhibitors (Pierce, Rockford, IL). To assess dissolvable collagen II expression in cytoplasm, the pellets were homogenized and dissolved in RIPA buffer with protease inhibitors. Total proteins were quantified using the BCA™ Protein Assay Kit (Pierce). Forty μg of protein from each sample were denatured and separated using NuPAGE® Novex® Bis-Tris Mini Gels (Invitrogen) in the XCell SureLock™ Mini-Cell (Invitrogen) at 120 volts for 3 h at 4°C. Bands were transferred onto a nitrocellulose membrane (Invitrogen) using an XCell II™ Blot module (Invitrogen) at 30 volts for 1 h at 4°C. The membrane was incubated with 5% non-fat milk for 1 h followed by a primary monoclonal antibody against collagen II (II-II6B3) in 1% non-fat milk in TBST overnight at 4°C (β-actin served as an internal control), then by the secondary antibody of HRP-conjugated goat anti-mouse (Pierce) for 40 min at room temperature and exposure using SuperSignal West Femto Maximum Sensitivity Substrate (Pierce) and CL-XPosure Film (Pierce). (He et al., 2009; Pei et al., 2002)
2.10. Statistical analysis
The Kruskal-Wallis test was used to determine significant differences among all groups and the Mann-Whitney U test was used to determine differences when there were only two groups for comparison. All statistical analysis was performed with SPSS 13.0 statistical software (SPSS Inc., Chicago, IL). P values less than 0.05 indicated statistical significance.
3. Results
3.1. Chondrocyte expansion on ECM-coated surface resulted in large cell number with delayed dedifferentiation
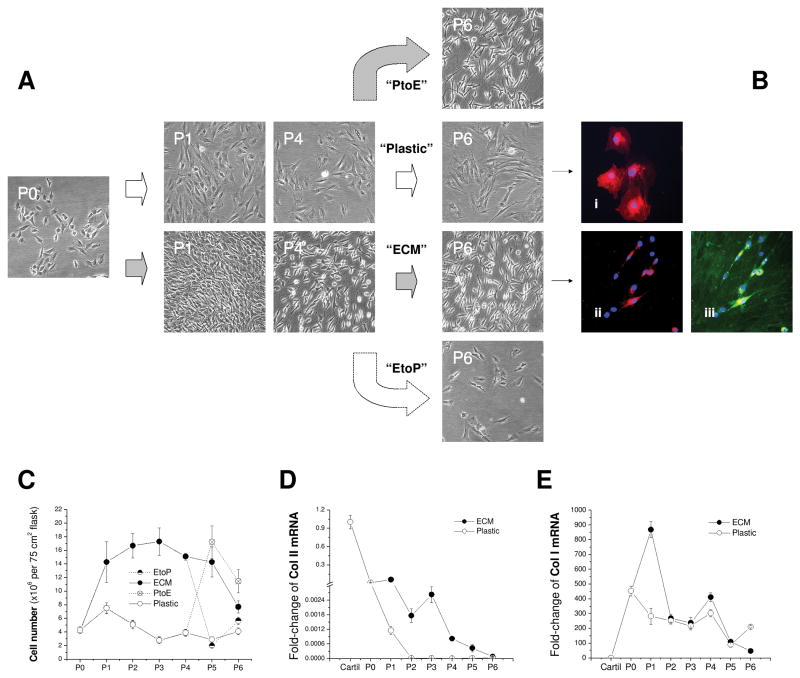
To identify the effect of ECM on chondrocyte proliferation and marker gene stability, P0 chondrocytes were expanded on ECM for six passages with Plastic as a substrate control [Fig. 1(A)]. Compared to the original round morphology, chondrocytes expanded on Plastic exhibited flattened and broad morphology [Fig. 1(Bi)]; in contrast, ECM-expanded chondrocytes displayed a smaller size with a glistening surface and fibroblast-like shape [Figs. 1(Bii/Biii)]. ECM was positively stained with collagen I [Fig. 1(Biii)]. From P1 to P5, the expanded cell number in the Plastic group continued to decrease (on average 5-fold); surprisingly, chondrocyte expansion on ECM yielded 4 to 10 times more cells than on Plastic [Fig. 1(C)]. Despite a sharp decrease of collagen II mRNA in chondrocytes from both groups, ECM expanded chondrocytes retained more collagen II mRNA than those plated on Plastic, particularly for the cells with fewer than three passages [Fig. 1(D)]. In contrast, collagen I mRNA dramatically increased in chondrocytes after isolation from cartilage despite a burst increase at P1 and P4 and a decrease at P6 in the ECM group [Fig. 1(E)].
Fig. 1.
In vitro expansion of articular chondrocytes on Plastic, ECM, PtoE, or EtoP from P0 to P6. (A) Representative cell morphology from chondrocytes at P0, P1, P4, and P6. (B) Dil-stained chondrocytes (red) with DAPI as a nuclear counterstain (blue) were expanded on either Plastic (Bi) or ECM [immunostained without (Bii) or with (Biii) collagen I antibody (green)]. (C) Expanded cell number was compared for plating on either ECM or Plastic at each passage. (D) Fold-change of collagen II (Col II) mRNA by the mRNA value from native cartilage was compared in cartilage tissue and chondrocytes expanded on ECM or Plastic. (E) Fold-change of collagen I (Col I) mRNA by the mRNA value from native cartilage was compared in cartilage tissue and chondrocytes expanded on ECM or Plastic. Data are shown as average ± SD for n = 4.
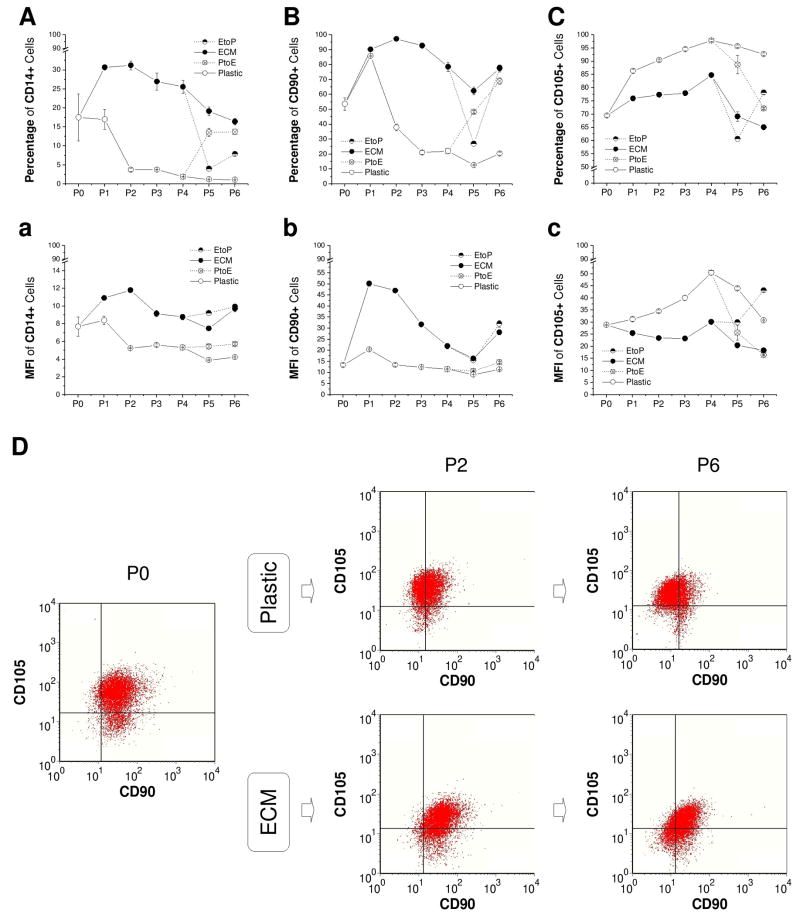
To evaluate the effect of ECM on immunophenotypic changes of articular chondrocytes during in vitro expansion, CD14, CD90, and CD105 were chosen to identify differentiation status of expanded chondrocytes [Fig. 2(A-C) and Fig. 2(a-c)]. Known as a macrophage marker, CD14 is also expressed by articular chondrocytes (Diaz-Romero et al., 2005) instead of by MSCs (Diaz-Romero et al., 2008). After an instant increase at P1, both CD14+ cells and CD90+ cells decreased with passaging when chondrocytes were expanded on Plastic; intriguingly, ECM expansion dramatically increased CD14+ cells and CD90+ cells up to P6. On the contrary, compared to an increase in CD105+ cells after expansion on Plastic, ECM expansion exhibited a lower expression of CD105+ cells. The change of culture substrate from either PtoE or EtoP resulted in the same conclusion.
Fig. 2.
Immunophenotype changes of chondrocytes expanded on ECM, Plastic, PtoE, or EtoP from P0 to P6. Flow cytometry was used to evaluate the percentage (A - C) and mean fluorescence intensity (MFI, a - c) of CD14+, CD90+, and CD105+ chondrocytes during cell expansion. Dual positive chondrocytes of CD90+ and CD105+ were represented at P0, P2, and P6 (D). Data are shown as average ± SD for n = 3.
To identify the effect of ECM on CD90+ cells and/or CD105+ cells during in vitro expansion, single positive (CD90+/CD105- or CD105+/CD90-), dual positive (CD90+/CD105+), and dual negative (CD90-/CD105-) cells were measured in expanded chondrocytes at P0, P2, and P6 using flow cytometry [Fig. 2(D)]. Although there were no distinct sub-categories of CD90/CD105 cells, we did find there was an obvious surface phenotype (CD90 and CD105) shift in chondrocytes expanded on Plastic and ECM (based on the isotype markers). When chondrocytes were expanded on Plastic, both CD90+/CD105+ cells (79.67% at P0, 42.43% at P2, and 18.74% at P6) and CD90+/CD105- cells (13.49% at P0, 4.21% at P2, and 5.71% at P6) decreased dramatically with a sharp increase in CD90-/CD105+ cells (5.67% at P0, 47.34% at P2, and 64.70% at P6) and CD90-/CD105- cells (1.18% at P0, 6.02% at P2, and 10.85% at P6). However, ECM expansion delayed a decrease in CD90+/CD105+ cells (79.67% at P0, 68.99% at P2, and 50.10% at P6) but increased CD90+/CD105- cells (13.49% at P0, 24.90% at P2, and 19.96% at P6) despite a concomitant increase in CD90-/CD105- cells (1.18% at P0, 3.84% at P2, and 19.26% at P6).
3.2. Chondrocytes expanded on ECM acquired enhanced redifferentiation capacity
To evaluate the redifferentiation capacity of expanded chondrocytes, pellets from P0, P2 (Plastic and ECM), and P6 (Plastic, PtoE, ECM, and EtoP) were incubated in either TGF-β1- or serum-containing medium for 14 days.
3.2.1. Redifferentiation of expanded chondrocytes in a TGF-β1-containing medium
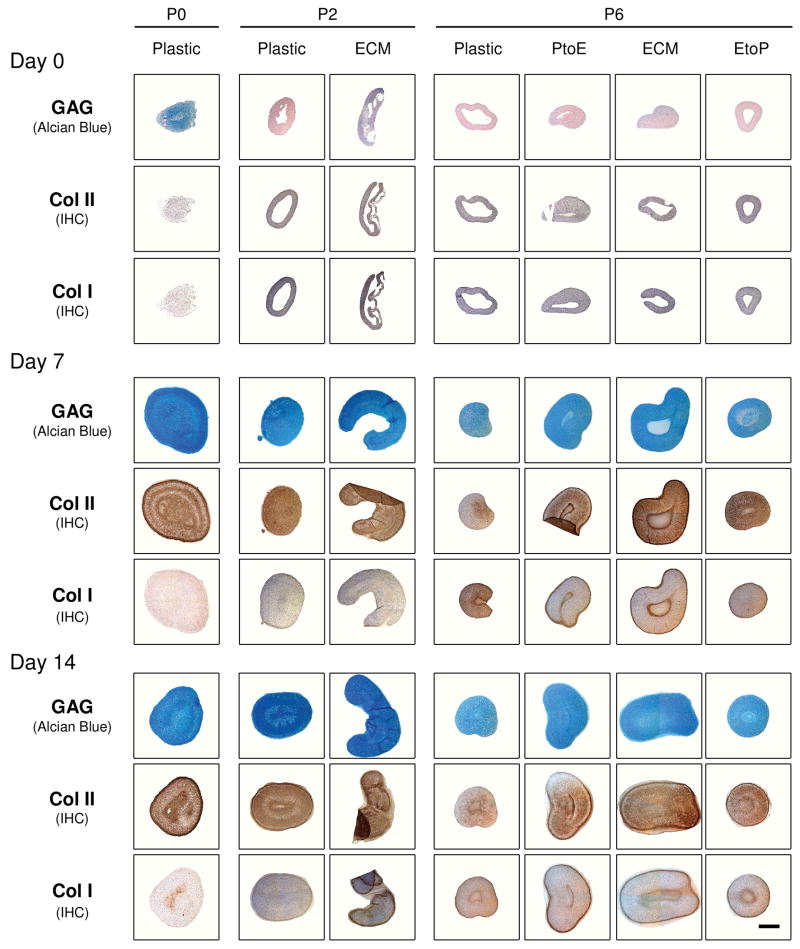
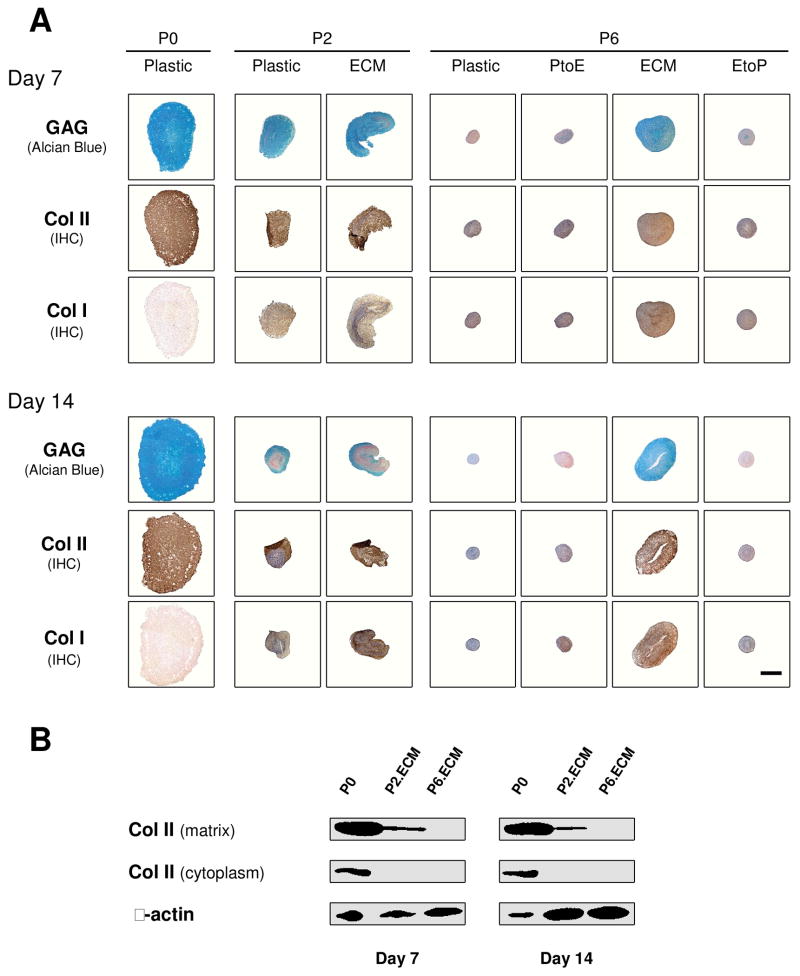
Histology and immunostaining were performed to evaluate the density and distribution of cartilage-specific matrix in chondrocyte pellets (Fig. 3). At Day 0, there was no detectable staining for sulfated GAGs or collagen except in the pellets from P0, P2.ECM, and P6.ECM. At day 7 and day 14, sulfated GAGs and collagen II were distributed intensively throughout the pellets from P0, P2.Plastic, P2.ECM, and P6.ECM despite weaker and comparable staining of collagen I in all pellets except from P0. At P6, the pellet sizes from Plastic and EtoP were also smaller than those from ECM and PtoE. There was no detectable collagen X in any pellets (data not shown).
Fig. 3.
Redifferentiation capacity of expanded chondrocytes was assessed at the protein level using histology after chondrocyte-pellets were incubated in a TGF-β1-containing medium for 14 days. Alcian blue staining was for sulfated GAGs with fast red as a counterstain, and immunohistochemistry (IHC) was for collagens I and II (DAB substrate had a brown color suggestive of positive staining) with hematoxylin as a counterstain. The scale bar was 800 μm.
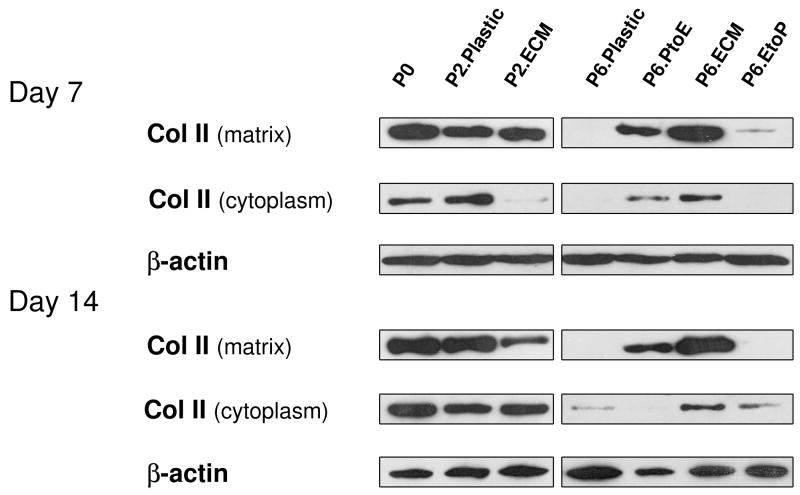
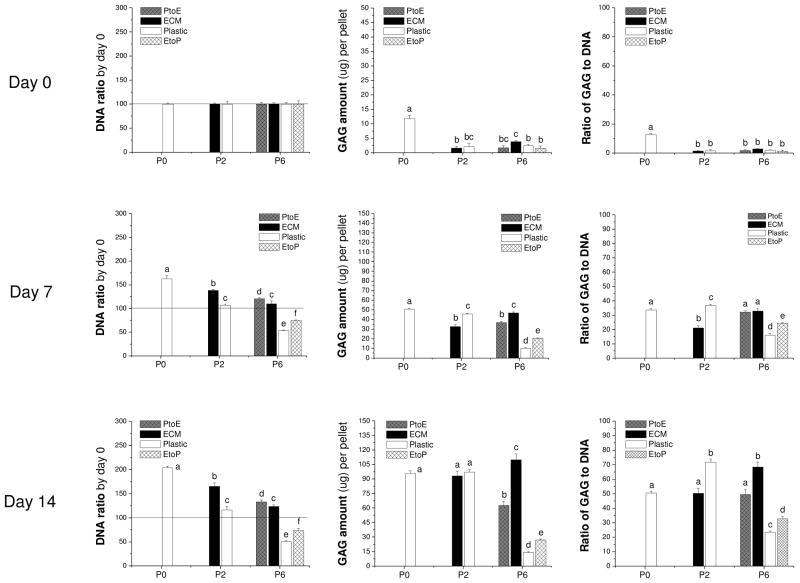
To confirm our histology data, western blot was used to semi-quantify the expression of collagen II at day 7 and day 14 (Fig. 4). We found that collagen II was intensively expressed in both the cytoplasm (immature) and matrix (mature) in pellets from P0, P2.Plastic, P2.ECM, and P6.ECM but not P6.Plastic. P6 chondrocytes expanded on either PtoE or EtoP yielded pellets with enhanced collagen II expression compared to those from P6.Plastic. Biochemical analysis was used to quantify GAGs in the pellets from expanded chondrocytes at day 0, day 7, and day 14 (Fig. 5). At day 0, pellets of P0 chondrocytes contained the highest GAGs compared to other groups. After incubation in TGF-β1-containing medium for 14 days, pellets of P2 chondrocytes expanded on ECM exhibited a comparable GAG amount to those plated on Plastic. In contrast, pellets of P6 chondrocytes expanded on ECM yielded the highest level of GAGs, which was 7.9-fold greater than those from P6.Plastic. Intriguingly, pellets of P6 chondrocytes from EtoP exhibited higher GAGs than those from P6.Plastic but lower than those from P6.PtoE. Meanwhile, compared to a time-dependent increase in cell number of pellets from P0 chondrocytes (“162% ± 7%” at Day 7 and “204% ± 4%” at Day 14), the cell number in the pellets from P6.Plastic dropped to 50% even after a seven-day incubation; however, the pellets from P6 chondrocytes expanded on ECM maintained their cell number at 124% after a 14-day incubation. The pellets of P6 chondrocytes from EtoP exhibited an increased expansion rate compared to those of P6.Plastic. Expanded chondrocytes from P2.Plastic and P6.ECM yielded pellets with the highest chondrogenic index whereas the pellets from P6.Plastic had the lowest chondrogenic index after a 14-day incubation with TGF-β1. The pellets of P6 chondrocytes from EtoP yielded a higher chondrogenic index compared to those from P6.Plastic, but was lower than those from PtoE.
Fig. 4.
Redifferentiation capacity of expanded chondrocytes was assessed at the protein level using western blot after chondrocyte-pellets were incubated in a TGF-β1-containing medium for 14 days. Collagen II in the extracellular matrix (mature) and cytoplasm (immature) of chondrocyte-pellets were detected with β-actin as an internal control.
Fig. 5.
Redifferentiation capacity of expanded chondrocytes was quantitatively assessed at the protein level using biochemical analysis after chondrocyte-pellets were incubated in a TGF-β1-containing medium for 14 days. DNA data were represented by DNA ratio adjusted by DNA amount at day 0. Ratio of GAG to DNA was used as a chondrogenic index. Data are shown as average ± SD for n = 5. Groups not connected by the same letter are significantly different (p<0.05).
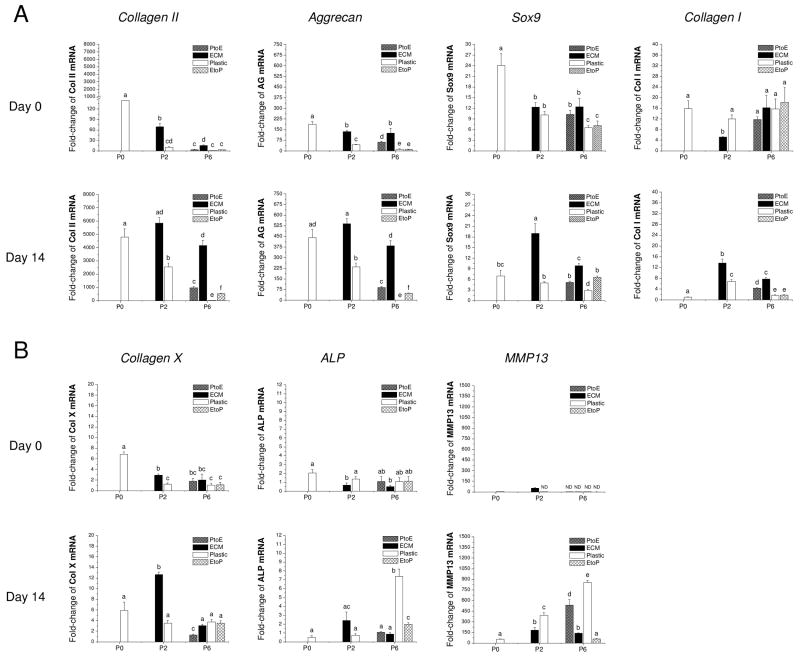
To assess the effect of ECM on redifferentiation capacity of expanded chondrocytes at the mRNA level, real-time PCR was used to quantify chondrogenic marker genes (collagens I and II, Sox9, and aggrecan) and hypertrophic marker genes (collagen X, ALP, and MMP13) at day 0 and day 14 (Fig. 6). Our data showed that Sox9, collagen II, and aggrecan presented a similar profile of gene expression without significant variations. Despite the highest expression in pellets from P0 chondrocytes at day 0, 14-day-incubation with TGF-β1 yielded pellets with a higher expression of all three genes in pellets from chondrocytes of P0, P2.ECM, and P6.ECM. At P6, pellets from chondrocytes expanded on Plastic exhibited the lowest expression of all three genes. Collagen I mRNA decreased in all pellets when incubated in a TGF-β1-containing medium. Despite the highest collagen X level in chondrocytes from P2.ECM after 14-day incubation with TGF-β1, expanded chondrocytes from P6.ECM had comparable collagen X mRNA to those from P6.Plastic. Two other hypertrophic markers, ALP and MMP13, both displayed a higher expression in chondrocytes from P6.Plastic than those from P6.ECM (6.1-fold and 9.0-fold, respectively).
Fig. 6.
Redifferentiation capacity of expanded chondrocytes was assessed at the mRNA level using chondrocyte-pellets after incubation in a TGF-β1-containing medium for 14 days. TaqMan® RT-PCR was used to quantitatively measure chondrogenic marker genes (A – collagen II, aggrecan, Sox9, and collagen I) and hypertrophic marker genes (B – collagen X, ALP, and MMP13) in the pellets of expanded chondrocytes at days 0 and 14. Data are shown as average ± SD for n = 5. Groups not connected by the same letter are significantly different (p<0.05).
3.2.2. Redifferentiation of expanded chondrocytes in a serum-containing medium
The pellets from P0 chondrocytes incubated in a serum-containing medium were intensively stained by Alcian blue for sulfated GAGs and immunostained for collagen II and had non-detectable staining for collagen I just like those treated with TGF-β1. Conversely, the pellets from P2 chondrocytes were smaller in size and weaker in staining for both GAGs and collagen II, especially for the pellets from P2.Plastic. More interestingly, 14-day-incubated pellets were weaker in chondrogenic marker staining than those from 7-day-incubated pellets (Figure 7A). At P6, only pellets from ECM maintained their size and were positive for sulfated GAGs and collagens I and II; the pellets from the other groups were small and weakly stained.
Fig. 7.
Redifferentiation capacity of expanded chondrocytes was assessed at the protein level using chondrocyte-pellets after incubation in a serum-containing medium for 14 days. (A) Alcian blue staining was used for sulfated GAGs with fast red as a counterstain, and immunohistochemistry (IHC) was for collagens I and II (DAB substrate had a brown color suggestive of positive staining) with hematoxylin as a counterstain. The scale bar was 800 μm. (B) Western blot was used to detect collagen II in extracellular matrix (mature) and cytoplasm (immature) of pellets with β-actin as an internal control at days 7 and 14.
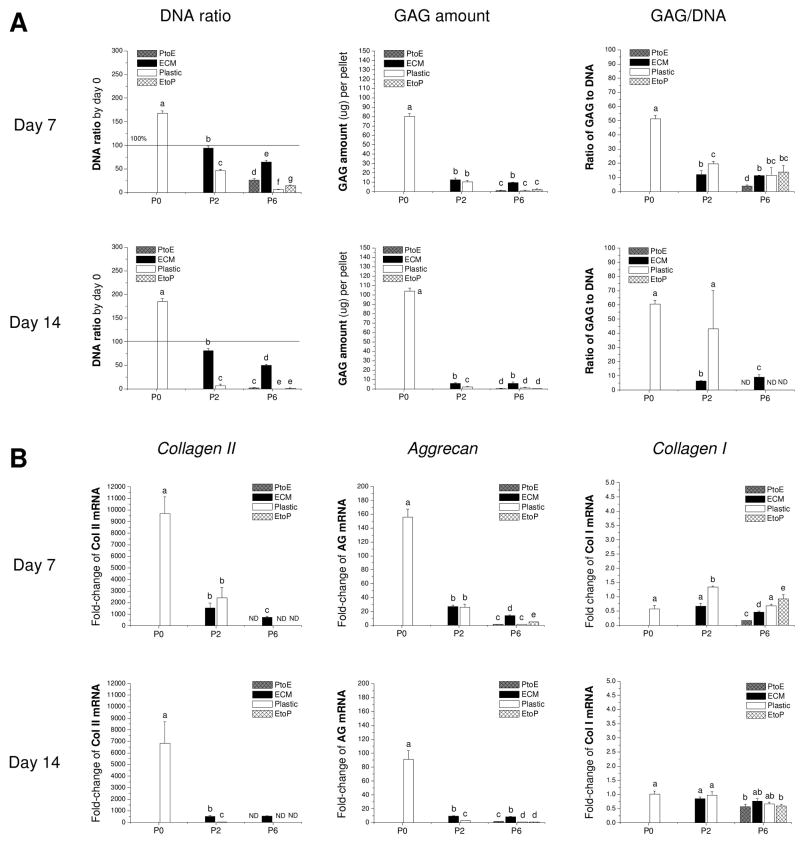
To confirm our histology data, western blot was used to semi-quantify collagen II in pellets incubated in a serum-containing medium (Figure 7B). Only three groups, the pellets from P0, P2.ECM, and P6.ECM, could be extracted to yield sufficient proteins for immunoblotting. The data showed that the pellets from P0 chondrocytes exhibited the highest expression of collagen II in both cytoplasm and matrix. Due to less total protein loaded for western blot, we did not detect collagen II in those from P6.ECM, and the pellets from P2.ECM exhibited detectable collagen II expression only in matrix. Our biochemical analysis data (Figure 8A) showed that, compared to those treated by TGF-β1, the pellets from P0 chondrocytes incubated in a serum-containing medium yielded higher GAG amounts, DNA ratio, and chondrogenic index. However, the pellets from P2 chondrocytes incubated in a serum-containing medium exhibited much less redifferentiation response despite the fact that 14-day-pellets from P2.ECM had higher GAG amounts and maintained a higher DNA ratio compared to those from P2.Plastic.
Fig. 8.
Redifferentiation capacity of expanded chondrocytes was assessed at the protein and mRNA level using chondrocyte-pellets after incubation in a serum-containing medium for 14 days. (A) Biochemical analysis was used to quantitatively measure DNA and GAG amounts in the 7- and 14-day pellets. DNA data were represented by DNA ratio adjusted by DNA amount at day 0. Ratio of GAG to DNA was used as a chondrogenic index. (B) TaqMan® RT-PCR was used to quantitatively measure chondrogenic marker genes (collagen II, aggrecan, and collagen I) in the pellets of expanded chondrocytes at days 7 and 14. Data are shown as average ± SD for n = 5. Groups not connected by the same letter are significantly different (p<0.05).
Our mRNA data (Figure 8B) showed that collagen II and aggrecan presented a similar profile of gene expression without significant variation. Both genes exhibited a positive response to serum incubation despite an initial increase at day 7 and a later decrease at day 14. The pellets from P2.ECM and P6.ECM displayed higher expression levels of both marker genes not only before but also after serum incubation compared to the chondrocytes expanded on Plastic. However, all pellets from expanded chondrocytes incubated in a serum-containing medium displayed much less collagen II and aggrecan gene expression compared to culture in a TGF-β1-containing medium except the pellets from P0 chondrocytes. There was no significant difference in collagen I expression in the pellets from expanded chondrocytes, either before or after serum treatment.
4. Discussion
Although multiple chondrocyte passaging decreases their redifferentiation capacity (Giovannini et al., 2010; Mandl et al., 2004), our study suggested that the sequential application of ECM (seeding substrate for cell proliferation) and TGF-β (growth factor for differentiation) affected chondrocyte expansion and redifferentiation capacity. In our study, chondrocytes expanded on SDSC-derived ECM showed a robust proliferation capacity in a 3D format. The expanded cells on ECM retained more chondrocyte gene expression profiles and immunophenotypes compared to expansion on Plastic. When incubated in a serum-free TGF-β1-containing chondrogenic medium, chondrocytes expanded on ECM exhibited enhanced redifferentiation up to passage 6 compared to expansion on Plastic where redifferentiation was retained only in the early passages.
We found that signs of dedifferentiation appeared even after one passage on Plastic, evidenced by dramatically decreased collagen II mRNA and increased collagen I mRNA compared with native cartilage; this outcome is in agreement with previous studies (Cournil-Henrionnet et al., 2008; Lin et al., 2008; Watt FM, 1988). We also found that expansion on ECM not only increased cell number but also delayed the decrease of a chondrocyte differentiation marker – collagen II. The ECM approach is superior to the application of growth factors (such as PDGF-BB), because the latter enhanced chondrocyte expansion but reduced redifferentiation capacity (Benz et al., 2002). The ECM approach is also superior to the use of collagen II-, fibronectin-, or bone-like-ceramic-coated dishes, because the different substrates did not make a significant difference in cell expansion compared to conventional flasks (Barbero et al., 2006). Consistent with a previous study (Diaz-Romero et al., 2008), our data showed that CD14+ cells decreased when chondrocytes were incubated on Plastic. Expansion on ECM boosted CD14+ cells, indicating that ECM was able to rescue differentiated chondrocytes and prevent dedifferentiation during in vitro expansion. This can also be explained by a recent report that chondrocytes cultured on collagen I–coated substrate showed a tendency of suppressed dedifferentiation (Kino-Oka et al., 2005). Our previous study demonstrated that ECM deposited by SDSCs, a tissue-specific stem cell for chondrogenesis, provides a 3D microenvironment composed of collagen I–dominated nano-structure fibers; SDSC expansion on ECM exhibited an enhanced proliferation capacity and chondrogenic potential (He et al., 2009), which is in accordance with this study and indicative that chondrocytes expanded on ECM exhibit an enhanced redifferentiation capacity.
Our data also showed that ECM expansion could up-regulate CD90 and down-regulate CD105 expression in chondrocytes compared to expansion on Plastic. As we know, CD90 and CD105 are MSC markers (Pittenger et al., 1999); increased CD90+ cells are also associated with cell proliferation capacity and chondrogenic potential (Grogan et al., 2007; Nagase et al., 2008) as well as the induction of stress fibers in articular chondrocytes (Diaz-Romero et al., 2005). CD105 [also termed endoglin or SH2 (Barry et al., 1999)] was expressed on articular chondrocytes with a high intensity, where endoglin forms a heteromeric complex with betaglycan (Parker et al., 2003). Endoglin-betaglycan association may be critical for achieving a balance between the positive and negative regulation of TGF-β signaling. Compared to overexpression of betaglycan enhanced TGF-β responses, overexpression of endoglin resulted in an inhibition of TGF-β signaling (Letamendia et al., 1998). Articular chondrocytes express higher levels of CD90 and lower levels of CD105 compared to MSCs (Bocelli-Tyndall et al., 2006). Our study indicated that dedifferentiated chondrocytes exhibited a dramatic down-regulation of CD90 and an up-regulation of CD105 when expanded on Plastic instead of ECM. Despite the fact that MMP3 (Pelttari et al., 2008) and fibroblast growth factor receptor 3 (Dell'Accio et al., 2001) can serve as markers predictive of the capacity of expanded chondrocytes to form stable cartilage in vivo, our pellet culture data suggested that ECM expanded chondrocytes acquired not only a high proliferation capacity but also an enhanced redifferentiation capacity. This finding indicates that the CD90/CD105 ratio may serve as a useful index to show the proliferation and redifferentiation capacity of dedifferentiated chondrocytes.
To stimulate chondrocyte redifferentiation after in vitro expansion, TGF-β1 was chosen to facilitate the formation of cartilage-specific extracellular matrix (Morales and Roberts, 1988) with serum-containing medium as a control. Culture medium supplemented with serum was proven to effectively induce freshly isolated chondrocytes to differentiate into cartilage tissue constructs in 3D biodegradable scaffolds (Pei et al., 2002b). Under the serum treatment, however, our study showed that chondrocytes expanded on Plastic lose their capacity for redifferentiation as early as P2, suggesting that serum could only stimulate the redifferentiation of early-passage chondrocytes. Chondrocytes cultured on ECM were able to maintain cell viability (evidenced by DNA ratio in the pellets during serum-free chondrogenic induction) and generate cartilage-specific matrix up to P6, albeit much weaker than those treated by TGF-β1-containing medium. A recent study showed that there is the existence of a certain subpopulation of multipotent MSCs or progenitor cells in the cartilage tissue besides terminally differentiated chondrocytes (Barbero et al., 2003). In our study, chondrocytes expanded on ECM behaved more like stem cells or progenitors rather than terminally differentiated cells in terms of rapid proliferation rate and a high level of CD90 expression. When culturing on ECM, stem cells or progenitors in mixed chondrocyte populations would accelerate the expansion rate compared with mature chondrocytes; those cells had strong chondrogenic potential, evidenced by generating cartilage-specific matrix in response to stimulation by TGF-β1 in a pellet culture system.
A potential mechanism underlying ECM enhancing chondrocyte proliferation and redifferentiation capacity may be explained by ECM acting through the integrin-mediated extracellular signal-activated kinase (ERK) signal transduction pathway. ECM would interact with chondrocytes through integrins and other signaling receptors, in which α5β1 and αVβ3 integrins were proven to be highly expressed in the cells attaching on 3D ECM (Cukierman et al., 2001; Yamada et al., 2003). Afterwards, the phosphorylation of ERK1/2 is upregulated by the activated β1 integrin via the Src/Ras/Raf signaling pathway (Damianova et al., 2008); then the high level of phosphorylated ERK1/2 would enhance TGF-β1-mediated redifferentiation of expanded chondrocytes on ECM (Li et al., 2005; Watanabe et al., 2001).
Our study also investigated the short-term effect of culture substrate on chondrocyte expansion and redifferentiation capacity by switching either from Plastic to ECM (PtoE) or from ECM to Plastic (EtoP). Expanded chondrocytes from either PtoE or EtoP acquired a higher proliferation and redifferentiation capacity compared to those plated on Plastic but was lower than those seeded on ECM. Chondrocytes expanded on PtoE acquired a higher redifferentiation capacity than those on EtoP, suggesting that once the chondrocytes adapt to the ECM environment, the transition from EtoP would deprive the chondrocytes of their expandability and redifferentiation potential. A generally accepted opinion is that passage 3-4 is considered as a threshold for irreversible dedifferentiation of chondrocytes (Dell'Accio et al., 2001; Schulze-Tanzil et al., 2004; Schumacher et al., 1999). Thus, our transition study from PtoE also indicated that dedifferentiated or aged chondrocytes (from passage 4) would regain their redifferentiation capacity with the help of ECM deposited by SDSCs. ECM provides an in vitro 3D expansion system that may play an important role in autologous chondrocyte transplantation-based cartilage repair.
In summary, we found that ECM deposited by a tissue-specific stem cell was able to efficiently expand primary chondrocytes; ECM-expanded chondrocytes retained their significant redifferentiation capacity. These results demonstrated that SDSC-derived ECM can function as a new ex vivo expansion system to overcome chondrocyte replicative senescence and enhance chondrocyte proliferation and redifferentiation potential for future clinical applications. In this study, since we pooled chondrocytes and SDSCs from two pigs, chondrocyte expansion on ECM could be considered on a substrate deposited from allogeneic SDSCs. As for a potential clinical application, commercialized ECM deposited by SDSCs from young and healthy donors could be used to expand chondrocytes from elderly patients. Further studies are needed to investigate whether redifferentiated chondrocytes from expansion on ECM are capable of forming cartilage tissue in vivo, which would ensure the stability and functionality of the acquired chondrocyte phenotype. Since matrix metalloproteinase (MMP) regulates ECM turnover in cartilage and bone development (Djouad et al., 2007; Krane and Inada 2008), we would like to determine whether and how matrix metalloproteinase (MMP)/tissue inhibitor of metalloproteinase (TIMP) signal axis is involved in the expansion of articular chondrocytes and in the retention of their redifferentiation. The mechanisms underlying the interaction between chondrocytes and ECM also need to be further investigated.
Acknowledgments
The authors thank Suzanne Smith for her help in editing the manuscript and Dr. Kathleen Brundage for her help with the experiments using flow cytometry (NIH #RR016440). Imaging experiments were performed in the West Virginia University Microscope Imaging Facility, which is supported in part by the Mary Babb Randolph Cancer Center and NIH grant P20 RR016440. The authors also appreciate Dr. Gerry Hobbs in the Department of Statistics at West Virginia University and Ms. Jingting Li for their help in statistical analysis. This study was supported by the AO Research Fund of the AO Foundation (Project No. S-08-67P) and a Peer-Reviewed Research Grant from the Musculoskeletal Transplant Foundation (Project No. 10012220).
Footnotes
Conflict of interest: The authors declare that they have no conflict of interest.
References
- 1.Benz K, Breit S, Lukoschek M, Mau H, Richter W. Molecular analysis of expansion, differentiation, and growth factor treatment of human chondrocytes identifies differentiation markers and growth-related genes. Biochem Biophys Res Commun. 2002;293:284–292. doi: 10.1016/S0006-291X(02)00223-1. [DOI] [PubMed] [Google Scholar]
- 2.Barbero A, Grogan SP, Mainil-Varlet P, Martin I. Expansion on specific substrates regulates the phenotype and differentiation capacity of human articular chondrocytes. J Cell Biochem. 2006;98:1140–1149. doi: 10.1002/jcb.20754. [DOI] [PubMed] [Google Scholar]
- 3.Barbero A, Ploegert S, Heberer M, Martin I. Plasticity of clonal populations of dedifferentiated adult human articular chondrocytes. Arthritis Rheum. 2003;48:1315–1325. doi: 10.1002/art.10950. [DOI] [PubMed] [Google Scholar]
- 4.Barry FP, Boynton RE, Haynesworth S, Murphy JM, Zaia J. The monoclonal antibody SH-2, raised against human mesenchymal stem cells, recognizes an epitope on endoglin (CD105) Biochem Biophys Res Commun. 1999;265:134–139. doi: 10.1006/bbrc.1999.1620. [DOI] [PubMed] [Google Scholar]
- 5.Benya PD, Shaffer JD. Dedifferentiated chondrocytes reexpress the differentiated collagen phenotype when cultured in agarose gels. Cell. 1982;30:215–224. doi: 10.1016/0092-8674(82)90027-7. [DOI] [PubMed] [Google Scholar]
- 6.Bocelli-Tyndall C, Barbero A, Candrian C, Ceredig R, Tyndall A, Martin I. Human articular chondrocytes suppress in vitro proliferation of anti-CD3 activated peripheral blood mononuclear cells. J Cell Physiol. 2006;209:732–734. doi: 10.1002/jcp.20789. [DOI] [PubMed] [Google Scholar]
- 7.Brittberg M, Lindahl A, Nilsson A, Ohlsson C, Isaksson O, Peterson L. Treatment of deep cartilage defects in the knee with autologous chondrocyte transplantation. N Engl J Med. 1994;331:889–895. doi: 10.1056/NEJM199410063311401. [DOI] [PubMed] [Google Scholar]
- 8.Cournil-Henrionnet C, Huselstein C, Wang Y, Galois L, Mainard D, Decot V, Netter P, Stoltz JF, Muller S, Gillet P, Watrin-Pinzano A. Phenotypic analysis of cell surface markers and gene expression of human mesenchymal stem cells and chondrocytes during monolayer expansion. Biorheology. 2008;45:513–526. [PubMed] [Google Scholar]
- 9.Cukierman E, Pankov R, Stevens DR, Yamada KM. Taking cell-matrix adhesions to the third dimension. Science. 2001;294:1708–1712. doi: 10.1126/science.1064829. [DOI] [PubMed] [Google Scholar]
- 10.Damianova R, Stefanova N, Cukierman E, Momchilova A, Pankov R. Three-dimensional matrix induces sustained activation of ERK1/2 via Src/Ras/Raf signaling pathway. Cell Biol Int. 2008;32:229–234. doi: 10.1016/j.cellbi.2007.08.029. [DOI] [PubMed] [Google Scholar]
- 11.Dell'Accio F, De BC, Luyten FP. Molecular markers predictive of the capacity of expanded human articular chondrocytes to form stable cartilage in vivo. Arthritis Rheum. 2001;44:1608–1619. doi: 10.1002/1529-0131(200107)44:7<1608::AID-ART284>3.0.CO;2-T. [DOI] [PubMed] [Google Scholar]
- 12.Diaz-Romero J, Gaillard JP, Grogan SP, Nesic D, Trub T, Mainil-Varlet P. Immunophenotypic analysis of human articular chondrocytes: changes in surface markers associated with cell expansion in monolayer culture. J Cell Physiol. 2005;202:731–742. doi: 10.1002/jcp.20164. [DOI] [PubMed] [Google Scholar]
- 13.Diaz-Romero J, Nesic D, Grogan SP, Heini P, Mainil-Varlet P. Immunophenotypic changes of human articular chondrocytes during monolayer culture reflect bona fide dedifferentiation rather than amplification of progenitor cells. J Cell Physiol. 2008;214:75–83. doi: 10.1002/jcp.21161. [DOI] [PubMed] [Google Scholar]
- 14.Djouad F, Delorme B, Maurice M, Bony C, Apparailly F, Louis-Plence P, Canovas F, Charbord P, Noël D, Jorgensen C. Microenvironmental changes during differentiation of mesenchymal stem cells towards chondrocytes. Arthritis Res Ther. 2007;9:R33. doi: 10.1186/ar2153. [DOI] [PMC free article] [PubMed] [Google Scholar]
- 15.Dowthwaite GP, Bishop JC, Redman SN, Khan IM, Rooney P, Evans DJ, Haughton L, Bayram Z, Boyer S, Thomson B, Wolfe MS, Archer CW. The surface of articular cartilage contains a progenitor cell population. J Cell Sci. 2004;117:889–897. doi: 10.1242/jcs.00912. [DOI] [PubMed] [Google Scholar]
- 16.Grogan SP, Barbero A, Diaz-Romero J, Cleton-Jansen AM, Soeder S, Whiteside R, Hogendoom PC, Farhadi J, Aigner T, Martin I, Mainil-Varlet P. Identification of markers to characterize and sort human articular chondrocytes with enhanced in vitro chondrogenic capacity. Arthritis Rheum. 2007;56:586–595. doi: 10.1002/art.22408. [DOI] [PubMed] [Google Scholar]
- 17.Hauselmann HJ, Fernandes RJ, Mok SS, Schmid TM, Block JA, Aydelotte MB, Kuettner KE, Thonar EJ. Phenotypic stability of bovine articular chondrocytes after long-term culture in alginate beads. J Cell Sci. 1994;107:17–27. doi: 10.1242/jcs.107.1.17. [DOI] [PubMed] [Google Scholar]
- 18.He F, Chen X, Pei M. Reconstruction of an in vitro tissue-specific microenvironment to rejuvenate synovium-derived stem cells for cartilage tissue engineering. Tissue Eng Part A. 2009;15:3809–3821. doi: 10.1089/ten.TEA.2009.0188. [DOI] [PubMed] [Google Scholar]
- 19.Kino-Oka M, Yashiki S, Ota Y, Mushiaki Y, Sugawara K, Yamamoto T, Takezawa T, Taya M. Subculture of chondrocytes on a collagen type I-coated substrate with suppressed cellular dedifferentiation. Tissue Eng. 2005;11:597–608. doi: 10.1089/ten.2005.11.597. [DOI] [PubMed] [Google Scholar]
- 20.Krane SM, Inada M. Matrix metalloproteinases and bone. Bone. 2008;43:7–18. doi: 10.1016/j.bone.2008.03.020. [DOI] [PubMed] [Google Scholar]
- 21.Letamendía A, Lastres P, Botella LM, Raab U, Langa C, Velasco B, Attisano L, Bernabeu C. Role of endoglin in cellular responses to transforming growth factor-beta. A comparative study with betaglycan. J Biol Chem. 1998;273:33011–33019. doi: 10.1074/jbc.273.49.33011. [DOI] [PubMed] [Google Scholar]
- 22.Li J, Pei M. Optimzation of an in vitro three-dimensional microenvironment to reprogram synovium-derived stem cells for cartilage tissue engineering. Tissue Eng Part A. 2011;17:703–712. doi: 10.1089/ten.TEA.2010.0339. [DOI] [PubMed] [Google Scholar]
- 23.Li TF, O'Keefe RJ, Chen D. TGF-beta signaling in chondrocytes. Front Biosci. 2005;10:681–688. doi: 10.2741/1563. [DOI] [PMC free article] [PubMed] [Google Scholar]
- 24.Lin L, Zhou C, Wei X, Hou Y, Zhao L, Fu X, Zhang J, Yu C. Articular cartilage repair using dedifferentiated articular chondrocytes and bone morphogenetic protein 4 in a rabbit model of articular cartilage defects. Arthritis Rheum. 2008;58:1067–1075. doi: 10.1002/art.23380. [DOI] [PubMed] [Google Scholar]
- 25.Mandl EW, van der Veen SW, Verhaar JA, van Osch GJ. Multiplication of human chondrocytes with low seeding densities accelerates cell yield without losing redifferentiation capacity. Tissue Eng. 2004;10:109–118. doi: 10.1089/107632704322791754. [DOI] [PubMed] [Google Scholar]
- 26.Morales TI, Roberts AB. Transforming growth factor beta regulates the metabolism of proteoglycans in bovine cartilage organ cultures. J Biol Chem. 1988;263:12828–12831. [PubMed] [Google Scholar]
- 27.Nagase T, Muneta T, Ju YJ, Hara K, Morito T, Koga H, Nimura A, Mochizuki T, Sekiya I. Analysis of the chondrogenic potential of human synovial stem cells according to harvest site and culture parameters in knees with medial compartment osteoarthritis. Arthritis Rheum. 2008;58:1389–1398. doi: 10.1002/art.23418. [DOI] [PubMed] [Google Scholar]
- 28.Parker WL, Goldring MB, Philip A. Endoglin is expressed on human chondrocytes and forms a heteromeric complex with betaglycan in a ligand and type II TGFbeta receptor independent manner. J Bone Miner Res. 2003;18:289–302. doi: 10.1359/jbmr.2003.18.2.289. [DOI] [PubMed] [Google Scholar]
- 29.Pei M, He F, Vunjak-Novakovic G. Synovium-derived stem cell-based chondrogenesis. Differentiation. 2008;76:1044–1056. doi: 10.1111/j.1432-0436.2008.00299.x. [DOI] [PMC free article] [PubMed] [Google Scholar]
- 30.Pei M, He F, Wei L, Rawson A. Melatonin enhances cartilage matrix synthesis by porcine articular chondrocytes. J Pineal Res. 2009;46:181–187. doi: 10.1111/j.1600-079X.2008.00646.x. [DOI] [PubMed] [Google Scholar]
- 31.Pei M, Seidel J, Vunjak-Novakovic G, Freed LE. Growth factors for sequential cellular de- and re-differentiation in tissue engineering. Biochem Biophys Res Commun. 2002a;294:149–154. doi: 10.1016/S0006-291X(02)00439-4. [DOI] [PubMed] [Google Scholar]
- 32.Pei M, Solchaga LA, Seidel J, Zeng L, Vunjak-Novakovic G, Caplan AI, Freed LE. Bioreactors mediate the effectiveness of tissue engineering scaffolds. FASEB J. 2002b;16:1691–1694. doi: 10.1096/fj.02-0083fje. [DOI] [PubMed] [Google Scholar]
- 33.Pelttari K, Lorenz H, Boeuf S, Templin MF, Bischel O, Goetzke K, Hsu H, Steck E, Richter W. Secretion of matrix metalloproteinase 3 by expanded articular chondrocytes as a predictor of ectopic cartilage formation capacity in vivo. Arthritis Rheum. 2008;58:467–474. doi: 10.1002/art.23302. [DOI] [PubMed] [Google Scholar]
- 34.Peterson L, Minas T, Brittberg M, Nilsson A, Sjogren-Jansson E, Lindahl A. Two- to 9-year outcome after autologous chondrocyte transplantation of the knee. Clin Orthop Relat Res. 2000;374:212–234. doi: 10.1097/00003086-200005000-00020. [DOI] [PubMed] [Google Scholar]
- 35.Pittenger MF, Mackay AM, Beck SC, Jaiswal RK, Douglas R, Mosca JD, Mooman MA, Simonetti DW, Craig S, Marshak DR. Multilineage potential of adult human mesenchymal stem cells. Science. 1999;284:143–147. doi: 10.1126/science.284.5411.143. [DOI] [PubMed] [Google Scholar]
- 36.Redman SN, Oldfield SF, Archer CW. Current strategies for articular cartilage repair. Eur Cell Mater. 2005;9:23–32. doi: 10.22203/ecm.v009a04. [DOI] [PubMed] [Google Scholar]
- 37.Schulze-Tanzil G, Mobasheri A, de Souza P, John T, Shakibaei M. Loss of chondrogenic potential in dedifferentiated chondrocytes correlates with deficient Shc-Erk interaction and apoptosis. Osteoarthritis Cartilage. 2004;12:448–458. doi: 10.1016/j.joca.2004.02.007. [DOI] [PubMed] [Google Scholar]
- 38.Schumacher BL, Hughes CE, Kuettner KE, Caterson B, Aydelotte MB. Immunodetection and partial cDNA sequence of the proteoglycan, superficial zone protein, synthesized by cells lining synovial joints. J Orthop Res. 1999;17:110–120. doi: 10.1002/jor.1100170117. [DOI] [PubMed] [Google Scholar]
- 39.Tallheden T, Karlsson C, Brunner A, Van Der Lee J, Hagg R, Tommasini R, Lindahl A. Gene expression during redifferentiation of human articular chondrocytes. Osteoarthritis Cartilage. 2004;12:525–535. doi: 10.1016/j.joca.2004.03.004. [DOI] [PubMed] [Google Scholar]
- 40.von der MK, Gauss V, von der MH, Muller P. Relationship between cell shape and type of collagen synthesised as chondrocytes lose their cartilage phenotype in culture. Nature. 1977;267:531–532. doi: 10.1038/267531a0. [DOI] [PubMed] [Google Scholar]
- 41.Watanabe H, de Caestecker MP, Yamada Y. Transcriptional cross-talk between Smad, ERK1/2, and p38 mitogen-activated protein kinase pathways regulates transforming growth factor-beta-induced aggrecan gene expression in chondrogenic ATDC5 cells. J Biol Chem. 2001;276:14466–14473. doi: 10.1074/jbc.M005724200. [DOI] [PubMed] [Google Scholar]
- 42.Watt FM. Effect of seeding density on stability of the differentiated phenotype of pig articular chondrocytes in culture. J Cell Sci. 1988;89:373–378. doi: 10.1242/jcs.89.3.373. [DOI] [PubMed] [Google Scholar]
- 43.Yamada KM, Cukierman E. Modeling tissue morphogenesis and cancer in 3D. Cell. 2007;130:601–610. doi: 10.1016/j.cell.2007.08.006. [DOI] [PubMed] [Google Scholar]
- 44.Yamada KM, Pankov R, Cukierman E. Dimensions and dynamics in integrin function. Braz J Med Biol Res. 2003;36:959–966. doi: 10.1590/s0100-879x2003000800001. [DOI] [PubMed] [Google Scholar]


