

Abstract
Ten crystal structures of the β2 adrenergic receptor (β2AR) have been published, reflecting different signaling states. Here, through controlled docking experiments, we examined the implications of using inactive or activated structures on the in silico screening for agonists and blockers of the receptor. Specifically, we targeted the crystal structures solved in complex with carazolol (2RH1), the neutral antagonist alprenalol (3NYA), the irreversible agonist FAUC50 (3PDS) and the full agonist BI-167017 (3P0G). Our results indicate that activated structures favor agonists over blockers while inactive structures favor blockers over agonists. This tendency is more marked for activated than for inactive structures. Additionally, agonists tend to receive more favorable docking scores when docked at activated rather than inactive structures, while blockers do the opposite. Hence, the difference between the docking scores attained with an activated and an inactive structure is an excellent means for the classification of ligands into agonists and blockers, as we determined through receiver operating characteristic (ROC) curves and linear discriminant analysis (LDA). With respect to virtual screening, all structures prioritized well agonists and blockers over non-binders. However, inactive structures worked better for blockers and activated structures worked better for agonists. Notably, the combination of individual docking experiments through receptor ensemble docking (RED) resulted in an excellent performance in the retrieval of both agonists and blockers. Finally, we demonstrated that the induced fit docking of agonists is a viable way of modifying an inactive crystal structure and bias it towards the in silico recognition of agonists rather than blockers.
Keywords: G protein-coupled receptors, β2 adrenergic receptor, agonists, blockers, virtual screening
Introduction
The β2adrenergic receptor (β2AR) is a prototypical member of a large superfamily of ubiquitous membrane proteins known as G protein-coupled receptors (GPCRs), or seven transmembrane (7TM) receptors.1 Like all GPCRs, the β2AR is constituted by a single polypeptide chain that spans the plasma membrane with seven α-helical transmembrane domains (TMs, numbered from TM1 to TM7) connected by three extracellular and three intracellular loops (ELs and ILs, numbered from EL1 to EL3 and from IL1 to IL3).2,3 Upon binding of specific ligands, GPCRs can adopt a spectrum of ligand-dependent conformational states.4–7 In turn, these lead to intracellular signaling either through heterotrimeric G proteins (hence their name) or through different intracellular signaling partners such as β-arrestins.1,8–15 Specifically, the β2AR signals through Gs, which is linked to the stimulation of adenylyl cyclase, and/or through β-arrestins.8–13 Moreover, under sustained stimulation, the β2AR has been shown to inhibit adenylyl cyclase activity through Gi.8
GPCRs are the most common target for pharmacological intervention and compounds capable of stimulating or blocking their activity are widely applied for the treatment of a variety of diseases.1 In particular, the stimulation of the β2AR by agonists constitutes the primary pharmacological intervention for the treatment of asthma and chronic obstructive pulmonary disease (COPD).16 Conversely, β-blockers are mostly employed for the treatment of hypertension, cardiac arrhythmias and myocardial infarction. However, compounds selective for the β1AR versus the β2AR might be preferred over unselective compounds.17
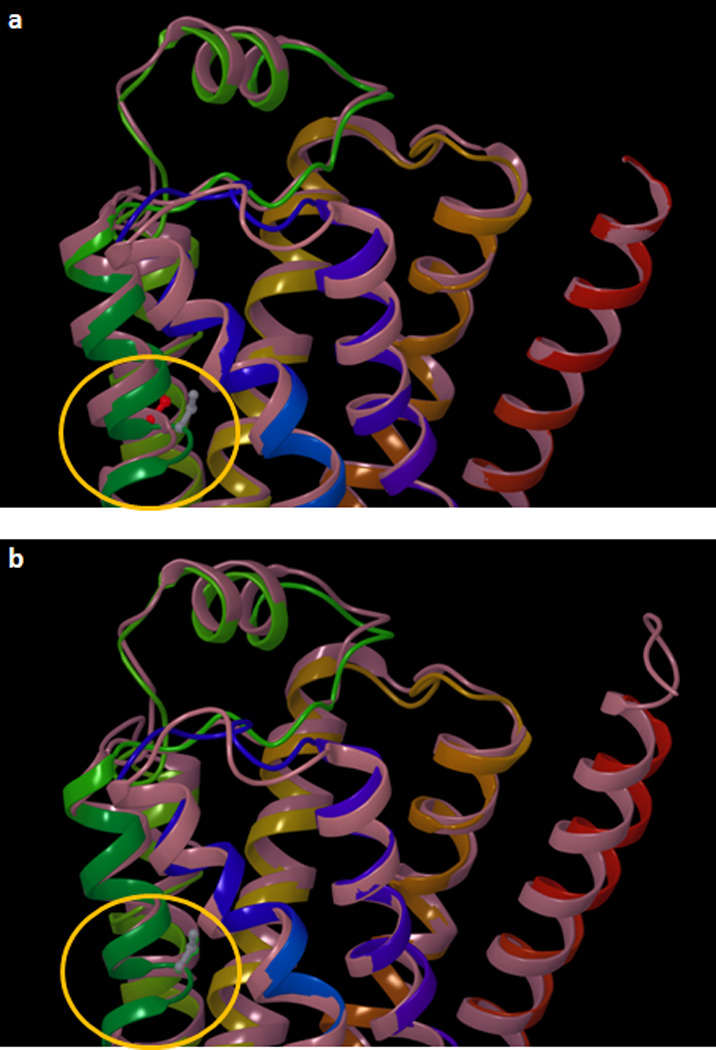
The 7TM topology of the β2AR and its homology to rhodopsin were evident since 1986.2,3 However, the atomic structure of the receptor was elucidated for the first time only in 2007, when it was solved through x-ray crystallography in complex with the inverse agonist carazolol (PDB ID: 2RH1).18,19 Following the breakthroughs of 2007, further structures of the β2AR have been published in complex with a variety of blockers, including the neutral antagonist alprenalol (PDB ID: 3NYA).20 More recently, two structures of β2AR in complex with full agonists have been solved. One of them, despite featuring a covalently bound irreversible agonist, appears to be trapped in a conformation close to the inactive state (PDB ID: 3PDS).21 Conversely, the other structure, which was crystallized in complex with a diffusible full agonist, displays a conformation that is very likely to be a good representation of an activated state of the receptor (PDB ID: 3P0G).22 Notably, this conformation was stabilized through the help of a fragment of a camelid antibody (nanobody) endowed with a G protein-like behavior. A comparison of the 2RH1 and 3P0G structures revealed substantial changes at the cytosolic end of the helical bundle, which are probably intimately related to the shift in signaling state. However, only subtle changes were found in the binding cavity. Among these, the most pronounced is a displacement of a portion of TM5, centered on Ser2075.46, that is drawn towards the center of the cavity upon agonist binding (Figure 1). Notably, prior to the publication of the active structure of the receptor, combining a docking approach that allows flexibility to the receptor23 with statistical analyses, we accurately envisaged the conformational changes produced by agonists to the ligand-binding cavity of the β2AR, identifying Ser2075.46 as the residue most differentially affected by agonists and blockers (vide infra, third subsection of results).24
Figure 1.
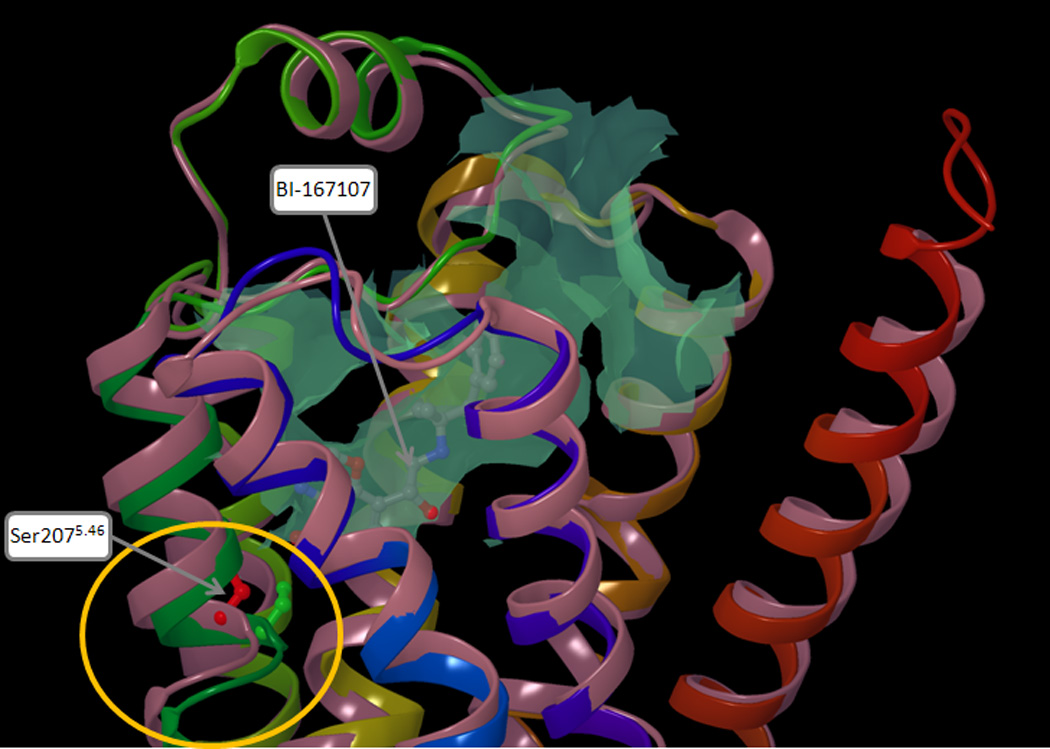
Superimposition of two crystal structures of the β2AR, one reflecting an inactive state of the receptor (PDB ID: 2RH1), the other reflecting an activated state of the receptor (PDB ID: 3P0G). The protein backbone is schematically represented as a cartoon, colored in pink for 2RH1 and with a continuum spectrum of colors ranging from red at the N-terminus to blue at the C-terminus for 3P0G. The orthosteric binding cavity, calculated for 3P0G, is represented as a turquoise colored surface. In the region lining the binding cavity, the most pronounced difference between 2RH1 and 3P0G is a displacement of a portion of TM5, centered on Ser2075.46, which in 3P0G bulges towards the center of the receptor (circled in yellow). The Cα and the side chain of the serine residue are represented as balls and sticks and it are colored in red for 2RH1 and in green for 3P0G.
Here, through a series of controlled docking experiments, we examined the implications of the use of crystal structures of the β2AR trapped in an inactive or an activated state on the in silico screening for agonists and blockers. Moreover, we explored the opportunity of combining multiple docking experiments, each of which targeting a different crystal structure, in order to enhance virtual screening performance. Finally, beyond crystal structures, we examined the applicability of our previously published in silico models of the agonist-bound β2AR to the identification of agonists. As mentioned, these models were constructed on the basis of a crystal structure reflecting an inactive state of the receptor, through the induced fit docking of agonists.24
As mentioned, the β2AR can signal through a variety of pathways, in a ligand-dependent manner. Throughout this paper, whenever we refer to agonists and blockers of the β2AR, we refer to compounds capable of stimulating or blocking receptor-mediated Gs activation.
Methods
GPCR residue identifiers
Throughout this article, amino acid residues are designated not only with their residue number in the β2AR sequence but also with a superscript extension containing the GPCR residue identifier.25,26 According to this system, in an alignment of multiple GPCR sequences, each column of aligned residues, shares the same residue identifier. To a reference position of each TM, usually occupied by a residue highly conserved across GPCRs, was assigned by convention the identifier X.50, where X is the TM number. The remaining residues in the TM are then numbered relatively to the reference. In the β2AR, the reference residues correspond to: Asn511.50, Asp792.50, Arg1313.50, Trp1584.50, Pro2115.50, Pro2886.50, Pro3237.50.
Datasets of ligands and decoys
The dataset of β2AR ligands used in this study was composed of 30 agonists and 30 blockers with pKi values above 5, which we had collected from the literature in a previous work.27,28 Note that in this work we substituted the low affinity agonist norepinephrine, for which some articles report a pKi value lower than 5,29,30 with the high affinity BI-167107, i.e. the agonist co-crystallized with the β2AR in the nanobody complex (PDB ID: 3P0G).22 The chemical structures of the compounds and their molecular weights are shown in the supplementary Table S1. All compounds are based on two general scaffolds (Figure 2). A β-hydroxyl group, present in all compounds with the exception of the agonists adrenalone and dobutamine, generates a chiral center on the carbon atom in β position with respect to the protonated amine. The most potent stereoisomers of the compounds based on scaffold a and scaffold b feature the β-carbon in the R and the S configuration, respectively. The change in the label of the chiral center, however, does not reflect a change in geometry, but is merely a nomenclature issue due to the change in the priorities of the substituents on the chiral center. All compounds were docked in their most potent stereoisomeric configuration. For a few compounds, alternative stereoisomeric configurations were also docked. The configuration of the chiral centers of these alternative stereoisomers are clearly labeled in the Table S1 and Table 1. We classified as agonists all compounds with an efficacy at least equal to 15% of that measured for the full agonist isoproterenol (measured over the basal value), including partial agonists and full agonists, while we classified as blockers all the remaining compounds, including very weak partial agonists, neutral antagonists and inverse agonists.
Figure 2.
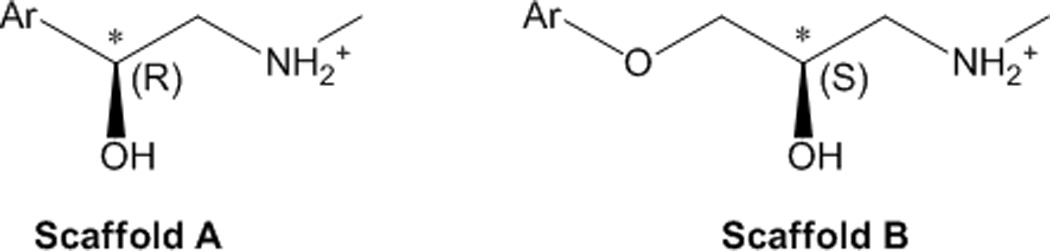
The chemical scaffolds on which the 60 β2AR ligands object of this study are based. All agonists and 17% of the blockers (namely AH-3474A, dichloroisoproterenol, labetalol, pronethanol and sotalol) are based on scaffold a; the remaining 83% of the blockers is based on scaffold b. Due to a change in the priorities of the substituents on the β-carbon (indicated with an asterisk), the most potent stereoisomers of the compounds based on scaffold a and scaffold b feature this chiral center in the R and the S configuration, respectively.
Table 1.
Docking score obtained by the 60 studied ligands when targeting the crystal structures 2RH1, 3NYA, 3PDS and 3P0G. Agonists are colored in green; blockers are colored in red.
| 2RH1 | 3NYA | 3PDS | 3P0G | ||||
|---|---|---|---|---|---|---|---|
| Compound name | Docking score |
Compound name | Docking score |
Compound name | Docking score |
Compound name | Docking score |
| Nebivolol (RSSR) | −10.751 | Bucindolol | −9.389 | BI-167107 | −10.550 | BI-167107 | −11.140 |
| Carazolol | −10.551 | Zinterol | −9.358 | Formoterol | −10.037 | SKF-42090 | −10.657 |
| Nebivolol (RSSS) | −10.289 | Nadolol (RRS) | −9.206 | Nebivolol (SRRR) | −9.885 | Formoterol | −10.572 |
| Carvedilol | −10.281 | Nebivolol (RSSR) | −9.162 | T-0509 | −9.813 | Fenoterol | −10.484 |
| Bucindolol | −9.857 | Carazolol | −9.162 | Procaterol | −9.802 | Cimaterol | −9.991 |
| Nebivolol (SRRR) | −9.842 | BI-167107 | −8.946 | Fenoterol | −9.719 | SKF-56301 | −9.958 |
| Nebivolol (SSSS) | −9.642 | Propranolol | −8.811 | Nebivolol (RSSR) | −9.630 | Zinterol | −9.950 |
| Pindolol | −9.042 | CGP12177 | −8.792 | Labetalol | −9.628 | Terbutaline | −9.902 |
| BI-167107 | −9.037 | Fenoterol | −8.773 | Zinterol | −9.542 | SKF-42469 | −9.825 |
| Propranolol (R) | −9.035 | Formoterol | −8.622 | Sulfonterol | −9.537 | Du-28663 | −9.644 |
| Pronethalol | −8.924 | Pronethalol | −8.573 | Nebivolol (SSSS) | −9.441 | Orciprenaline | −9.638 |
| Propranolol | −8.919 | Nebivolol (RSSS) | −8.513 | Salbutamol | −9.139 | AH-3021 | −9.631 |
| Nebivolol (SRRS) | −8.881 | ICI-118551 | −8.481 | Dobutamine | −8.963 | AH-3474A | −9.487 |
| Clenbuterol | −8.840 | Bupranolol | −8.476 | CGP-12177 | −8.959 | Clenbuterol | −9.436 |
| Zinterol | −8.793 | Nebivolol (SRSS) | −8.444 | Nebivolol (SRSS) | −8.948 | Salbutamol | −9.424 |
| Dobutamine | −8.677 | ICI-89406 | −8.385 | Bucindolol | −8.927 | Procaterol | −9.412 |
| Xamoterol | −8.671 | Nebivolol (SSSS) | −8.324 | Nebivolol (RRSS) | −8.921 | Du-21117 | −9.408 |
| Labetalol | −8.645 | Nebivolol (RRSS) | −8.319 | AH-3021 | −8.876 | C-78 | −9.252 |
| CGP-12177 | −8.641 | Pindolol | −8.311 | Pronethalol | −8.860 | Terbutylnorsynephrine | −9.234 |
| SKF-42090 | −8.557 | Procaterol | −8.260 | Xamoterol | −8.824 | NAB-277 | −9.143 |
| Nebivolol (RRSS) | −8.546 | Timolol | −8.209 | SKF-42090 | −8.789 | T-0509 | −9.079 |
| NAB-277 | −8.535 | Sulfonterol | −8.206 | Carvedilol | −8.782 | Isoproterenol | −9.043 |
| Nebivolol (SRSS) | −8.433 | Labetalol | −8.163 | Nebivolol (RSSS) | −8.743 | Ritodrine | −9.026 |
| AH-3474A | −8.381 | Bevantolol | −8.146 | Dichloroisoproterenol | −8.719 | Dobutamine | −8.962 |
| Fenoterol | −8.368 | Nebivolol (SRRR) | −8.144 | AH-3474A | −8.631 | Isopropylnorsynephrine | −8.956 |
| Sulfonterol | −8.353 | Dobutamine | −8.116 | Propranolol (R) | −8.614 | Xamoterol | −8.856 |
| Formoterol | −8.339 | Carvedilol | −8.079 | NAB-277 | −8.580 | Epinephrine | −8.685 |
| Dichloroisoproterenol | −8.279 | Xamoterol | −8.077 | Clenbuterol | −8.568 | Pronethalol | −8.545 |
| Timolol | −8.115 | Dichloroisoproterenol | −8.067 | SKF-56301 | −8.540 | Nebivolol (SSSS) | −8.483 |
| ICI-118551 | −8.091 | Cimaterol | −8.019 | Cimaterol | −8.518 | Isoproterenol (S) | −8.414 |
| Nadolol (RRS) | −8.046 | Clenbuterol | −7.910 | Carazolol | −8.453 | Labetalol | −8.400 |
| Bupranolol | −8.044 | NAB-277 | −7.878 | SKF-42469 | −8.450 | Adrenalone | −8.267 |
| Bevantolol | −8.005 | T-0509 | −7.852 | Sotalol | −8.394 | Nebivolol (SRSS) | −8.256 |
| Cimaterol | −7.983 | Propranolol (R) | −7.807 | Nadolol (RRS) | −8.360 | Carvedilol | −7.911 |
| Procaterol | −7.939 | SKF-42090 | −7.776 | C-78 | −8.321 | CGP-12177 | −7.823 |
| T-0509 | −7.935 | AH-3474A | −7.573 | Propranolol | −8.321 | Sulfonterol | −7.693 |
| Acebutolol | −7.755 | C-78 | −7.445 | Du-28663 | −8.293 | Bucindolol | −7.667 |
| Terbutaline | −7.735 | Sotalol | −7.444 | Terbutylnorsynephrine | −8.273 | Nebivolol (RRSS) | −7.660 |
| Isoproterenol (S) | −7.713 | Salbutamol | −7.386 | Bupranolol | −8.121 | Nebivolol (SRRR) | −7.657 |
| Salbutamol | −7.649 | AH-3021 | −7.331 | Terbutaline | −8.066 | Dichloroisoproterenol | −7.629 |
| C-78 | −7.527 | Ritodrine | −7.261 | Du-21117 | −8.053 | ICI-89406 | −7.626 |
| AH-3021 | −7.494 | SKF-42469 | −7.245 | Isopropylnorsynephrine | −8.005 | Propranolol (R) | −7.541 |
| SKF-56301 | −7.449 | Isoproterenol | −7.240 | Isoproterenol | −7.996 | Propranolol | −7.500 |
| Du-28663 | −7.362 | NIP | −7.225 | Timolol | −7.933 | Nebivolol (RSSS) | −7.449 |
| SKF-42469 | −7.345 | SKF56301 | −7.142 | Nebivolol (SRRS) | −7.907 | Bevantolol | −7.365 |
| Terbutylnorsynephrine | −7.256 | Terbutaline | −7.136 | Pindolol | −7.803 | Nebivolol (RSSR) | −7.302 |
| Alprenolol | −7.193 | Isoproterenol-S | −7.109 | Isoproterenol (S) | −7.714 | ICI-118551 | −7.188 |
| Du-21117 | −7.170 | Orciprenaline | −7.083 | Epinephrine | −7.707 | Timolol | −7.153 |
| ICI-89406 | −7.137 | Du-21117 | −7.034 | ICI-89406 | −7.701 | Broxaterol | −7.052 |
| Isoproterenol | −7.124 | Du-28663 | −7.006 | Orciprenaline | −7.685 | Pindolol | −6.811 |
| Orciprenaline | −7.113 | Nebivolol (SRRS) | −6.995 | Bevantolol | −7.579 | Nebivolol (SRRS) | −6.803 |
| Sotalol | −7.107 | Terbutylnorsynephrine | −6.938 | ICI-118551 | −7.450 | Nadolol (RRS) | −6.781 |
| Isopropylnorsynephrine | −7.066 | Isopropylnorsynephrine | −6.936 | Adrenalone | −7.414 | NIP | −6.647 |
| Epinephrine | −6.947 | Epinephrine | −6.594 | Ritodrine | −7.376 | Sotalol | −6.544 |
| NIP | −6.936 | Broxaterol | −6.442 | NIP | −6.986 | Bupranolol | −6.025 |
| Adrenalone | −6.839 | Adrenalone | −6.113 | Broxaterol | −6.493 | Carazolol | −5.304 |
| Broxaterol | −6.805 | Cicloprolol | −5.785 | Cicloprolol | −6.007 | Alprenolol | −4.893 |
| Ritodrine | −6.621 | Alprenolol | −5.396 | Acebutolol | −5.196 | Cicloprolol | −4.376 |
| Cicloprolol | −6.571 | Acebutolol | −3.856 | Alprenolol | −5.129 | Acebutolol | −4.303 |
| Metopropol (H-87) | −6.094 | Metopropol (H-87) | −3.269 | Metopropol (H-87) | −4.266 | Metopropol (H-87) | −3.203 |
The dataset of decoys used in the controlled virtual screening experiments was composed of 55806 diverse compounds, presumably inactive at the β2AR, which we had extracted from the ZINC Database31 in a previous work.28
Ligands and decoys were subjected to an automatic preparation process, performed with the LigPrep tool of the Schrödinger package,32 generating all protonation and tautomeric states available within a pH range of 7.0 ± 2.0 through the Epik engine.33,34 For each compound, the most probable state was then used for further studies.
Preparation of the β2AR structures for the docking experiments
The coordinates of four crystal structures of the β2AR (PDB ID: 2RH1, 3NYA, 3PDS and 3P0G) were retrieved from the RCSB Protein Data Bank (http://www.rcsb.org). The induced fit in silico models of the agonist-bound β2AR were constructed by us in a previous work.24 Crystal structures and in silico models were subjected to the Protein Preparation Wizard workflow implemented in the Schrödinger package.35 This added hydrogens, which were subsequently minimized using the OPLS 2005 force field and the Impact molecular mechanics engine, while heavy atoms were held rigid. Furthermore, it optimized the protonation state of His residues and the orientation of hydroxyl groups, Asn residues, and Gln residues. A cubic docking grid was then generated through the Glide module of the Schrödinger package.36 The grid was centered on Val114, and was given a dimension sufficient to accommodate compounds with a length ≤ 15 Å. The ligand-midpoint box was given a side of 10 Å. No scaling factors were applied to the van der Waals (vdW) radii of the receptor atoms.
The 3PDS crystal structure features an irreversible agonist bound to a substituted cysteine residue. Prior to the construction of the grid for the docking experiments docking experiments, the covalently bound ligand was deleted from the 3PDS structure and the Cys93 residue was mutated to the native His93.
Molecular Docking
Molecular docking experiments were carried out through the Glide module of the Schrödinger package,36 granting full flexibility to the ligands but treating the receptor as a rigid structure. A scaling factor of 0.8 was applied to the non polar atoms of the ligands, defined as those with a partial charge lower than 0.15 e. The SP (Standard Precision) scoring functions of Glide was used. A post-docking minimization, in which only the ligands were flexible, was performed on the top scoring 25 poses of each compound. Only the resulting top scoring pose was retained for further studies. For the receptor ensemble docking (RED) experiments, the output of single docking runs was combined into a unique list that was sorted according to docking score. Subsequently, for each compound only the highest scoring instance was retained.
Statistical analyses
The linear discriminant analyses (LDA) were carried out with the STATISTICA 8.0 package.37 The LDA models were based on the posterior classification probability of the cases, and their quality was tested analyzing Wilks’ lambda, Fisher’s ratio (F) and significance (p). The receiver operating characteristic (ROC) analyses were performed with the Molecular Operating Environment (MOE).38 The hit rate and enrichment of actives the within the top scoring x% of the screened dataset, ranked according to docking score, were calculated according to the following formulas:
where: EF = enrichment factor; DS = entire dataset; HR = hit rate; N = number of.
Results
We subjected 60 ligands of the β2AR, specifically 30 agonists and 30 blockers, to molecular docking experiments targeting four crystal structures of the receptor. Specifically, we targeted the original crystal structure solved in complex with carazolol (PDB ID: 2RH1)18,19 and the subsequent structures solved in complex with the neutral antagonist alprenalol (PDB ID: 3NYA),20 the irreversible agonist FAUC50 (PDB ID: 3PDS),21 and the full agonist BI-167107 (PDB ID: 3P0G).22 As mentioned, despite the covalently bound irreversible agonist, the 3PDS structure was likely crystallized in an inactive conformation. On the contrary, because of the co-crystallized nanobody, the 3P0G structure is likely to approximate well the conformation of the receptor in its G protein-activating state.
As shown in Figure 2, all of the studied ligands are based on two general scaffolds with a protonated amine separated from an aromatic ring by two carbon atoms (scaffold a) or three carbon and one oxygen atoms (scaffold b). All agonists are based on scaffold a. Conversely, blockers are generally based on scaffold b, the only exception being the compounds AH-3474A, dichloroisoproterenol, labetalol, pronethanol and sotalol that are based on scaffold a.
Preferential in silico recognition of agonists or blockers
After docking, all compounds were sorted on the basis of their docking score, from most favored to least favored (Table 1). The results were then analyzed by means of receiver operating characteristic (ROC) analyses, treating agonists as positives and blockers as negatives (Figure 3). After plotting the true positive fraction on the y-axis and the true negative fraction on the x-axis, for an ideal docking experiment that prioritized all agonists versus blockers the ROC analysis would yield a rectangular curve passing through the upper left corner of the plot, with an area under the curve (AUC) of 1. Conversely, for an ideal docking experiment that prioritized all blockers versus agonists the ROC analysis would yield a rectangular curve passing through the lower right corner of the plot, with an AUC of 0. Finally, an experiment incapable of distinguishing agonists from blockers would yield a diagonal curve with an AUC of 0.5.
Figure 3.
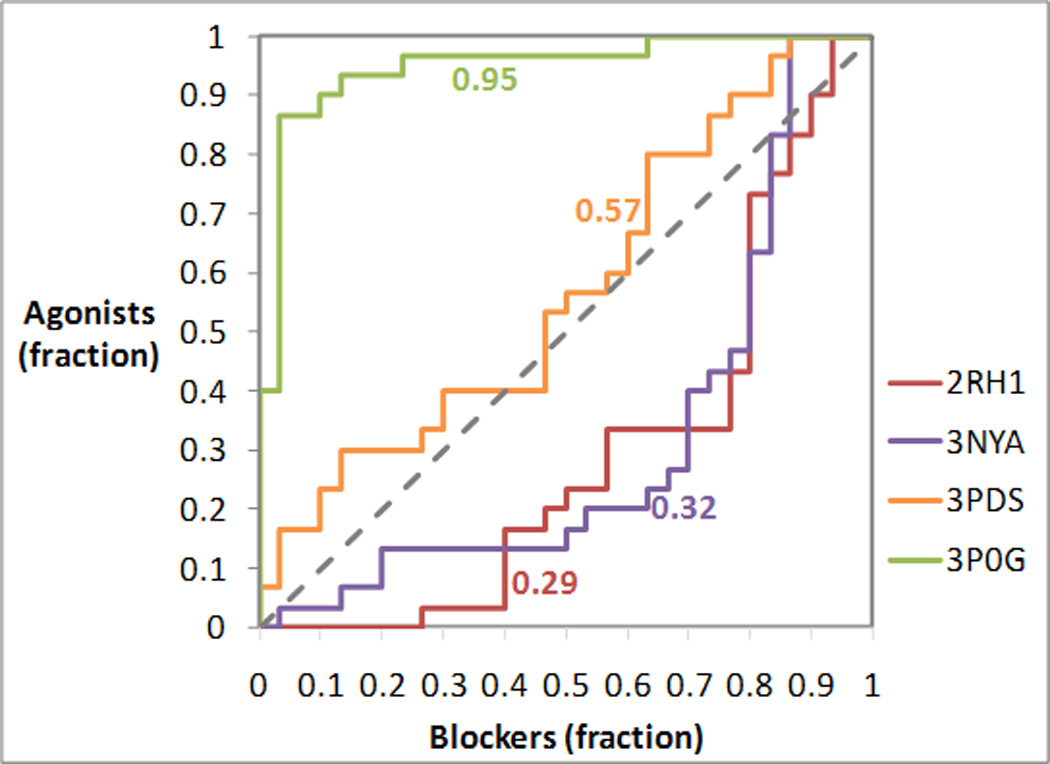
Analysis of the prioritization of agonists and blockers in docking experiments targeting different crystal structures of the β2AR. The receiver operating characteristic (ROC) curves were obtained treating agonists as positives and blockers as negatives. The area under each ROC curve (AUC) is indicated next to each of the curve. For an ideal docking experiment that prioritized all agonists versus blockers, the ROC analysis would yield a rectangular curve passing through the upper left corner of the plot, with an AUC of 1. Conversely, for an ideal docking experiment that prioritized all blockers versus agonists, the ROC analysis would yield a rectangular curve passing through the lower right corner of the plot, with an AUC of 0. Finally, an experiment incapable of distinguishing agonists from blockers would yield a diagonal curve with an AUC of 0.5.
As it is evident from Figure 3, the ligand co-crystallized with the receptor and the activation state captured by the crystal structures have a substantial impact on the preferential recognition of agonists and blockers. In particular, the inverse agonist-bound 2RH1 and the neutral-antagonist bound 3NYA structures are both biased towards the recognition of blockers, with the bias being slightly more pronounced for 2RH1. The irreversible-agonist bound 3PDS structure, putatively trapped in an inactive state, shows an almost neutral preference for agonists or blockers, which is suggestive of an intermediate conformation. Finally, the full agonist bound 3P0G structure, putatively stabilized by the nanobody in a Gs activating conformation, shows a very pronounced bias towards agonists.
Furthermore, we compared the docking score obtained by each ligand when targeting the activated 3P0G structure or the inactive 2RH1 structure. Specifically, we calculated the difference between the docking scores obtained when targeting 3P0G and 2RH1 (ΔScore). Remarkably, when the ligands were ranked according to their ΔScore, the ROC analysis showed an excellent discriminatory power, with an AUC of 0.98 (Figure 4a). Moreover, a linear discriminant analysis (LDA) indicated that 97% of the agonists (29 out of 30) scored better when docked at the activated 3P0G structure, while 93% of blockers (28 out of 30) scored better when docked at the inactive 2RH1 structure (Figure 4b). The only outlier among the agonists was the partial agonist sulfonterol, which was misdocked at the 3P0G but not at the 2RH1 structure. The two outliers among the blockers are the compounds AH-3474A and ICI-89406. Notably, the most pronounced of the three outliers, i.e. AH-3474A, is one of the five blockers that are based on an agonist-like scaffold. Both compounds were docked correctly at the 3P0G and the 2RH1 structures.
Figure 4.
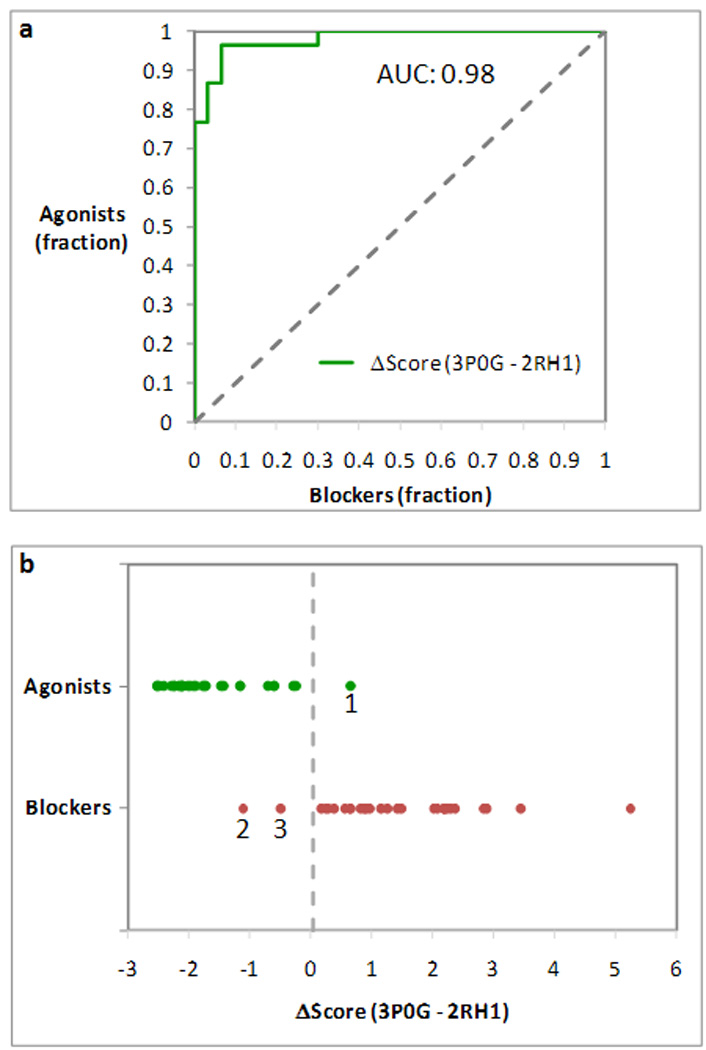
Analysis of the difference between the docking scores obtained when targeting activated 3P0G structure or the inactive 3RH1 structure (ΔScore). (a) Receiver operating characteristic (ROC) curve obtained treating agonists as positives and blockers as negatives, after sorting the compounds on the basis of their ΔScore. The ROC analysis showed an excellent discriminatory power for ΔScore, with an area under the curve (AUC) of 0.98. (b) Plot of the ΔScore measured for agonists (in green) and blockers (in red). 97% of the agonists (29 out of 30) scored better when docked at 3P0G, while 93% of the blockers (28 out of 30) scored better when docked at 3RH1. The only outlier among the agonists is sulfonterol (1). The two outliers among the blockers are the compounds AH-3474A (2) and ICI-89406 (3). A linear discriminant analysis (LDA) placed the ideal watershed for the separation of agonists and blockers at 0.03 kcal/mol (Wilks’ lambda: 0.33; F (1,58): 119.33; p: 1.06*10−15).
It is worth noting that the ability of the docking experiments to preferentially recognize agonists or blockers cannot be merely attributed to the molecular weight of the compounds. As a control, we performed an LDA based only on molecular weight and obtained a poor separation of agonists and blockers (Figure 5).
Figure 5.
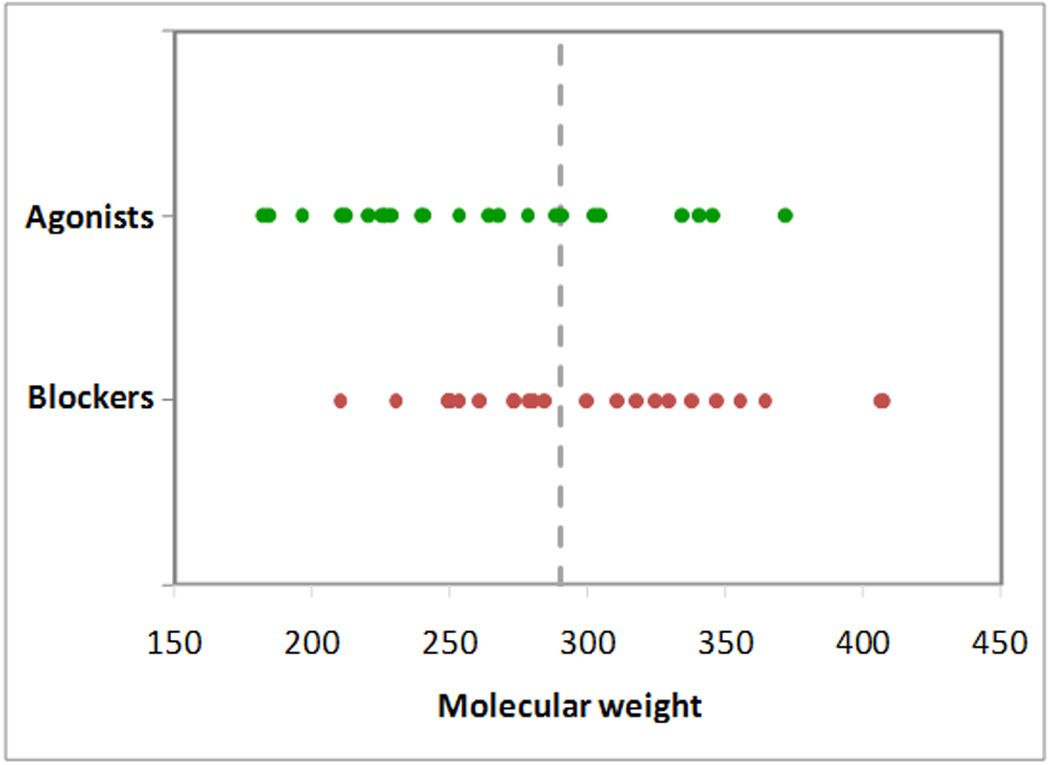
Molecular weight is not a good parameter to separate agonists (in green) and blockers (in red). A linear discriminant analysis (LDA) placed the ideal watershed for the separation of agonists and blockers on the basis of their molecular weight at 290.06 Dalton (Wilks’ lambda: 0.80; F (1,58): 14.67; p: 0.0003). This yielded the correct classification of only 70% of agonists (21 out of 30) and 57% of blockers (17 out of 30).
Targeting of one or more crystal structures in docking-based virtual screening
In addition to the 60 ligands, we docked to the four crystal structures a pool of ~60,000 decoys, i.e. diverse compounds extracted from the ZINC database that are presumably inactive at the β2AR.24 Through ROC analyses, conducted treating ligands as positives and decoys as negatives, we then studied the ability of the docking-based virtual screening experiments to distinguish ligands from non-binders. The results are also thoroughly illustrated in Table 2 and Table 3, where, for the 0.1% and 1% top scoring portion of the screened dataset, we report number and percentage of retrieved active compounds, hit rates and enrichment factors.
Table 2.
Analysis of the top scoring 0.1% of the docked compounds (56 compounds), reporting number and percentage of retrieved ligands, hit rate and enrichment factor (EF).
|
Ligands | ||||
|
Retrieved |
||||
| Structure | (#) | (% of tot.) | Hit rate (%) | EF (%) |
| 2RH1 | 7 | 11.67 | 12.50 | 116.37 |
| 3NYA | 3 | 5.00 | 5.36 | 49.87 |
| 3PDS | 11 | 18.33 | 19.64 | 182.87 |
| 3P0G | 19 | 31.67 | 33.93 | 315.87 |
| RED | 17 | 28.33 | 30.36 | 282.62 |
|
Agonists | ||||
|
Retrieved |
||||
| Structure | (#) | (% of tot.) | Hit rate (%) | EF (%) |
| 2RH1 | 0 | 0.00 | 0.00 | 0.00 |
| 3NYA | 1 | 3.33 | 1.79 | 33.25 |
| 3PDS | 7 | 23.33 | 12.50 | 232.75 |
| 3P0G | 18 | 60.00 | 32.14 | 598.49 |
| RED | 11 | 36.67 | 19.64 | 365.74 |
|
Blockers | ||||
|
Retrieved |
||||
| Structure | (#) | (% of tot.) | Hit rate (%) | EF (%) |
| 2RH1 | 7 | 23.33 | 1.25 | 23.32 |
| 3NYA | 2 | 6.67 | 0.36 | 6.66 |
| 3PDS | 4 | 13.33 | 0.72 | 13.32 |
| 3P0G | 1 | 3.33 | 0.18 | 3.33 |
| RED | 6 | 20.00 | 1.07 | 19.99 |
Table 3.
Analysis of the top scoring 1% of the docked compounds (559 compounds), reporting number and percentage of retrieved ligands, hit rate and enrichment factor (EF).
|
Ligands | ||||
|
Retrieved |
||||
| Structure | (#) | (% of tot.) | Hit rate (%) | EF (%) |
| 2RH1 | 22 | 36.67 | 3.94 | 36.64 |
| 3NYA | 17 | 28.33 | 3.04 | 28.31 |
| 3PDS | 32 | 53.33 | 5.72 | 53.29 |
| 3P0G | 33 | 55.00 | 5.90 | 54.96 |
| RED | 44 | 73.33 | 7.87 | 73.28 |
|
Agonists | ||||
|
Retrieved |
||||
| Structure | (#) | (% of tot.) | Hit rate (%) | EF (%) |
| 2RH1 | 7 | 23.33 | 1.25 | 23.32 |
| 3NYA | 4 | 13.33 | 0.72 | 13.32 |
| 3PDS | 17 | 56.67 | 3.04 | 56.63 |
| 3P0G | 28 | 93.33 | 5.01 | 93.26 |
| RED | 26 | 86.67 | 4.65 | 86.60 |
|
Blockers | ||||
|
Retrieved |
||||
| Structure | (#) | (% of tot.) | Hit rate (%) | EF (%) |
| 2RH1 | 15 | 50.00 | 2.68 | 49.96 |
| 3NYA | 13 | 43.33 | 2.33 | 43.30 |
| 3PDS | 15 | 50.00 | 2.68 | 49.96 |
| 3P0G | 5 | 16.67 | 0.89 | 16.65 |
| RED | 18 | 60.00 | 3.22 | 59.96 |
The ROC curves indicated that the docking experiments conducted at all four crystal structures yielded a good prioritization of ligand versus decoys (Figure 6 – agonists and blockers respectively represented by green and red dots). The structures crystallized in complex with blockers (2RH1 and 3NYA) tended to favor blockers, although also agonists were well prioritized over decoys. Conversely, the structures crystallized in complex with agonists (3PDS and 3P0G), particularly the nanobody-stabilized structure, tended to favor agonists, although also blockers were prioritized over the decoys. This trend was confirmed by follow-up ROC analyses aimed at analyzing separately the ability of the various screening experiments to prioritize agonists versus decoys or blockers versus decoys (see AUC values reported in Figure 6). These analyses were conducted excluding from the calculations either all of the blockers or all of the agonists.
Figure 6.
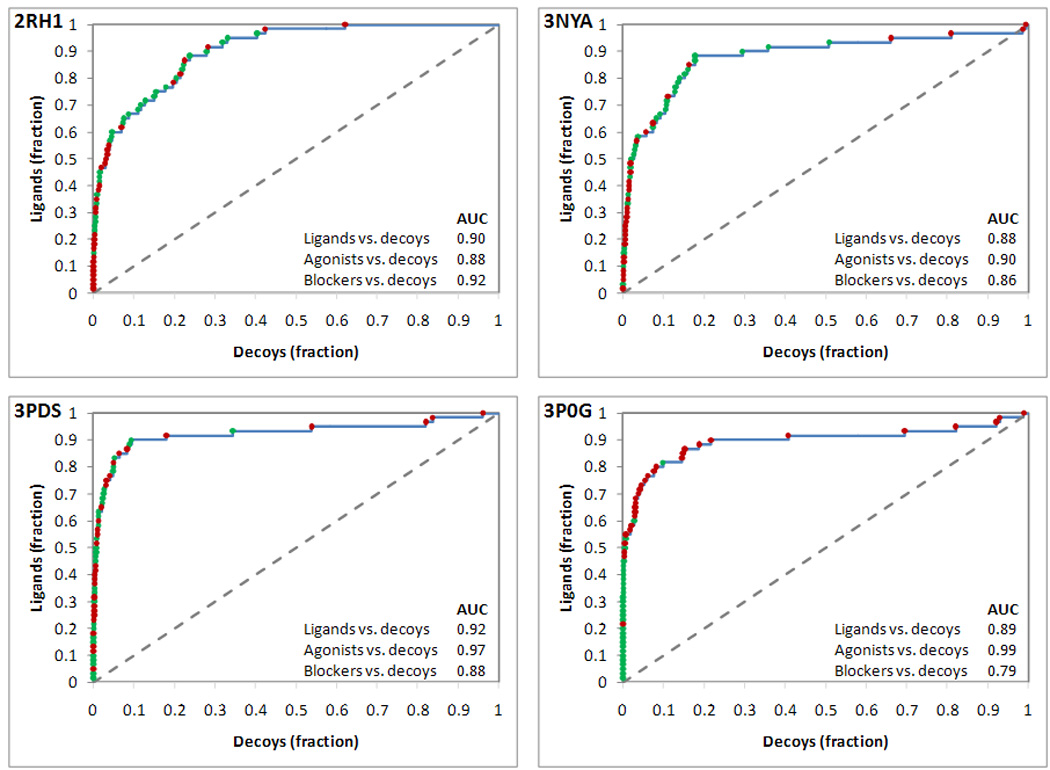
Analysis of the prioritization of ligands versus decoys in docking experiments targeting four crystal structures of the β2AR. Data points are colored in green when relative to agonists and in red when relative to blockers. The receiver operating characteristic (ROC) curves represented in the four panels were obtained treating ligands as positives and decoys as negatives. The area under each ROC curve (AUC) is reported within each panel. Additionally, AUC values calculated for ROC analyses relative to agonists versus decoys and blockers versus decoys are also reported.
We also combined the screenings conducted separately at the four crystal structure through a technique named receptor ensemble docking (RED).28,39 In our version of the RED approach, the results of n single docking experiments, each of which conducted targeting a different structure of the same receptor, are combined into a single table in which each compound will be found n times with n different scores.28 Subsequently, for each compound, only the instance that reported the most favorable score is maintained while the others are deleted from the table. As a result of this procedure, each compound is given the chance to select its preferred receptor conformation. As it is evident from Figure 7a, unlike the individual docking runs, RED resulted in excellent prioritization of both agonists and blockers over decoys, with an AUC of 0.98 for agonists and 0.91 for blockers (see also Table 2 and Table 3). Although the docking experiments targeting 3P0G and 2RH1 yielded the most efficacious prioritization of agonists versus decoys or blockers versus decoys, respectively, RED resulted in the overall best prioritization of ligands versus decoys with an AUC of 0.95 (Figure 7b–7d). Importantly, in the area comprising 0.20% to 9.5% of the top scoring screened compounds (highlighted in pale yellow in Figure 7), more true ligands can be identified with RED than with any of the single docking runs.
Figure 7.
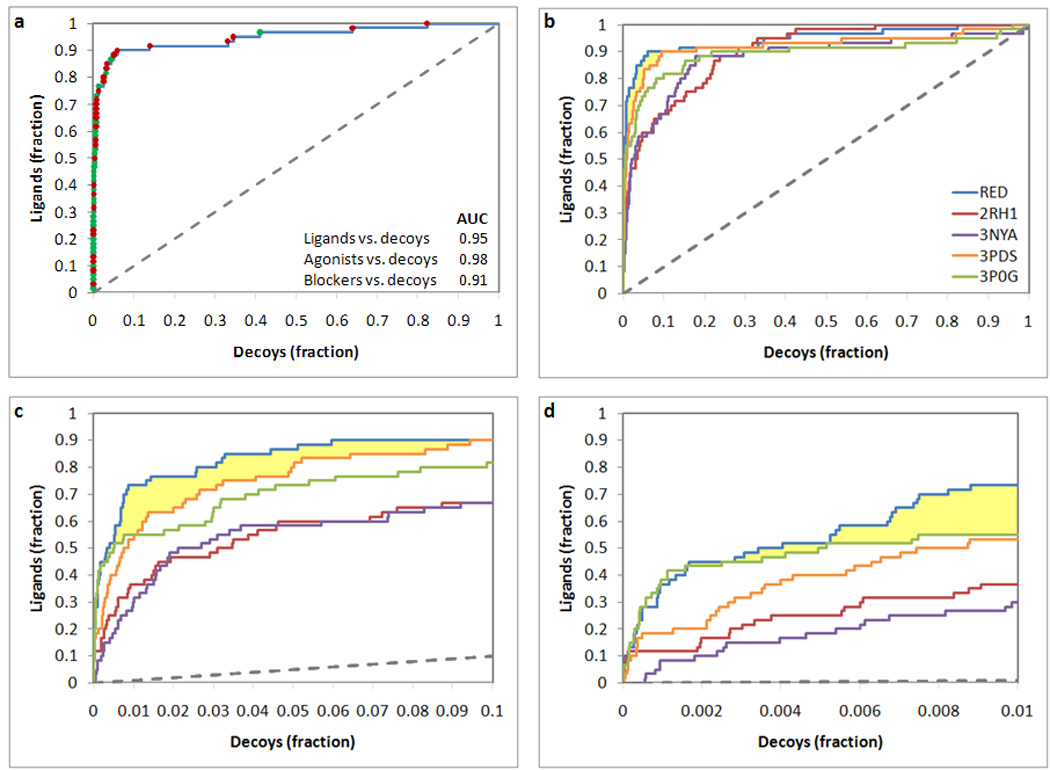
Analysis of the prioritization of ligands versus decoys in receptor ensemble docking (RED) resulting from the combination of docking experiments conducted at four crystal structures of the β2AR. (a) Receiver operating characteristic ROC analysis relative to the receptor ensemble docking, obtained treating ligands as positives and decoys as negatives. Data points are colored in green when relative to agonists and in red when relative to blockers. The area under the ROC curve (AUC) is reported. (b–d) Synoptic view of the ROC analysis relative to the RED experiment together with those relative to the docking experiments based on the four individual structures. The entire curve is represented in panel b, while enlargements of the top scoring portion of the screened database are represented in panels c and d. The area where RED performed better than any of its individual components is highlighted in pale yellow.
Preferential recognition of agonists by induced fit models of the agonist-bound receptor
We recently published molecular models of the β2AR in complex with agonists. These models were constructed docking the ligands to the inverse agonist-bound 2RH1 structure through an induced fit protocol that allows flexibility to both the ligands and the ligand-binding cavity of the receptor.24 Applied in tandem with statistical analyses, these induced fit models provided a picture of the conformational changes caused by agonists to the ligand-binding cavity of the receptor that resulted strikingly accurate in light of the experimentally elucidated structure of the activated state of the receptor (Figure 8; vide infra, discussion).
Figure 8.
Superimposition of an induced fit model of the isoproterenol-bound β2AR, with: (a) the crystal structure an inactive state of the receptor (PDB ID: 2RH1); and (b) the crystal structure an activated state of the receptor (PDB ID: 3P0G). The induced fit model, which was constructed docking isoproterenol to the 2RH1 structure,24 approximates very well the local conformational change that the segment of TM5 centered on Ser2075.46 undergoes when transitioning from the inactive to the activated state (circled in yellow). The Cα and the side chain of the serine residue is represented as balls and sticks and it is colored in red for 2RH1, in green for 3P0G and in gray for the induced fit model. The protein backbone is schematically represented as a cartoon. The 2RH1 structure in panel a and the 3P0G structure in panel b are colored in pink. In both panels, the induced fit model of the isoproterenol-bound β2AR is colored with a continuum spectrum of colors ranging from red at the N-terminus to blue at the C-terminus.
Here we analyzed the tendency of these induced fit models of the agonist-bound β2AR to recognize preferentially agonists or blockers. Specifically, we docked the same pool of 60 ligands to the top scoring induced fit complexes obtained for three prototypical full agonists, namely epinephrine, isoproterenol and fenoterol. Subsequently, we plotted ROC curves analogous to those shown in Figure 3, treating agonists as positives and blockers as negatives. Although the three models were constructed on the basis of a crystal structure that reflects the inactive state of the receptor, the conformation induced by the docking of agonist conferred to the screening a marked selectivity for agonists in all three cases, with ROC curves approaching the one obtained with the nanobody-stabilized 3P0G structure (Figure 9a). Moreover, in analogy with what described in previous subsection, we combined through the RED approach the individual docking experiments based on the three induced fit models of the agonist-bound receptor, obtaining an even more pronounced selectivity for agonists (Figure 9b).
Figure 9.
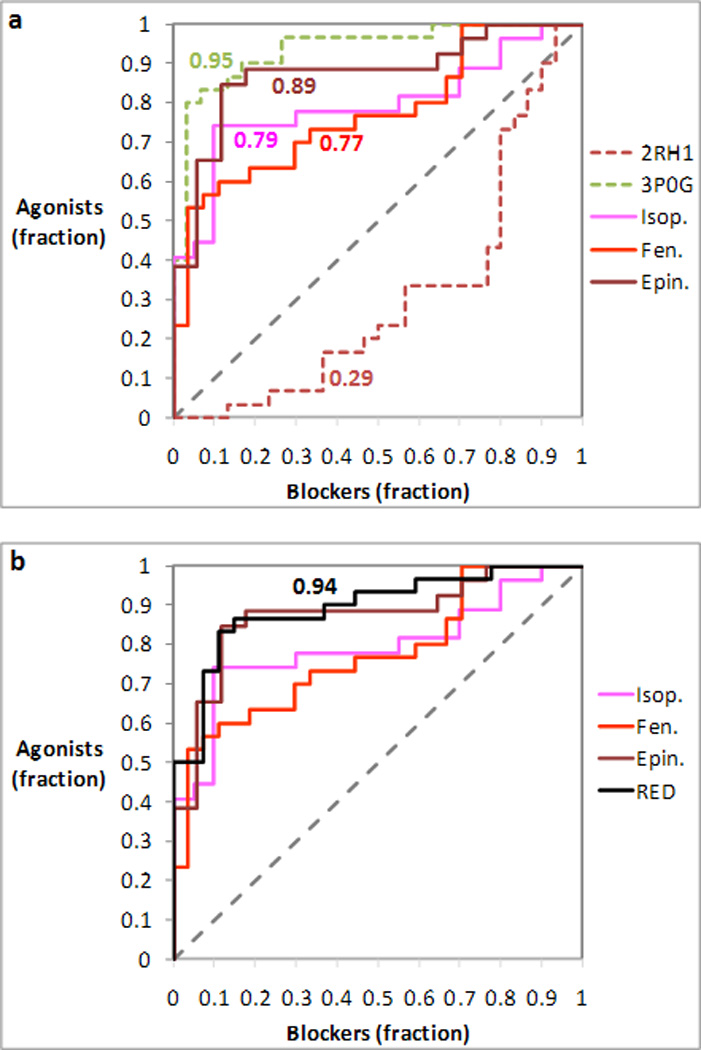
Analysis of the prioritization of agonists and blockers in docking experiments targeting three induced fit models of the agonist-bound β2AR based on the inactive structure of the receptor (PDB ID: 2RH1). The receiver operating characteristic (ROC) curves were obtained treating agonists as positives and blockers as negatives. The area under each ROC curve (AUC) is indicated next to each of the curves. (a) The three ROC curves obtained for the induced fit models are compared with those obtained for the inactive 2RH1 and the activated 3P0G structure of the receptor. (b) The ROC curve resulting from the combination of the docking experiments targeting the three induced fit models through receptor ensemble docking (RED) is compared with those resulting from the three individual docking experiments.
It has to be noted that, unlike the crystal structures, the three in silico models that we tested did not yield docking poses for all of the ligands but failed to dock the compounds with the highest molecular weights. Specifically: the model based on epinephrine (MW 184.82) did not yield poses for 13 of the 17 heaviest blockers and 4 of the 5 heaviest agonists; the model based on isoproterenol (MW 212.27) did not yield poses for 10 of the 16 heaviest blockers and the 3 heaviest agonists; the model based on fenoterol (MW 304.37) did not yield poses for the heaviest blocker and two isomers of the second heaviest blocker (Table 4). For a list of all the compounds included in the study with their molecular weight, see the supplementary Table S1.
Table 4.
List of compounds for which the applied docking procedure did not yield docking poses when targeting three induced fit models of the agonist bound β2AR based on the inactive structure of the receptor (PDB ID: 2RH1). Agonists are colored in green; blockers are colored in red.
| 2RH1-epinephrine | 2RH1-isoproterenol | 2RH1-fenoterol | |||
|---|---|---|---|---|---|
| Ligand | MW | Ligand | MW | Ligand | MW |
| Carazolol | 299.40 | Nadolol (RRS) | 310.42 | Nebivolol (RSSS) | 406.45 |
| Cicloprolol | 324.44 | Formoterol | 345.42 | Nebivolol (SRSS) | 406.45 |
| T-0509 | 334.40 | Bucindolol | 364.47 | Carvedilol | 407.49 |
| Xamoterol | 340.40 | BI-167107 | 371.46 | ||
| Bevantolol | 346.45 | Zinterol | 378.49 | ||
| ICI-89406 | 355.42 | Nebivolol (RRSS) | 406.45 | ||
| Bucindolol | 364.47 | Nebivolol (RSSR) | 406.45 | ||
| BI-167107 | 371.46 | Nebivolol (RSSS) | 406.45 | ||
| Zinterol | 378.49 | Nebivolol (SRRR) | 406.45 | ||
| Nebivolol (RRSS) | 406.45 | Nebivolol (SRRS) | 406.45 | ||
| Nebivolol (RSSR) | 406.45 | Nebivolol (SRSS) | 406.45 | ||
| Nebivolol (RSSS) | 406.45 | Nebivolol (SSSS) | 406.45 | ||
| Nebivolol (SRRR) | 406.45 | Carvedilol | 407.49 | ||
| Nebivolol (SRRS) | 406.45 | ||||
| Nebivolol (SRSS) | 406.45 | ||||
| Nebivolol (SSSS) | 406.45 | ||||
| Carvedilol | 407.49 | ||||
Discussion
The three-dimensional structure of GPCRs has been historically elusive.40 However, a number of technical and scientific breakthroughs brought to the recent solution of the crystal structure of a few of the members of the superfamily.41,42 Such detailed structural information provides a very valuable basis for rational structure-based drug discovery campaigns, allowing for an effective identification of novel ligands of the receptors in question through virtual screening.27,28,42–49 Moreover, the experimentally solved structures also serve as a platform to calibrate and further the accuracy of theoretical models derived from homology modeling and molecular docking.28,47–52
Through this work, we studied the implications of the availability of multiple structures of the β2AR, some reflecting the inactive and some the activated state of the receptor, on the in silico recognition of agonists and blockers and on virtual screening. Specifically, we analyzed four different structures of the receptor solved in the presence of the inverse agonist carazolol (PDB ID: 2RH1),18,19 the neutral antagonist alprenolol (PDB ID: 3NYA),20 the covalently bound irreversible agonist FAUC50 (PDB ID: 3PDS),21 and the diffusible full agonist BI-167107 (PDB ID: 3P0G).22 Of note, the structure solved with the covalently bound irreversible agonist was trapped in a conformation that closely resembles the inactive state of the receptor. On the contrary, the one solved in complex BI-167107 is likely to approximate closely an activated conformation, thanks to the help of a nanobody derived from a camelid antibody that acted as a G protein surrogate.
Our controlled docking experiments revealed a marked tendency for the preferential recognition of agonists over blockers by the nanobody-stabilized structure of the receptor (Figure 3 and Table 1). In other words, when docked at the 3P0G structure, agonists tended to receive more favorable docking scores than blockers. Vice versa, the structures solved in complex with the inverse agonists carazolol and the neutral antagonist alprenolol showed a preference for the recognition of blockers (Figure 3 and Table 1). This, however, was not as pronounced as the preference for agonists displayed by the nanobody-stabilized complex. This difference is probably due to the shrinkage of the distance between TM3 and TM5 that occurs within the binding pocket upon activation – specifically, the distance between the Cα carbons of Ser2075.46 and Asp1133.32 goes from 12.2 Å in the inactive 2RH1 structure to 11.4 Å in the activated 3P0G structure. This conformational change confers a particularly prominent selectivity for agonists to the nanobody-stabilized structure, because the portion of the ligands that binds between TM3 and TM6 is generally larger in blockers than agonists. As a result, blockers do not fit to well into the nanobody-stabilized structure, thus scoring substantially worse than agonists (Table 1). Conversely, because of the larger distance between TM3 and TM5 found in the ligand-binding cavity of inactive structures, the latter can accommodate well both blockers and agonists. Blockers provide a better fit between the two TMs and, thus, score somewhat better than agonists. It is also worth noting the lack of selectivity for agonists or blockers displayed by the 3PDS structure solved in complex with a covalently bound agonist. This behavior suggests that the binding cavity of this structure has been trapped in an intermediate state – in the 3PDS structure, the Cα carbons of Ser2075.46 and Asp1133.32 are 11.8 Å apart.
We also studied the tendency of each single ligand to receive better scores when docked at activated or inactive structures. In particular, we calculated the difference between the docking scores obtained by each compound when docked at the nanobody-stabilized 3P0G and the inverse agonist-bound 2RH1 structures (ΔScore) – note: because docking scores are negative numbers, negative ΔScore values indicate a preference for the 3P0G structure, while positive ΔScore values indicate a preference for the 2RH1 structure. The analyses shown in Figure 3 and Figure 4 are radically different. Figure 3 refers to the ability of a given structure to prioritize agonists or blockers. Each of the ROC curves shown in Figure 3 refer to a docking experiment conducted using one structure only. The analysis shown in Figure 4, instead, refers to the ability of discriminating between agonists and blockers by checking if a molecule received a better score when docked at an activated (3P0G) or an inactive structure (2RH1). As shown in Figure 4, ΔScore is an excellent classifier for the discrimination of agonists and blockers, more so than the docking scores obtained separately at 3P0G or 2RH1. Moreover, ΔScore offers the advantage of being applicable even to the classification of a single compound. In fact, a ligand can be forecasted with a very high success rate to be an agonist or a blocker merely on the basis of a negative or positive ΔScore. Notably, for the ligands object of this study, we detected a global good classification rate of 95% (Figure 4).
Additionally, we analyzed the applicability of the four β2AR structures under study to virtual screening. In particular, we investigated the ability of docking experiments targeting these structures to prioritize ligands versus non-binders. We found that all four structures effectively prioritized both agonists and blockers over non-binders, although the inactive 2RH1 and 3NYA structures worked better for blockers while the activated 3P0G structure worked better for agonists (Figure 6 and Tables 2 and 3). The 3PDS structure performed similarly with both agonists and blockers, confirming the idea that it reflects an intermediate hybrid state of the receptor. These results suggest that, although it would be best to use activated structures when screening for agonists and inactive structures when screening for blockers, in case of necessity activated structures could be applied to the identification of blockers and inactive structures could be applied to the identification of agonists. As evident from the results shown in Figure 3 and Figure 6, virtual screening campaigns conducted on the basis of a single structure show different degrees of preference for agonists or blockers. However, they do not guarantee the exclusive retrieval of the former or the latter compounds. On the contrary, the results shown in Figure 4 suggest that a very good discrimination between agonists and blockers can be achieved with a virtual screening campaign based on the parallel targeting an activated and an inactive structure. As mentioned, the DScore emerged from this study as a very reliable classifier for the distinction of agonists and blockers (Figure 4b).
Moreover, we combined the individual screenings targeting separately the four β2AR structures object of this study through receptor ensemble docking (RED), a technique that allows each compound to select its preferred conformation of the receptor – see Results section, “targeting one or more crystal structures in docking-based virtual screening”. This approach resulted particularly effective for the prioritization of both agonists and blockers versus non-binders (Figure 7 and Tables 2 and 3), merging together the advantages displayed by each single structure. Importantly, the RED approach significantly increased the number of ligands ranked between the top 0.2% and 9.5% of the screened compounds. Besides this critical segment of the screened dataset, where it outperformed any of the screenings based on the four individual structures, the screening based on RED approached very closely the results obtained with the best of the individual screenings. The striking tendency of RED to always approach the best of its individual components was also observed when RED was applied separately to the two structures solved in complex with blockers and the two structures solved in complex with agonists (see supplementary Figure S1). This notable observation suggests that, in the absence of known ligands applicable to gauge the performance of individual screenings based on specific structures, the RED approach is the safest solution to maximize the yield of a virtual screening campaign.
Lastly, we studied the possibility of altering in silico a crystal structure that reflects an inactive state of the receptor and shift its preference towards the recognition of agonists. This is a crucial point, since it is still easier to crystallize GPCRs in an inactive than in an activated conformation. In a previous work, starting from the inactive 2RH1 structure of the receptor, we envisaged the conformational changes caused to agonists to the interhelical ligand-binding cavity of the β2AR prior to the publication of the nanobody-stabilized crystal structure of the receptor in complex with the full agonist BI-167107. The study was conducted through flexible docking – namely, Schrodinger’s Induced fit approach to flexible docking23 – applied in tandem with statistical analyses, and led to the correct identification of Ser2075.46 as the residue most differentially affected by agonists and blockers. In particular, we anticipated that binding of agonists would cause a displacement of the backbone of Ser2075.46 towards the center of the helical bundle as well as a rotation of the same residue in the counterclockwise direction, when observed from the intracellular side. As shown in Figure 8, our models of the β2AR ligand binding cavity in complex with agonists are in excellent agreement with the experimentally elucidated 3P0G structure. We also correctly anticipated that the binding of agonists would not affect the rotameric state of Trp2866.48 and would not cause the formation of contacts between the β-hydroxyl group of the ligands and Asn2936.55. Here we showed that our induced fit models of the agonist-bound conformation of the receptor successfully revert the tendency of the 2RH1 structure to prioritize blockers versus agonists and assume a behavior markedly similar to the one shown by the nanobody-stabilized 3P0G structure. Thus, given the fact that crystal structures of GPCRs seem to be more easily attainable for inactive than for activated states, our approach could be utilized to direct drug discovery campaigns towards the identification of agonists when crystal structures of the receptor under study are only available for the inactive state. Notably, even when applied to the induced fit models, the RED approach demonstrated to be quite useful, causing a more pronounced prioritization of agonists versus blockers than any of the individual models.
As a final consideration, it is worth mentioning that the identification of agonists or blockers in a virtual screening campaign is dependent on the presence of such compounds within the screened dataset. If, for a given receptor, the structural requirements for agonism are particularly strict, even a large dataset of diverse compounds may not contain agonists at all. In such a case, despite the ability of the applied technique to identify agonists, obviously no agonists would be found.
Conclusions
We analyzed the implications of the use of different crystal structures of the β2AR, reflecting different signaling states of the receptor, on the in silico screening for agonists and blockers. Our results indicate that activated structures of the receptor favor agonists over blockers while inactive structures favor blockers over agonists. This discriminatory tendency is more marked for activated than for inactive structures. We also found that agonists tend to receive more favorable docking scores when docked at activated rather than inactive structures of the receptor, while blockers do the opposite. Hence, the difference between the docking scores measured with the 3P0G structure, stabilized in the active conformation by a nanobody, and the inactive 2RH1 structure, solved in complex with the inverse agonist carazolol, is an excellent means for the classification ligands into agonists and blockers. With respect to virtual screening, all structures prioritized well agonists and blockers over non-binders, although inactive structures worked better for blockers and activated structures worked better for agonists. Notably, the combination of individual docking experiments through receptor ensemble docking (RED) resulted in an excellent performance in the retrieval of both agonists and blockers. Finally, we demonstrated that the induced fit docking of agonists is a viable way of modifying an inactive crystal structure in order to bias it towards the in silico recognition of agonists rather than blockers. This is a significant result, since for a number of GPCRs inactive but not activated structures have been solved.
Supplementary Material
Acknowledgements
This research was supported by the intramural research program of the NIH, NIDDK.
References
- 1.Pierce K, Premont R, Lefkowitz R. Nat Rev Mol Cell Biol. 2002;3(9):639–650. doi: 10.1038/nrm908. [DOI] [PubMed] [Google Scholar]
- 2.Dixon R, Kobilka B, Strader D, Benovic J, Dohlman H, Frielle T, Bolanowski M, Bennett C, Rands E, Diehl R, Mumford R, Slater E, Sigal I, Caron M, Lefkowitz R, Strader C. Nature. 1986;321(6065):75–79. doi: 10.1038/321075a0. [DOI] [PubMed] [Google Scholar]
- 3.Dohlman H, Bouvier M, Benovic J, Caron M, Lefkowitz R. J Biol Chem. 1987;262(29):14282–14288. [PubMed] [Google Scholar]
- 4.Swaminath G, Xiang Y, Lee T, Steenhuis J, Parnot C, Kobilka B. J Biol Chem. 2004;279(1):686–691. doi: 10.1074/jbc.M310888200. [DOI] [PubMed] [Google Scholar]
- 5.Yao X, Parnot C, Deupi X, Ratnala V, Swaminath G, Farrens D, Kobilka B. Nat Chem Biol. 2006;2(8):417–422. doi: 10.1038/nchembio801. [DOI] [PubMed] [Google Scholar]
- 6.Kobilka BK, Deupi X. Trends Pharmacol Sci. 2007;28(8):397–406. doi: 10.1016/j.tips.2007.06.003. [DOI] [PubMed] [Google Scholar]
- 7.Rosenbaum DM, Rasmussen SG, Kobilka BK. Nature. 2009;459(7245):356–363. doi: 10.1038/nature08144. [DOI] [PMC free article] [PubMed] [Google Scholar]
- 8.Lefkowitz RJ. J Biol Chem. 1998;273(30):18677–18680. doi: 10.1074/jbc.273.30.18677. [DOI] [PubMed] [Google Scholar]
- 9.Lefkowitz RJ, Rajagopal K, Whalen EJ. Mol Cell. 2006;24(5):643–652. doi: 10.1016/j.molcel.2006.11.007. [DOI] [PubMed] [Google Scholar]
- 10.Violin JD, Ren XR, Lefkowitz RJ. J Biol Chem. 2006;281(29):20577–20588. doi: 10.1074/jbc.M513605200. [DOI] [PubMed] [Google Scholar]
- 11.Galandrin S, Oligny-Longpre G, Bouvier M. Trends Pharmacol Sci. 2007;28(8):423–430. doi: 10.1016/j.tips.2007.06.005. [DOI] [PubMed] [Google Scholar]
- 12.Drake MT, Violin JD, Whalen EJ, Wisler JW, Shenoy SK, Lefkowitz RJ. J Biol Chem. 2008;283(9):5669–5676. doi: 10.1074/jbc.M708118200. [DOI] [PubMed] [Google Scholar]
- 13.Rajagopal S, Ahn S, Rominger DH, Gowen-McDonald W, Lam CM, Dewire SM, Violin JD, Lefkowitz RJ. Mol Pharmacol. 2011;80(3):367–377. doi: 10.1124/mol.111.072801. [DOI] [PMC free article] [PubMed] [Google Scholar]
- 14.Bockaert J, Fagni L, Dumuis A, Marin P. Pharmacol Ther. 2004;103(3):203–221. doi: 10.1016/j.pharmthera.2004.06.004. [DOI] [PubMed] [Google Scholar]
- 15.Xiao K, Sun J, Kim J, Rajagopal S, Zhai B, Villen J, Haas W, Kovacs JJ, Shukla AK, Hara MR, Hernandez M, Lachmann A, Zhao S, Lin Y, Cheng Y, Mizuno K, Ma'ayan A, Gygi SP, Lefkowitz RJ. Proc Natl Acad Sci U S A. 2010;107(34):15299–15304. doi: 10.1073/pnas.1008461107. [DOI] [PMC free article] [PubMed] [Google Scholar]
- 16.Tashkin DP, Fabbri LM. Respir Res. 2010;11:149. doi: 10.1186/1465-9921-11-149. [DOI] [PMC free article] [PubMed] [Google Scholar]
- 17.Johnson JA, Liggett SB. Clin Pharmacol Ther. 2011;89(3):366–378. doi: 10.1038/clpt.2010.315. [DOI] [PMC free article] [PubMed] [Google Scholar]
- 18.Cherezov V, Rosenbaum D, Hanson M, Rasmussen S, Thian F, Kobilka T, Choi H, Kuhn P, Weis W, Kobilka B, Stevens R. Science. 2007;318(5854):1258–1265. doi: 10.1126/science.1150577. [DOI] [PMC free article] [PubMed] [Google Scholar]
- 19.Rosenbaum D, Cherezov V, Hanson M, Rasmussen S, Thian F, Kobilka T, Choi H, Yao X, Weis W, Stevens R, Kobilka B. Science. 2007;318(5854):1266–1273. doi: 10.1126/science.1150609. [DOI] [PubMed] [Google Scholar]
- 20.Wacker D, Fenalti G, Brown MA, Katritch V, Abagyan R, Cherezov V, Stevens RC. J Am Chem Soc. 2010;132(33):11443–11445. doi: 10.1021/ja105108q. [DOI] [PMC free article] [PubMed] [Google Scholar]
- 21.Rosenbaum DM, Zhang C, Lyons JA, Holl R, Aragao D, Arlow DH, Rasmussen SG, Choi HJ, Devree BT, Sunahara RK, Chae PS, Gellman SH, Dror RO, Shaw DE, Weis WI, Caffrey M, Gmeiner P, Kobilka BK. Nature. 2011;469(7329):236–240. doi: 10.1038/nature09665. [DOI] [PMC free article] [PubMed] [Google Scholar]
- 22.Rasmussen SG, Choi HJ, Fung JJ, Pardon E, Casarosa P, Chae PS, Devree BT, Rosenbaum DM, Thian FS, Kobilka TS, Schnapp A, Konetzki I, Sunahara RK, Gellman SH, Pautsch A, Steyaert J, Weis WI, Kobilka BK. Nature. 2011;469(7329):175–180. doi: 10.1038/nature09648. [DOI] [PMC free article] [PubMed] [Google Scholar]
- 23.Sherman W, Day T, Jacobson M, Friesner R, Farid R. J Med Chem. 2006;49(2):534–553. doi: 10.1021/jm050540c. [DOI] [PubMed] [Google Scholar]
- 24.Vilar S, Karpiak J, Berk B, Costanzi S. J Mol Graph Model. 2011;29(6):809–817. doi: 10.1016/j.jmgm.2011.01.005. [DOI] [PMC free article] [PubMed] [Google Scholar]
- 25.Ballesteros JA, Weinstein H. Methods Neurosci. 1995;25:366–428. [Google Scholar]
- 26.van Rhee AM, Jacobson KA. Drug Develop Res. 1996;37(1):1–38. doi: 10.1002/(SICI)1098-2299(199601)37:1<1::AID-DDR1>3.0.CO;2-S. [DOI] [PMC free article] [PubMed] [Google Scholar]
- 27.Vilar S, Karpiak J, Costanzi S. J Comput Chem. 2010;31(4):707–720. doi: 10.1002/jcc.21346. [DOI] [PMC free article] [PubMed] [Google Scholar]
- 28.Vilar S, Ferino G, Phatak SS, Berk B, Cavasotto CN, Costanzi S. J Mol Graph Model. 2011;29(5):614–623. doi: 10.1016/j.jmgm.2010.11.005. [DOI] [PMC free article] [PubMed] [Google Scholar]
- 29.Green SA, Cole G, Jacinto M, Innis M, Liggett SB. J Biol Chem. 1993;268(31):23116–23121. [PubMed] [Google Scholar]
- 30.Hoffmann C, Leitz MR, Oberdorf-Maass S, Lohse MJ, Klotz KN. Naunyn Schmiedebergs Arch Pharmacol. 2004;369(2):151–159. doi: 10.1007/s00210-003-0860-y. [DOI] [PubMed] [Google Scholar]
- 31.Irwin JJ, Shoichet BK. J Chem Inf Model. 2005;45(1):177–182. doi: 10.1021/ci049714. [DOI] [PMC free article] [PubMed] [Google Scholar]
- 32.LigPrep, 2.4. New York, NY, USA: Schrodinger LLC; www.schrodinger.com. [Google Scholar]
- 33.Shelley JC, Cholleti A, Frye LL, Greenwood JR, Timlin MR, Uchimaya M. J Comput Aided Mol Des. 2007;21(12):681–691. doi: 10.1007/s10822-007-9133-z. [DOI] [PubMed] [Google Scholar]
- 34.Greenwood JR, Calkins D, Sullivan AP, Shelley JC. J Comput Aided Mol Des. 2010;24(6–7):591–604. doi: 10.1007/s10822-010-9349-1. [DOI] [PubMed] [Google Scholar]
- 35.Maestro, 9.1. New York, NY, USA: Schrodinger LLC; www.schrodinger.com. [Google Scholar]
- 36.Glide, 5.0. New York, NY, USA: Schrodinger, LLC; www.schrodinger.com. [Google Scholar]
- 37.Statistica, 8.0. Tulsa, OK, USA: StatSoft, Inc.; www.statsoft.com. [Google Scholar]
- 38.The molecular operating environment (MOE), 2009.10, 2009.10. Montreal, Canada: Chemical Computing Group, Inc.; www.chemcomp.com. [Google Scholar]
- 39.Cavasotto CN, Singh N. Curr Comput-Aid Drug. 2008;4(3):221–234. [Google Scholar]
- 40.Costanzi S, Siegel J, Tikhonova I, Jacobson K. Curr Pharm Des. 2009;15(35):3994–4002. doi: 10.2174/138161209789824795. [DOI] [PMC free article] [PubMed] [Google Scholar]
- 41.Hanson MA, Stevens RC. Structure. 2009;17(1):8–14. doi: 10.1016/j.str.2008.12.003. [DOI] [PMC free article] [PubMed] [Google Scholar]
- 42.Congreve M, Langmead CJ, Mason JS, Marshall FH. J Med Chem. 2011;54(13):4283–4311. doi: 10.1021/jm200371q. [DOI] [PMC free article] [PubMed] [Google Scholar]
- 43.de Graaf C, Rognan D. J Med Chem. 2008;51(16):4978–4985. doi: 10.1021/jm800710x. [DOI] [PubMed] [Google Scholar]
- 44.Kolb P, Rosenbaum D, Irwin J, Fung J, Kobilka B, Shoichet B. Proc Natl Acad Sci U S A. 2009;106(16):6843–6848. doi: 10.1073/pnas.0812657106. [DOI] [PMC free article] [PubMed] [Google Scholar]
- 45.Katritch V, Jaakola V, Lane J, Lin J, Ijzerman A, Yeager M, Kufareva I, Stevens R, Abagyan R. J Med Chem. 2010;53(4):1799–1809. doi: 10.1021/jm901647p. [DOI] [PMC free article] [PubMed] [Google Scholar]
- 46.Carlsson J, Yoo L, Gao Z, Irwin J, Shoichet B, Jacobson K. J Med Chem. 2010;53(9):3748–3755. doi: 10.1021/jm100240h. [DOI] [PMC free article] [PubMed] [Google Scholar]
- 47.Reynolds K, Katritch V, Abagyan R. J Comput Aided Mol Des. 2009;23(5):273–288. doi: 10.1007/s10822-008-9257-9. [DOI] [PMC free article] [PubMed] [Google Scholar]
- 48.Katritch V, Rueda M, Lam P, Yeager M, Abagyan R. Proteins. 2010;78(1):197–211. doi: 10.1002/prot.22507. [DOI] [PMC free article] [PubMed] [Google Scholar]
- 49.Phatak SS, Gatica EA, Cavasotto CN. J Chem Inf Model. 2010;50:2119–2128. doi: 10.1021/ci100285f. [DOI] [PubMed] [Google Scholar]
- 50.Costanzi S. J Med Chem. 2008;51(10):2907–2914. doi: 10.1021/jm800044k. [DOI] [PMC free article] [PubMed] [Google Scholar]
- 51.Michino M, Abola E, Brooks Cr, Dixon J, Moult J, Stevens R. Nat Rev Drug Discov. 2009;8(6):455–463. doi: 10.1038/nrd2877. 2008 Participants, G. [DOI] [PMC free article] [PubMed] [Google Scholar]
- 52.Costanzi S. Chim Oggi. 2010;28(3):26–30. [PMC free article] [PubMed] [Google Scholar]
Associated Data
This section collects any data citations, data availability statements, or supplementary materials included in this article.