

Abstract
Background
Glucose absorption postprandially increases markedly to levels far greater than possible by the classic glucose transporter sodium-glucose cotransporter 1 (SGLT1).
Hypothesis
Luminal concentrations of glucose >50 mM lead to rapid, phenotypic, non-genomic adaptations by the enterocyte to recruit another transporter, glucose transporter 2 (GLUT2), to the apical membrane to increase glucose absorption.
Methods
Isolated segments of jejunum were perfused in vivo with glucose-containing solutions in anesthetized rats. Carrier-mediated glucose uptake was measured in 10mM and 100 mM glucose solutions (n=6 rats, each) with and without selective inhibitors of SGLT1 and GLUT2.
Results
Mean rate of carrier-mediated glucose uptake increased in rats perfused with 100 mM versus 10 mM glucose to 13.9±2.9μmol from 2.1±0.1μmol, respectively (p<0.0001). Using selective inhibitors, the relative contribution of GLUT2 to glucose absorption was 56% in the 100 mM concentration of glucose compared to the 10 mM concentration (27%; p<0.01). Passive absorption accounted for 6% of total glucose absorption at 100 mM glucose.
Conclusion
A small amount of GLUT2 is active at the lesser luminal concentrations of glucose, but when exposed to concentrations of 100 mM, the enterocyte presumably changes its phenotype be recruiting GLUT2 apically to markedly augment glucose absorption.
Keywords: Absorption, GLUT2, SGLT1, translocation, glucose, hexose
INTRODUCTION
It is accepted widely that glucose absorption across the intestine occurs primarily through a carrier-mediated process by which luminal glucose, after having been broken down from polysaccharides by disaccharidases at the brush border, is transported into the cell by a hexose transporter located in the apical membrane of the enterocyte [1–4]. The transporter responsible for this carrier-mediated, stereo-specific glucose transport has been assumed to be primarily the sodium-dependent glucose transporter, SGLT1; SGLT1, an active transport protein, is powered by the downhill Na+ gradient generated by a Na+/K+-ATPase at the basolateral membrane. Several of the more classic physiologic and electrophysiologic studies addressing the mechanism of Na+/glucose co-transport have supported this concept [5–8]. Once inside the cell, sugar molecules are then transported into the portal venous circulation by the facilitative transporter GLUT2 located in the basolateral membrane. The role of SGLT1 has become accepted so widely that standard texts have presented SGLT1 as the primary biochemical and physiologic way in which glucose is absorbed across the brush-border membrane [9].
This classic explanation, however, fails to explain another component responsible for glucose absorption in vivo that becomes evident at greater luminal concentrations of glucose (>50 mM); this second component appears to be responsible for the majority of glucose absorption early postprandially [10]. Whereas SGLT1 becomes saturated between 10–30 mM glucose (the Km of SGLT1 is about 3–6 mM), the other component not explained by simple diffusion does not appear to saturate even at concentrations exceeding 100 mM [11–13].
Two theories have been proposed to explain the mechanism behind this other component of glucose absorption. The theory of “paracellular flow” or “solvent drag” proposed by Pappenheimer et al [14], postulates that enterocytes undergo a conformational change in response to a greater luminal concentration of glucose, which opens tight junctions between cells, allowing water into the intercellular space, which then “drags” solute and nutrients along with it, known as solvent drag [14].
A second, more recent theory proposed by Kellett and colleagues [15, 16] suggests that GLUT2, a facilitated transporter, is translocated rapidly from a preformed cytosolic pool to the apical membrane of the enterocyte when luminal glucose concentration exceeds the absorptive capacity of SGLT1 (around 30 mM) [3]. Immunocytochemical detection of GLUT2 in the brush border membrane of rat enterocytes and in vivo data lends considerable credibility to this theory [17].
Despite our own inability to show GLUT2-mediated augmentation of glucose uptake into intestinal segments ex vivo by the study of everted sleeves [4], we have shown the presence of GLUT2 in the apical membrane in human Caco-2 cells and rat RIE cells, both cell culture models of epithelial cells; more importantly, we have demonstrated a marked augmentation of glucose uptake by these cells when exposed to glucose concentrations >25 mM that is sensitive to phloretin, a specific inhibitor of GLUT2 [18].
Because of concerns of rapid translocation of GLUT2 out of the apical membrane during ex vivo preparations to study in vitro glucose uptake [4], we designed the current study with two aims. First, we wanted to determine if glucose absorption in an in vivo rat model of intestinal perfusion would increase when the luminal concentration of glucose was increased to 100 mM. Second, because transporter-mediated glucose absorption is stereospecific, our aim was to determine if absorption of L-glucose, the stereoisomer of D-glucose, was increased markedly as a function of the opening of tight junctions, a process that would not be stereospecific. Our hypothesis was that in vivo absorption of glucose after a meal is increased markedly by a stereospecific, carrier-mediated process secondary to apical GLUT2 and not by a stereo-non-specific process.
METHODS
All experiments were conducted only after approval by our Institutional Animal Care and Use Committee and in accordance with the guidelines of the National Institutes of Health for the humane use and care of laboratory animals.
Design
Our in vivo intestinal perfusion experiments involved comparison of glucose absorption, both stereospecific carrier-mediated and stereo-non-specific passive absorption, at 10 mM and 100 mM glucose solutions. We then determined the effect of specific inhibition of the SGLT1-mediated process by phlorizin (Sigma, St. Louis, MO) during 10 mM and 100 mM glucose perfusions as well as the effect of specific inhibition of the GLUT2-mediated process by phloretin (Sigma) again at 10 mM and 100 mM glucose perfusions. By measuring absorption of 14C-D-glucose and 3H-L-glucose, we were able to determine separately the carrier-mediated (14C) and non-carrier-mediated (3H, diffusion) components of glucose absorption under each condition.
Preparation of in vivo model of perfusion
Male Lewis rats (Harlan, Indianapolis, IN) weighing 250–300 g were fed ad libitum on standard rat chow with free access to water. The rats were allowed to acclimate to the laboratory housing environment for at least one week prior to experiments in a 12:12-h dark-light cycle. Rats were anesthetized using 2% inhaled isoflurane for induction followed by intraperitoneal sodium pentobarbital (50 mg/kg) for maintenance of anesthesia. Using a mid-line celiotomy, a 30-cm jejunal segment was isolated beginning 5 cm distal to the ligament of Treitz. The proximal and distal ends of this segment were ligated to avoid spillage of enteric contents into the abdomen during the experiment. This 30-cm jejunal segment was then cannulated proximally (I.D. = 0.035in) and distally (I.D. = 0.118in) with Silastic® tubing and secured in place with a purse string suture. The segment was perfused initially with 30 ml of Ringer’s lactate to evacuate intraluminal content before beginning the infusion of test solutions. Rats were kept on a warmed mat to avoid inducing hypothermia during the perfusion. We studied jejunal glucose uptake in Lewis rats between 8:00- 11:00 a.m. Adherence to this schedule was undertaken to avoid the known diurnal patterns in hexose transporter expression and function which would confound our results [19].
Conduct of Experiments
After placement of the perfusion and the effluent catheters, rats were randomized to one of the following six groups of six rats each: Group 1– 10 mM glucose, Group 2- 100 mM glucose, Group 3- 10 mM glucose with 1 mM phlorizin (SGLT1 inhibitor), Group 4- 100 mM glucose with 1 mM phlorizin, Group 5- 10 mM glucose with 1 mM phloretin (GLUT2 inhibitor), and Group 6- 100 mM glucose with 1 mM phloretin. Plorizin and phloretin were solubilized in 0.3% ethanol. See below for description of test solutions. Doses of phlorizin and phloretin were based on multiple, well-validated previous studies [4, 10, 20]. All experiments were done in anesthetized rats. First, the 30-cm segment of intestine was flushed with 30 ml of Ringer’s lactate to evacuate residual intraluminal content. Then the infusion of the respective warmed (38° C) test solution was begun at a constant rate of 1 ml/min. All effluent from the 30-cm segment was collected at 10 min intervals for 2 h. Prior to beginning our test experiments, we infused solutions with radiolabeled polyethylene glycol (3H-PEG, a non-absorbable marker) to determine the time it took to reach a steady state. In this model, it took between 15–20 min to reach a steady state, defined as the amount of marker infused per 10 min equaling the amount of marker recovered in the effluent per 10 min. The rats remained laying on their sides during the infusion. Additional doses of pentobarbital were administered as needed to keep the rats asleep during the experiment. At the end of the infusion, the still anesthetized rats were subjected to a rapid re-celiotomy, and the test segment was excised rapidly into an ice-cold solution of phosphate buffer solution; the mucosa was scraped with a glass slide and snap-frozen in liquid nitrogen immediately for later analysis. Samples were measured for volume and 4.5 ml of counting cocktail (Opti-Flour, Perkin-Elmer, Shelton, CT) were added to the counting vial. Counts were obtained using dual isotope, liquid scintillation counting on a Beckman LS60000SC counter (Fullerton, CA). Samples were collected as duplicates, and the mean was used to calculate the final counts per min (CPM) per sample. Carrier-mediated glucose uptake was calculated as total glucose uptake (14C-D-glucose) minus passive uptake (3H-L-glucose) for each sample and expressed in μmol/min/30-cm segment of bowel.
Preparation of Brush Border Membranes
After flushing the perfused section of the bowel with ice cold perfusate, the segment was removed and placed on an ice cold dissecting dish. The segment was cut and opened with the mucosal side up. The mucosa was scraped off the muscle layer using a glass slide. The mucosal scrapings were placed in 5 ml of ice-cold 50 mM Mannitol / 2 mM Tris HCl, pH 7.1, with 0.1 mM PMSF and Halt Protease Inhibitor (Fisher Scientific, Pittsburgh, PA) and flash frozen in liquid nitrogen before storing in a −70° freezer. The sample was removed later from the freezer and thawed on ice. The sample was then passed through a 21 gauge needle to homogenize the tissue and left on ice for 10 min to allow the cells to break up. The tissue was then passed through a 22 gauge needle. Mannitol Buffer with PMSF and Halt was added to a final volume of 10 ml and mixed well. 1.5 ml of the homogenized sample was transferred to 1.5 ml Eppendorf tube for total protein analysis. The total protein sample was centrifuged at 5000 G at 4°C for 10 min. The supernatant was kept for assay of total protein by the BCA method, alkaline phosphatase measurement using pNPP reagent, and for Western blotting. 1M MgCl2 was added to the remaining sample in the 15 ml tube until the final concentration was 10 mM to precipitate all membranes except the brush border. The sample was placed on a rocker in the refrigerator for 20 min and then centrifuged at 3000 G for 15 min at 4° C. The supernatant was transferred to another tube and centrifuged at 30,000 G for 45 min at 4° C. The pellet was resuspended in 500 μl of 100 mM Mannitol / 1 mM Tris-Hepes with 0.1 mM PMSF and Halt, pH 7.5, using a 21 gauge needle. The final BCA protein concentration was 2–3 μg/μl. Approximately 40 μg protein of protein was loaded per lane for Western blotting. Alkaline phosphatase level was measured using pNPP reagent to confirm enrichment of alkaline phosphatase in the brush border isolation.
Western Blotting
Approximately 40 μg of protein was separated on Criterion 10% Tris-HCl gels (Bio-Rad, Hercules, CA) and transferred by semi-dry electroblotting to PVDF membrane (Millipore, Bedford, MA). Non-specific binding sites on the membrane were blocked using 5% non-fat dry milk (Bio-Rad) in Tris-buffered saline (Bio-Rad) with 0.06% Tween 20 (Bio-Rad) (TBS-T), and the membranes were cut into two sections at 45 kDal for separate incubation with primary antibodies. Blots were incubated overnight at 4°C with appropriate rabbit or mouse anti-rat primary antibody against transporter proteins GLUT2 (Millipore-Chemicon, Bedford, MA), and GAPDH (US Biological, Swampscott, MA) diluted in 5% non-fat dry milk in TBS-T. After incubation with primary antibody, the blots were rinsed in TBS-T and then incubated in the appropriate goat anti-rabbit or goat anti-mouse peroxidase-conjugated secondary antibody (Sigma, St. Louis, MO). Protein bands for GLUT2 were enhanced using an Amplified Opti-4CN Detection Kit (Bio-Rad) before visualization. The bands for GAPDH did not require enhancement. All bands were visualized finally with Opti-4CN Colorimetric Detection (Bio-Rad). The visualized bands were scanned, and the band density was measured using Image J Software. The density of each protein band of interest was expressed as a ratio to GAPDH.
Statistical Analysis
Statistical analysis was performed using paired Student’s t-tests to compare parametric data between groups. A p value of ≤0.05 was considered significant. All data are reported as the mean values ± standard error of the mean unless specified otherwise; n values are number of rats.
RESULTS
Infusion Experiments
All animals tolerated the infusion experiments well. At the end of the experiment, the perfused loop was collapsed with no signs of any obstruction or visual abnormality of the segment. When rat intestine was exposed to the greater concentration of luminal glucose in vivo, active glucose absorption (carrier-mediated uptake minus passive uptake) was increased significantly. The increase in absorption was noted at 20 min and remained stable from that time point on for the rest of the infusion (Fig 1). Importantly, stereospecific, carrier-mediated absorption (labeled 14C-D-glucose) increased from 2.1±0.1 to 13.9±2.9 μmol/min (p<0.001) when glucose concentration was increased from 10–100 mM, while passive, non-stereospecific absorption (labeled 3H-L-glucose) increased by much less, from 0.7±1.7 to 0.9±1.9 μmol/min per 30 cm intestinal segment (p<0.001). The increase in absorption in the 100 mM experiments was very rapid, being evident in the first 20 min.
Figure 1.
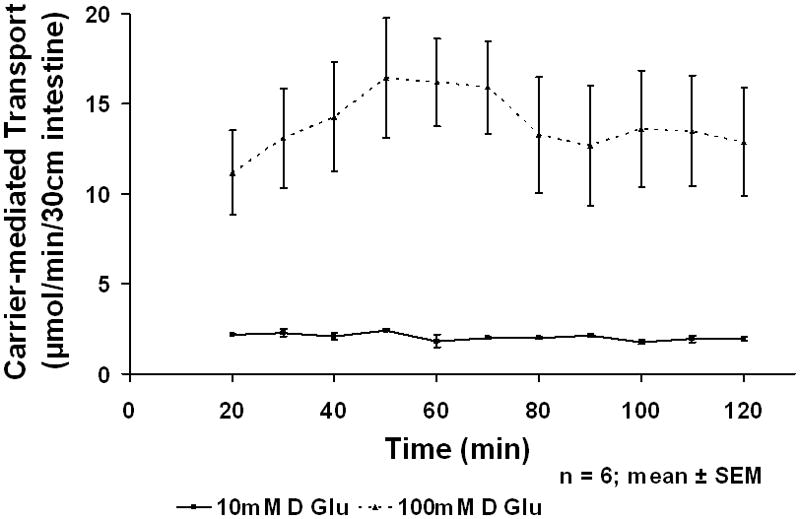
In vivo Carrier-mediated glucose absorption at 10 and 100 mM glucose
Inhibition of SGLT1 and GLUT2
After infusing the rat jejunum with 10 mM D-glucose for 1 h, the addition of 1.0 mM phlorizin (SGLT1 inhibitor) or phloretin (GLUT2 inhibitor) to the perfusate resulted in decrease in absorption that occurred rapidly within 20 min. After allowing 20 min for re-establishment of a steady state, carrier- mediated glucose uptake was decreased by phlorizin (SGLT1 inhibitor) from 2.5±0.2 to 0.6±0.1 μmol (p<0.02) and by phloretin (GLUT2 inhibitor) from 2.4±0.3 to 1.7±0.2 μmol (p<0.02) (Fig 2a). Thus, the relative contribution of glucose absorption at the lesser concentration of glucose was dependent primarily on carrier-mediated uptake by SGLT1. The transporter GLUT2 appeared, however, to be active in mediating some absorption of glucose but plays a minor role in glucose uptake at this lesser concentration of glucose.
Figure 2.
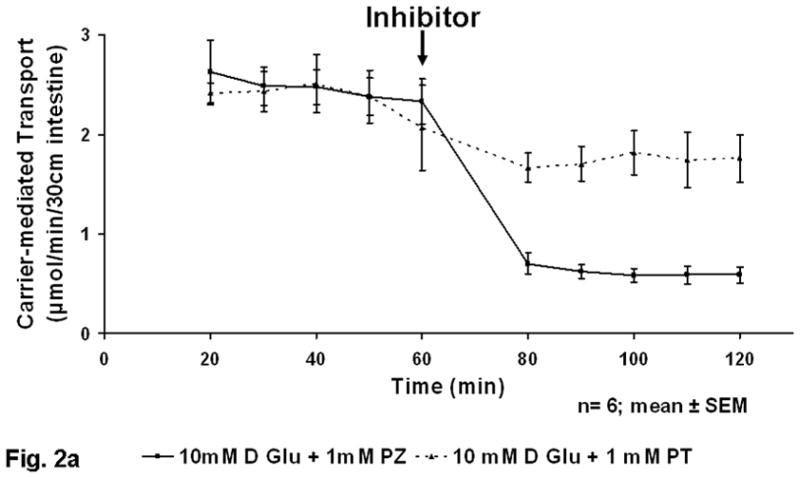
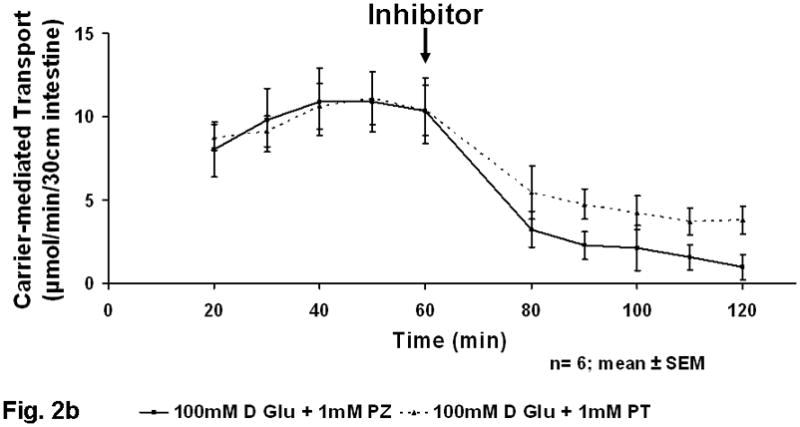
a) Inhibition of in vivo glucose absorption by phloretin (PT) and phlorizin (PZ) at 10 mM glucose (black arrow at 60 min represents administration of inhibitor). b) Figure 2B Inhibition of in vivo glucose absorption by phloretin (PT) and phlorizin (PZ) at 100 mM glucose (black arrow at 60 min represents administration of inhibitor).
When inhibiting SGLT1 and GLUT2 separately at the greater 100 mM concentration of luminal glucose, there was a much greater decrease in stereospecific glucose absorption. Carrier-mediated glucose uptake at 100 mM glucose infusion was decreased by phlorizin (SGLT1 inhibitor) from 9.4±2.3 to 2.0±0.9 μmol/min (p<0.01) and by phloretin (GLUT2 inhibitor) from 10.0±1.2 to 4.4±1.0 μmol/min (p<0.03) (Fig 2b). Based on the phloretin-sensitive component, the transporter GLUT2 appeared to play the major role in glucose absorption at the greater concentration of luminal glucose. Furthermore, the phlorizin-sensitive component (SGLT1) to glucose absorption at the greater concentration of glucose appeared to be linked with GLUT2-mediated (phloretin-sensitive) absorption. The relative contribution of the phloretin-sensitive component (presumably GLUT2) to glucose absorption was 27% at 10 mM but more than double, 56%, at 100 mM (p<0.01).
Passive absorption of glucose (3H-L-glucose uptake) was 0.7±1.7 μmol/min at 10 mM glucose concentration, whereas it was slightly greater, 0.9±1.9 μmol/min, at the 100 mM glucose solution. The contribution of passive absorption at 10 mM glucose concentration was 25%, whereas it represented only 6% of absorption at 100 mM glucose concentration. So although there was a slight increase in the value of passive uptake at greater concentrations, there was an overall decrease in its relative contribution to glucose absorption.
Western Blot Analysis
Semiquantitative estimates of GLUT2 protein in the brush border membrane (n=6 rats at each concentration) did not differ in the 10 mM glucose vs the 100 mM glucose (Fig 3). These observations show a lack of correlation with the increased carrier-mediated absorption of glucose from the 100 mM perfusions.
Figure 3.
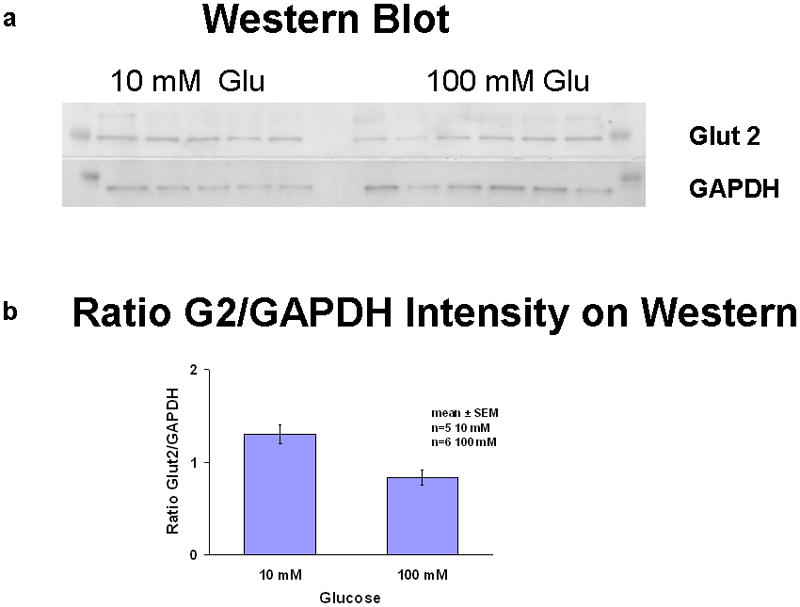
Western blot of brush border membrane of mucosal scraping. a) Western blot of GLUT2 and the housekeeper gene GAPDH; b) semiquantitative ratio of GLUT2 to GAPDH in brush border membrane fraction.
DISCUSSION
While it has been assumed classically that most carrier-mediated intestinal absorption of glucose occurs via SGLT1, more recent, strong experimental evidence using both immunohistochemical and functional data in vivo supports the presence of the hexose transporter GLUT2 in the apical membrane of enterocytes [17]. The concept that GLUT2 only resides functionally in the basolateral membrane of enterocytes and is found in the apical membrane only in chronic states of hyperglycemia (diabetes) is disappearing slowly based on new experimental evidence. In our recent work with cell cultures of enterocyte-like cells exposed to progressively greater glucose concentrations, we showed apical translocation of GLUT2 in Caco2 and RIE-1 cell lines [18]. In our past work, we were unable to show a major role for GLUT2 in vitro, using harvested everted intestinal sleeves of rats exposed to concentrations of glucose ≥50 mM [4]. As a natural progression, we developed an in vivo model to study the absorptive properties of glucose. We designed our present in vivo model to complement our previous cell culture and in vitro data and to further explore the contribution that GLUT2 has on luminal glucose absorption under physiologic conditions as well as to investigate passive absorption of glucose during 100 mM glucose infusions in an attempt to investigate the functional status of tight junctions.
Our experiments and those of others show a marked increase in functional activity of a phloretin-sensitive component (presumably GLUT2) in response to increased concentrations of luminal glucose in the acute setting. We maintain that it is important to study this form of “acute adaptation”, because it is reflective of the physiologic state after a meal containing carbohydrates. Measurements of the free luminal concentrations of glucose after a meal have been in the range of 16–28 mM [21]. This value represents the content of α-limit dextrins and disaccharides and does not take into account the local concentrations of monosaccharides at the brush border due to the activity of membrane-bound disaccharidases. In contrast, when the breakdown of disaccharides into sugars hydrolysis is considered, the value of free luminal glucose in the immediate vicinity of the enterocyte (the “unstirred layer”) has been estimated to be as great as 300 mM [22]. Because the kinetics of SGLT1 gives a Km of around 3–6 mM, the hexose transporter SGLT1 should be saturated at glucose concentrations >25 mM; therefore, there appears to be another component of absorption that accounts for the majority of glucose absorption acutely, because only a small fraction of the monosaccharides produced from ingested meals escape from absorption at the surface of the brush-border membrane [10]. When investigated, this additional component was assumed to be related to GLUT2 based on use of selective inhibitors and highly controlled imaging techniques designed to prevent translocation of GLUT2 out of the apical membrane. Our work with both D-glucose and L-glucose shows clearly that the augmented absorption of glucose is stereospecific and thus carrier-mediated. This component is not related to an increase in passive uptake by disruption of tight junctions via the solvent drag theory proposed by Pappenheimer and colleagues. Lane et al have also published work showing that passive absorption represents a small fraction (<8%) of total glucose uptake by using L-glucose as a marker for passive absorption in unanesthetized dogs [23].
We would like to address several other theoretical possibilities to explain this augmentation in glucose uptake, although we think these to be highly unlikely. First, our kinetics suggest another “stereospecific” transporter. GLUT5, which transports fructose preferentially, is a possibility. Indeed, Rand and colleagues [24] have shown that rat GLUT5 can transport glucose [24], but the capacity is far less than that of GLUT2, and we believe this to be highly unlikely. Second, while the phloretin might also decrease the activity of basolateral GLUT2, phloretin is not readily absorbed. Moreover, if the effect we measured was secondary to inhibition of basolateral GLUT2, then the amount of glucose we measure as “absorbed” would have to be stored in or metabolized by the enterocytes, again a highly unlikely event. Third, the absorption of glucose is relatively constant over the course of the experiment. Our work with uptake of glucose into cells in cell culture showed that rate of uptake decreases rapidly after the first minute as the cell accumulates intracellular glucose. Thus, the glucose we measured as “absorbed” by our model would have had to accumulate in the enterocytes; we again believe this to be highly unlikely. Finally, prior work with GLUT2 null mice ha shown that the ability to absorb adequate glucose to maintain health exits [25]; while it is possible that this non-carrier-mediated process could explain the increased glucose absorption, one would not expect this process to be stereospecific nor inhibitable by phloretin.
Our use of L-glucose as a probe for paracellular permeability revealed that passive uptake of glucose accounts for 6% of total glucose absorption at the 100 mM concentration of glucose in our experiments. Solvent drag appears to play a negligible, if any, role in absorption of glucose at greater concentrations. According to the solvent drag theory, if an osmotic gradient created by the uptake of water between cells was responsible for the ‘diffusive’ component of absorption, L-glucose should have been absorbed at a rate similar to D-glucose because of its non-stereospecificity. Interestingly, we noted a decrease in the relative contribution of passive absorption as the concentration of glucose increased. Furthermore, inhibition of GLUT2 by phloretin after perfusing in vivo rat intestine with 100 mM D-glucose showed a marked decrease in glucose absorption. This observation suggests strongly that GLUT2 is playing a major role in glucose absorption during assimilation of a meal rather than a passive process which would not have been affected by phloretin. The rapidity of the increase in carrier-mediated glucose absorption (within 20 minutes) suggests a post-translational, non-genomic process being expressed as an “acute phenotypic adaptation.” [26]. Our work in cell culture shows this acute adaptation to occur within 5 min [18]. Given that SGLT1 inhibition (addition of phlorizin) at greater concentrations of luminal glucose also significantly decreases glucose absorption further suggests that GLUT2 activation is dependent on the activity of SGLT1. Previous investigators [20, 27, 28] and work in cell culture [18] have suggested that protein kinase C-βII is involved in the intracellular signaling pathway for activating the GLUT2 component of glucose absorption.
Protein analysis of isolated brush border membrane vesicles from the perfused jejunum using Western blot could not demonstrate any difference semiquantitatively between GLUT2 protein at the apical membrane immediately after the 10 mM vs the 100 mM glucose concentrations. Although we harvested the mucosa from the segment rapidly into the ice-cold buffer, it is possible that the GLUT2 was translocated out of the apical membrane prior to or during the isolation of the apical membrane. Alternatively, the increase in glucose absorption at 100 mM concentration may be attributable to an increase in the activity of the GLUT2 that is already expressed under baseline conditions in apical membrane. Based on the design of our current experiment, we cannot further explain these findings.
Our experimental model has several limitations that require acknowledgment. First, a constant infusion into the jejunum is not physiologic. Also, the lack of pancreatobiliary secretions may also affect the results. Second, the experiments were conducted on anesthetized rats. Third, the infusate contained glucose and not long chain carbohydrates; whether the immediate microenvironment at the apical membrane of the enterocyte reproduces the concentration of free glucose attained after a meal of complex carbohydrates is unknown. All these potential limitations must be considered when interpreting our results.
In conclusion, under the experimental conditions used, we conclude that GLUT2 appears to account for the augmented absorption of glucose from the enterocytes when the lumen of the bowel is exposed to greater concentrations of glucose, and thereby GLUT2 plays a major role in glucose absorption at greater glucose concentrations as evidenced by the effect of inhibition with phloretin. Whether this process occurs through an increase in the intrinsic activity of GLUT2 expressed basally, at the apical membrane, or through activation of an intracellular secondary messenger system (i.e. via PKC-βII) which causes rapid insertion of GLUT2 transporters to the apical membrane cannot be determined based on our data. Our data does, however, show conclusively that paracellular flow or passive absorption has a negligible effect on glucose absorption, which was thought by others in the past to represent the major route of glucose absorption postprandially.
Acknowledgments
This work was supported in part by a grant from the National Institutes of Health - DK39337 (Dr. Sarr).
The authors wish to thank Deborah Frank for her expertise in preparing the manuscript for submission.
Footnotes
This work was presented at the annual meeting of the Society for Surgery of the Alimentary Tract, Chicago, IL, May 8, 2011.
References
- 1.Alvarado F, Lherminier M, Phan H. Hamster intestinal disaccharide absorption: extracellular hydrolysis precedes transport of the monosaccharide products. J Physiol. 1984;355:493–507. doi: 10.1113/jphysiol.1984.sp015434. [DOI] [PMC free article] [PubMed] [Google Scholar]
- 2.Hediger MA, Coady MJ, Ikeda TS, Wright EM. Expression cloning and cDNA sequencing of the Na+/glucose cotransporter. Nature. 1987;330:379–381. doi: 10.1038/330379a0. [DOI] [PubMed] [Google Scholar]
- 3.Kellett GL, Brot-Laroche E, Mace OJ, Leturque A. Sugar absorption in the intestine: the role of GLUT2. Ann Rev Nutr. 2008;28:35–54. doi: 10.1146/annurev.nutr.28.061807.155518. [DOI] [PubMed] [Google Scholar]
- 4.Scow JS, Iqbal CW, Jones TW, 3rd, Qandeel HG, Zheng Y, Duenes JA, Nagao M, Madhavan S, Sarr MG. Absence of evidence of translocation of GLUT2 to the apical membrane of enterocytes in everted intestinal sleeves. J Surg Res. 2011;167:56–61. doi: 10.1016/j.jss.2010.04.026. [DOI] [PMC free article] [PubMed] [Google Scholar]
- 5.Crane RK. The gradient hypothesis and other models of carrier-mediated active transport. Rev Physiol Biochem Pharmacol. 1977;78:99–159. doi: 10.1007/BFb0027722. [DOI] [PubMed] [Google Scholar]
- 6.Schultz SG, Curran PF. Coupled transport of sodium and organic solutes. Physiol Rev. 1970;50:637–718. doi: 10.1152/physrev.1970.50.4.637. [DOI] [PubMed] [Google Scholar]
- 7.Semenza G, Kessler M, Hosang M, Weber J, Schmidt U. Biochemistry of the Na+, D-glucose cotransporter of the small intestinal membrane: state of the art in 1984. Biochim Biophys Acta. 1984;779:343–379. doi: 10.1016/0304-4157(84)90016-9. [DOI] [PubMed] [Google Scholar]
- 8.Stevens BR, Kaunitz JD, Wright EM. Intestinal transport of amino acids and sugars: advances using membrane vesicles. Ann Rev Physiol. 1984;46:417–433. doi: 10.1146/annurev.ph.46.030184.002221. [DOI] [PubMed] [Google Scholar]
- 9.Lodish H, Berk A, Zipursky SL, Matsudaira P, Baltimore D, Darnell J. Molecular Cell Biology. 4. New York: W.H. Freeman and Co; 1999. pp. 602–604. [Google Scholar]
- 10.Kellett GL, Helliwell PA. The diffusive component of intestinal glucose absorption is mediated by the glucose-induced recruitment of GLUT2 to the brush-border membrane. Biochem J. 2000;350:155–162. [PMC free article] [PubMed] [Google Scholar]
- 11.Fullerton PM, Parsons DS. The absorption of sugars and water from rat intestine in vivo. Q J Exp Physiol. 1956;41:387–397. [Google Scholar]
- 12.Debnam ES, Levin RJ. An experimental method of identifying and quantifying the active transfer electrogenic component from the diffusive component during sugar absorption measured in vivo. J Physiol. 1975;246:181–196. doi: 10.1113/jphysiol.1975.sp010885. [DOI] [PMC free article] [PubMed] [Google Scholar]
- 13.Lostao MP, Berjon A, Barber A, Ponz F. On the multiplicity of glucose analogues transport systems in rat intestine. Rev Espan Fisiol. 1991;47:209–216. [PubMed] [Google Scholar]
- 14.Pappenheimer JR, Reiss KZ. Contribution of solvent drag through intercellular junctions to absorption of nutrients by the small intestine of the rat. J Membr Biol. 1987;100:123–136. doi: 10.1007/BF02209145. [DOI] [PubMed] [Google Scholar]
- 15.Helliwell POA, Richardson M, Affleck J, Kellett GL. Stimulation of fructose transport across the intestinal brush-border membrane by PMA is mediated by GLUT2 and dynamically regulated by protein kinase C. Biochem J. 2000;350(pt.1):149–154. [PMC free article] [PubMed] [Google Scholar]
- 16.Kellett GL. The facilitated component of intestinal glucose absorption. J Physiol. 2001;531:585–595. doi: 10.1111/j.1469-7793.2001.0585h.x. [DOI] [PMC free article] [PubMed] [Google Scholar]
- 17.Affleck JA, Helliwell PA, Kellett GL. Immunocytochemical detection of GLUT2 at the rat intestinal brush-border membrane. J Histochem Cytochem. 2003;51:1567–1574. doi: 10.1177/002215540305101116. [DOI] [PMC free article] [PubMed] [Google Scholar]
- 18.Zheng Y, Scow JS, Duenes JA, Sarr MG. Mechanisms of glucose uptake in intestinal cell lines: role of GLUT2. Surgery. 2011 doi: 10.1016/j.surg.2011.07.010. in press. [DOI] [PMC free article] [PubMed] [Google Scholar]
- 19.Houghton SG, Zarroug AE, Duenes JA, Fernandez-Zapico ME, Sarr MG. The diurnal periodicity of hexose transporter mRNA and protein levels in the rat jejunum: role of vagal innervation. Surgery. 2006;139:542–549. doi: 10.1016/j.surg.2005.09.002. [DOI] [PubMed] [Google Scholar]
- 20.Helliwell PA, Kellett GL. The active and passive components of glucose absorption in rat jejunum under low and high perfusion stress. J Physiol. 2002;544:579–589. doi: 10.1113/jphysiol.2002.028209. [DOI] [PMC free article] [PubMed] [Google Scholar]
- 21.Lane JS, Whang EE, Rigberg DA, Hines OJ, Kwan D, Zinner MJ, McFadden DW, Diamond J, Ashley SW. Paracellular glucose transport plays a minor role in the unanesthetized dog. Am J Physiol. 1999;276:789–794. doi: 10.1152/ajpgi.1999.276.3.G789. [DOI] [PubMed] [Google Scholar]
- 22.Ferraris RS, Yarshapour S, Lloyd KC, Mirzayan R, Diamond JM. Luminal glucose concentrations in the gut under normal conditions. Am J Physiol. 1990;259:822–837. doi: 10.1152/ajpgi.1990.259.5.G822. [DOI] [PubMed] [Google Scholar]
- 23.Pappenheimer JR. On the coupling of membrane digestion with intestinal absorption of sugars and amino acids. Am J Physiol. 1993;265:409–417. doi: 10.1152/ajpgi.1993.265.3.G409. [DOI] [PubMed] [Google Scholar]
- 24.Rand EB, DePaoli AM, Davidson NO, Bell GI, Burant CF. Sequence, tissue distribution, and functional characterization of the rat fructose transporter GLUT5. Am J Physiol. 1993;27:G1169–G1176. doi: 10.1152/ajpgi.1993.264.6.G1169. [DOI] [PubMed] [Google Scholar]
- 25.Stumpel F, Burcelin R, Jungermann K, Thorens B. Normal kinetics of intestinal glucose absorption in the absence of GLUT2: evidence for a transport pathway requiring glucose phosphorylation and transfer into the endoplasmic reticulum. Proc National Acad Sci. 2001;98:11330–11335. doi: 10.1073/pnas.211357698. [DOI] [PMC free article] [PubMed] [Google Scholar]
- 26.Scow JS, Tavakkolizadeh A, Zheng Y, Sarr MG. Acute adaptation by the small intestinal enterocyte: A posttranscriptional mechanism involving apical translocation of nutrient transporters. Surgery. 2011;149:601–605. doi: 10.1016/j.surg.2011.02.001. [DOI] [PMC free article] [PubMed] [Google Scholar]
- 27.Morgan EL, Mace OJ, Affleck J, Kellet GL. Apical GLUT2 and Cav 1.3: regulation of rat intestinal glucose and calcium absorption. J Physiol. 2007;580.2:593–604. doi: 10.1113/jphysiol.2006.124768. [DOI] [PMC free article] [PubMed] [Google Scholar]
- 28.Helliwell PA, Rumsby MG, Kellett GL. Intestinal sugar absorption is regulated by phosphorylation and turnover of protein kinase C beta II mediated by phosphatidylinositol 3-kinase- and mammalian target of rapamycin-dependent pathways. J Biol Chem. 2003;278:28644–28650. doi: 10.1074/jbc.M301479200. [DOI] [PubMed] [Google Scholar]