Abstract
Purpose
To compare a new birdcage-transmit, 28 channel-receive array (28 Ch) coil and a quadrature volume coil for 7 Tesla morphologic MRI and T2 mapping of knee cartilage.
Methods
The right knees of ten healthy subjects were imaged on a 7 Tesla whole body MR scanner using both coils. 3-dimensional fast low-angle shot (3D-FLASH) and multi-echo spin-echo (MESE) sequences were implemented. Cartilage signal-to-noise ratio (SNR), contrast-to-noise ratio (CNR), thickness, and T2 values were assessed.
Results
SNR/CNR was 17–400% greater for the 28 Ch compared to the quadrature coil (p≤0.005). Bland-Altman plots show mean differences between measurements of tibial/femoral cartilage thickness and T2 values obtained with each coil to be small (−0.002±0.009 cm/0.003±0.011 cm) and large (−6.8±6.7 ms/−8.2±9.7 ms), respectively. For the 28 Ch coil, when parallel imaging with acceleration factors (AF) 2, 3, and 4 was performed, SNR retained was: 62–69%, 51–55%, and 39–45%.
Conclusion
A 28 Ch knee coil provides increased SNR/CNR for 7T cartilage morphologic imaging and T2 mapping. Coils should be switched with caution during clinical studies because T2 values may differ. The greater SNR of the 28 Ch coil could be used to perform parallel imaging with AF2 and obtain similar SNR as the quadrature coil.
Keywords: Cartilage, magnetic resonance imaging, multichannel coil, T2 mapping, ultra high field, 7 Tesla
INTRODUCTION
Magnetic resonance imaging (MRI) has benefited from the arrival of high field (HF, 3T) and ultra high field (UHF, ≥ 7T) MRI scanners and improvements in radiofrequency coil technology. Because of the greater signal-to-noise ratio (SNR) available, HF/UHF MRI scanners permit imaging with greater spatial resolution and scanning speed (1–3). This is favorable for the evaluation of cartilage, which is only 2–4 mm thick. Increased spatial resolution can allow for more accurate assessment of cartilage morphology and faster scanning can allow additional sequences, such as T2 mapping, to be performed during the same scan session.
The development of HF/UHF MRI scanners has been paralleled by the development of multichannel, phased-array coils. Multichannel coils provide the increased sensitivity of individual surface coils combined with the large field of view coverage of volume coils (4–6). Furthermore, multichannel coils allow parallel image acquisition techniques to be possible, permitting further decreases in scan time, albeit at the expense of SNR.
Although these potential benefits of UHF MRI and multichannel coils exist, the performance of UHF MRI of cartilage and the engineering of multichannel coils is not straightforward. Only a handful of papers on UHF MRI of cartilage have been performed (7–9), and to our best knowledge none with a multichannel knee coil. UHF MRI must take into account changes in T1 and T2 relaxation rates, increased chemical shift and susceptibility artifact, and greater energy deposition and acoustic noise. Coils are not widely available for UHF scanners because engineering of coils at ≥ 7T is challenging. For multichannel coils, physical space limitations restrict the number of receive elements/electronic components that can fit within the coil housing. One must also be able to increase the number of receive elements without causing coupling between elements, which can decrease SNR. Finally, if coil noise is dominant over sample noise (which is a concern for the smaller elements used in multichannel coils), then SNR may also decrease (10).
With this in mind, the goal of this study was to compare a new birdcage-transmit, 28 channel-receive coil and a quadrature coil for morphologic MRI and T2 mapping of knee cartilage at 7T. For each coil, we assessed cartilage SNR and contrast-to-noise ratio (CNR). We also assessed the agreement between measurements of cartilage thickness and T2 values obtained with each coil. Finally, we used the 28 channel coil to perform parallel imaging of knee cartilage at 7T.
METHODS
Subject Recruitment
This study had institutional review board approval and written informed consent was obtained. Ten healthy subjects without history of knee pain, trauma, surgery, metabolic, or inflammatory disorder were recruited (7 males, 3 females, mean age 32.6 ± 7.8 years).
MRI Scanning and Radiofrequency Coils
The right knee was scanned on a 7T whole body MR scanner (Siemens, Erlangen, Germany) using a quadrature transmit-receive volume coil (Rapid MR International, Columbus, Ohio) and a birdcage transmit, 28 channel-receive array coil (Quality Electrodynamics, Mayfield Village, Ohio) (Figure 1a). For the 28 channel coil, overlapping, rectangular receive elements were equally divided between anterior and posterior coil halves (11). The transmit component of the 28 channel coil consisted of a partially-shielded birdcage coil; specifically, the radiation shield was limited to the birdcage rungs and endrings, as opposed to a continuous floating shield between the birdcage and environment (11). Finally, in order to overcome space limitations of fitting all electronic components into the 28 channel coil housing, ultra-compact, low-noise, pre-amplifiers were used; these are smaller than commercially used miniature pre-amplifiers at 1.5T and 3T (11). The 28 channel knee coil required radiofrequency pulse voltages 20% higher than the quadrature coil for equivalent excitation.
Figure 1.
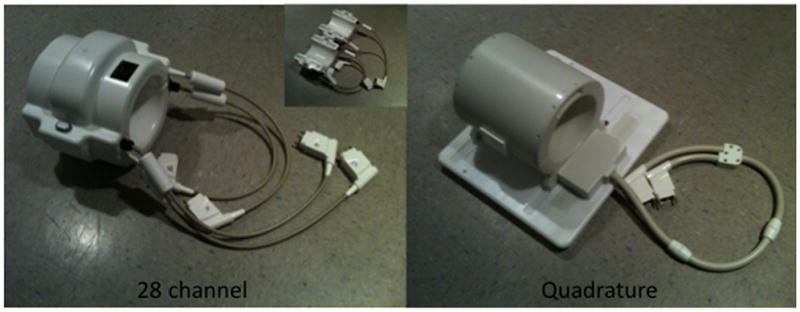
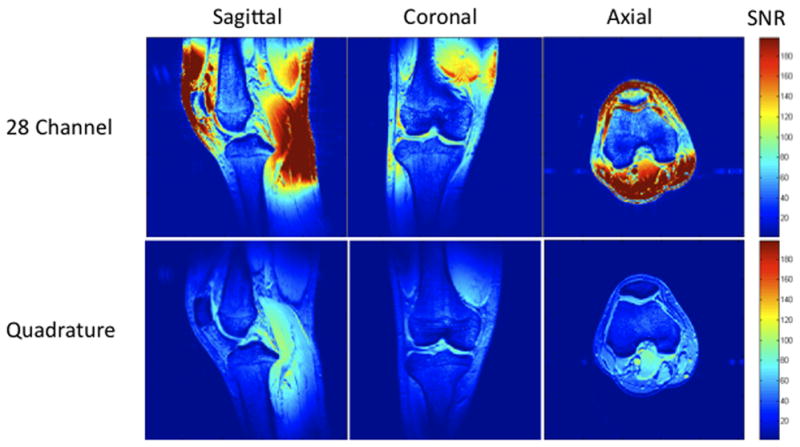
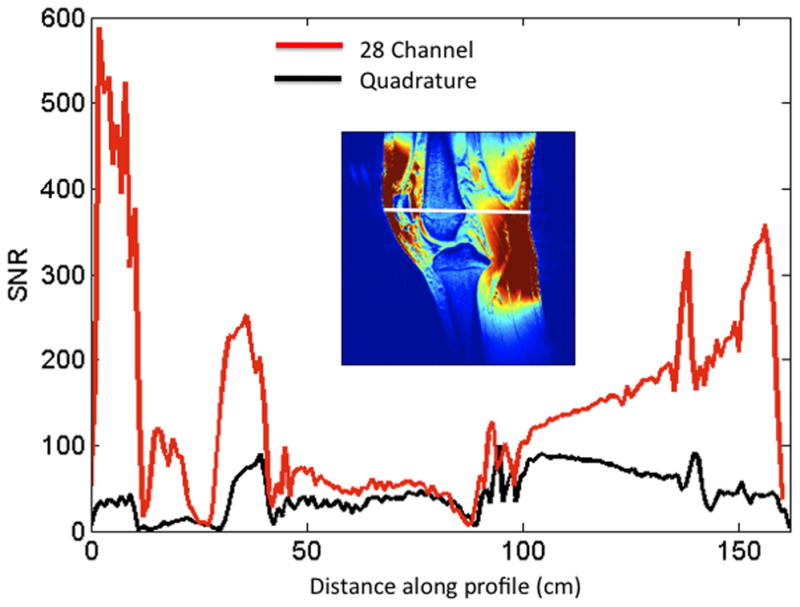
(a–c). (a) Images of the 28 channel coil (left) and quadrature coil (right). The 28 channel coil consists of anterior and posterior halves, each of which contains 14 receive elements (inset image). (b) SNR maps of the 28 channel coil versus the quadrature volume coil in sagittal, coronal, and axial planes. These maps were generated using the sum-of-squares method from estimates of noise covariance and sensitivities for each coil. (c) SNR profile for the sagittal acquisition showing approximately 300–400% increase in SNR at the periphery of the field of view and approximately 17% increase in SNR at the center of the field of view.
Estimates of Noise Covariance and Coil Sensitivity and Generation of SNR Maps
Gradient echo images (TR/TE/flip angle=200 ms/3.92 ms/20°, slice=3 mm, matrix size= 256×256, field of view (FOV)=220 mm, bandwidth (BW)=300 Hz/pixel) were obtained in the sagittal, axial, and coronal planes. For each acquisition, raw k-space data were saved for analysis, and magnitude images reconstructed online were also saved for comparison. A noise reference measurement was obtained by recording complex-valued data during the same pulse sequence used for the image acquisition with no radiofrequency excitation. From the estimates of noise covariance (12) and coil sensitivity, SNR maps were calculated using the root-sum-of-squares combination (4), then corrected on a pixel-by-pixel basis for SNR bias introduced by the magnitude detection (5, 12). SNR was compared using color scale SNR maps and SNR profiles through the knee created in MATLAB (Natick, Mass).
Morphologic Imaging and T2 Mapping of Cartilage at 7 T
For morphologic imaging, a fat-suppressed 3-dimensional fast low-angle shot sequence was performed (3D-FLASH, TR/TE = 26 ms/5.06 ms, field of view = 14 cm, matrix = 512 × 512, slice thickness = 1 mm, acquisition time = 11 minutes 34 seconds). For T2 mapping, a multi-echo spin-echo sequence was performed (MESE, TR/TE = 3000 ms/15, 30, 45, 60, 75, 90 ms, FOV = 14 cm, 128 × 256, slice thickness = 2 mm, acquisition time = 6 mins 29 secs). For the 28 channel coil, we also performed parallel imaging (GRAPPA, 24 reference lines) at acceleration factors of two, three, and four. Geometry (g) factor maps were computed using the raw k-space data as previously described, taking into account the square root of acceleration factor SNR loss (12).
Assessment of Cartilage SNR and CNR
Measurement of SNR in multichannel coils is complicated by the presence of spatial and statistical variation in noise within the field of view, and many techniques are available (13). Since it was impractical to perform the above-described sum-of-squares SNR map for each cartilage imaging sequence on each coil in each individual, cartilage SNR and CNR with adjacent subchondral bone were measured using standard region-of-interest methods described by Eckstein who compared an 8 channel coil with a quadrature coil for cartilage imaging at 3T (14). SNR and CNR were measured at the anterior, central, and posterior aspects of the medial femoral condyle. For the T2-MESE sequence, the earliest TE was used to calculate SNR and CNR.
Assessment of Cartilage Thickness and T2 Relaxation Values
Cartilage thickness at the weight-bearing aspect of the medial femoral condyle and medial tibial plateau was measured on 3D-FLASH images. Cartilage T2 maps and mean cartilage T2 values were calculated via the equation ln((S(TE)/S0) = (−TE/T2) + C, where S(TE) is the measured SI of the image at a given TE, S0 is the signal at the shortest TE, and C is the intercept. Color maps of T2 values were generated using MATLAB (Natick, Mass).
Statistical Analysis
Statistical analysis was performed using SPSS 16.0 (Somers, New York). For both coils, we generated boxplots illustrating SNR and CNR (in anterior, central, and posterior locations) for both the 3D-FLASH and MESE sequences. A Wilcoxon signed-rank test was utilized to determine if there were statistically significant differences in cartilage SNR and CNR obtained with each coil. To assess agreement between measurements of cartilage thickness and T2 values, we generated Bland-Altman plots (15), which plot the difference between measurements (y-axis) and mean of measurements (x-axis). The horizontal dashed lines reflect the mean difference between measurements as well as the limits of agreement (2*SD of difference in measurements).
RESULTS
Representative SNR maps for both coils are shown in Figure 1b. With the 28 channel coil, the SNR gain is approximately 300–400% at the periphery of the field of view and 17% for both femoral and tibial cartilage within the center of the field of view. This is graphically represented for the sagittal acquisition as the SNR profile shown in Figure 1c.
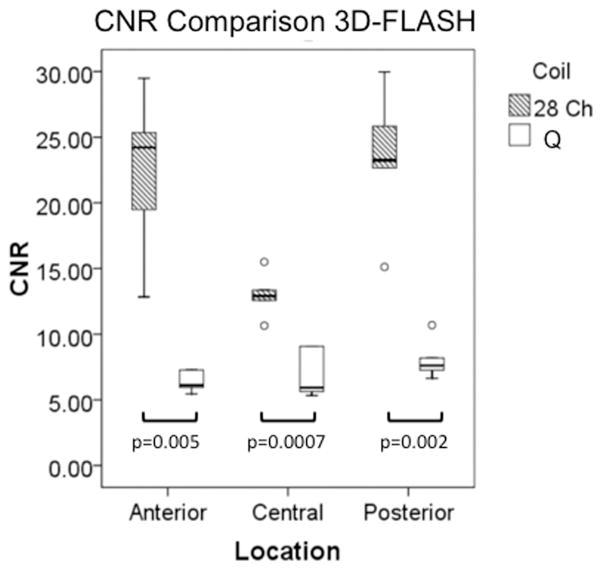
Representative sagittal knee images from one of the volunteers obtained with the 28 channel coil and the quadrature coil utilizing both the 3D-FLASH and the T2 mapping sequences (first-echo) are shown in Figure 2a. T2 maps from the same volunteer are shown in Figure 2b. For both the 3D FLASH and the T2 mapping sequence, SNR and CNR were 100–200% greater in anterior, central and posterior locations for the 28 channel coil compared to the quadrature coil (Figure 3a–3d, p ≤ 0.05).
Figure 2.
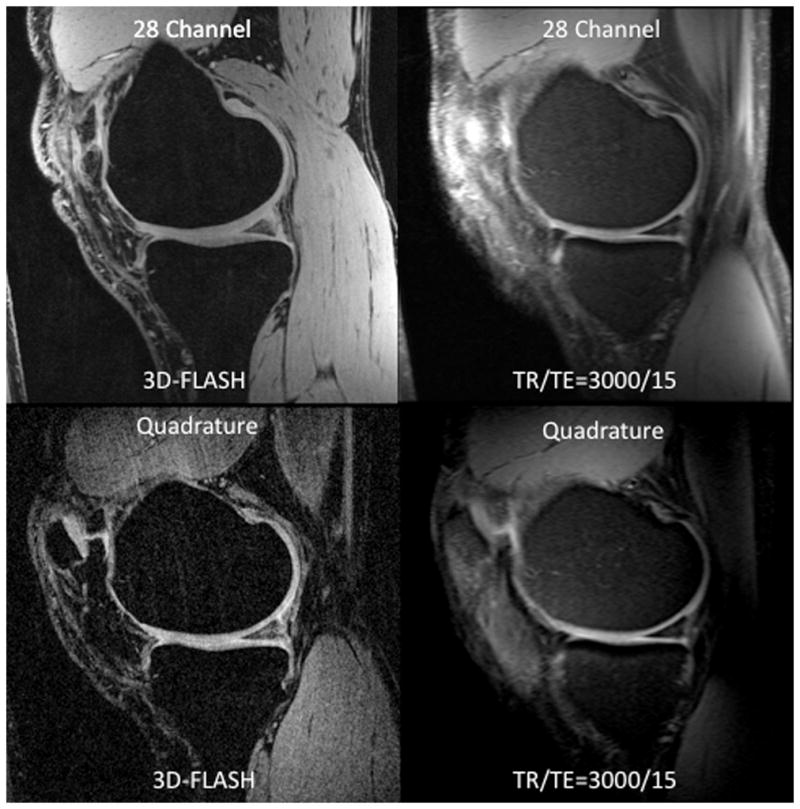
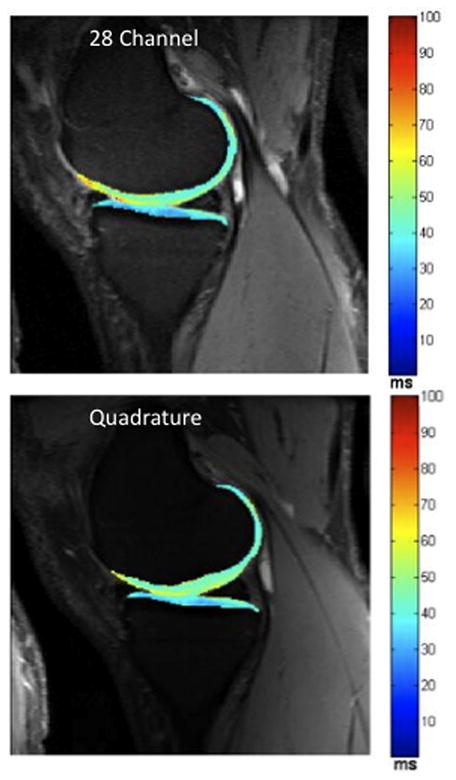
(a–b). (a) Representative sagittal 7 T MR images from a volunteer obtained with the 28 channel coil (top row) and the quadrature coil (bottom row) using the 3D-FLASH sequence (left column) and from the first echo of the T2 multi-echo spin-echo sequence (right column). (b) Corresponding T2 maps from the same volunteer obtained with the 28 channel coil (top) and the quadrature coil (bottom).
Figure 3.
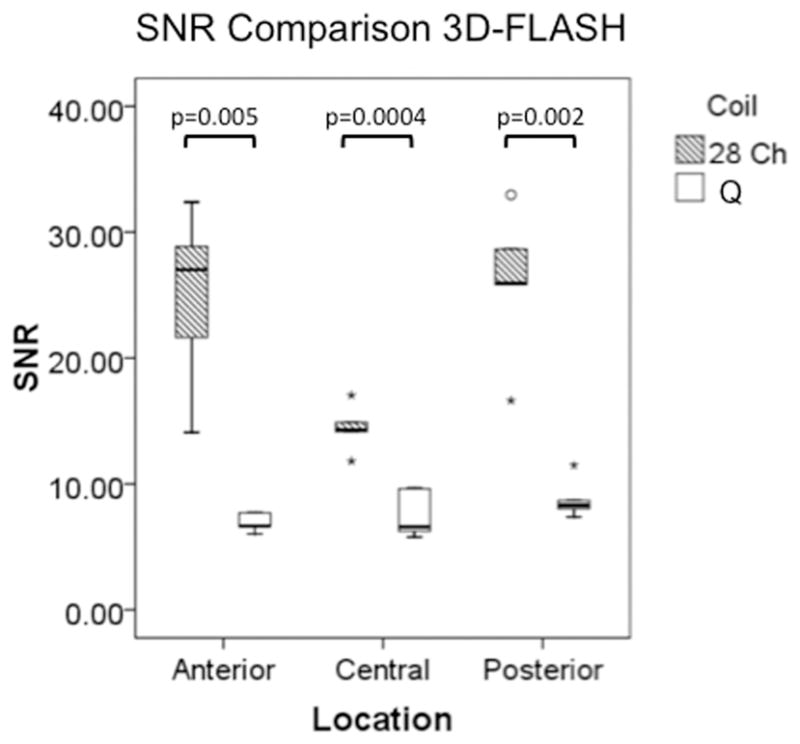
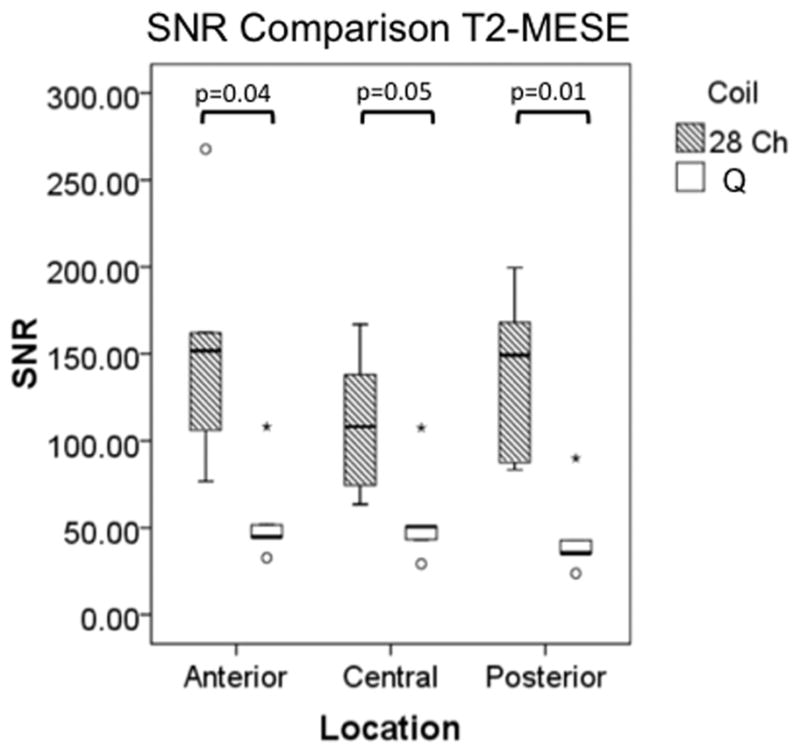
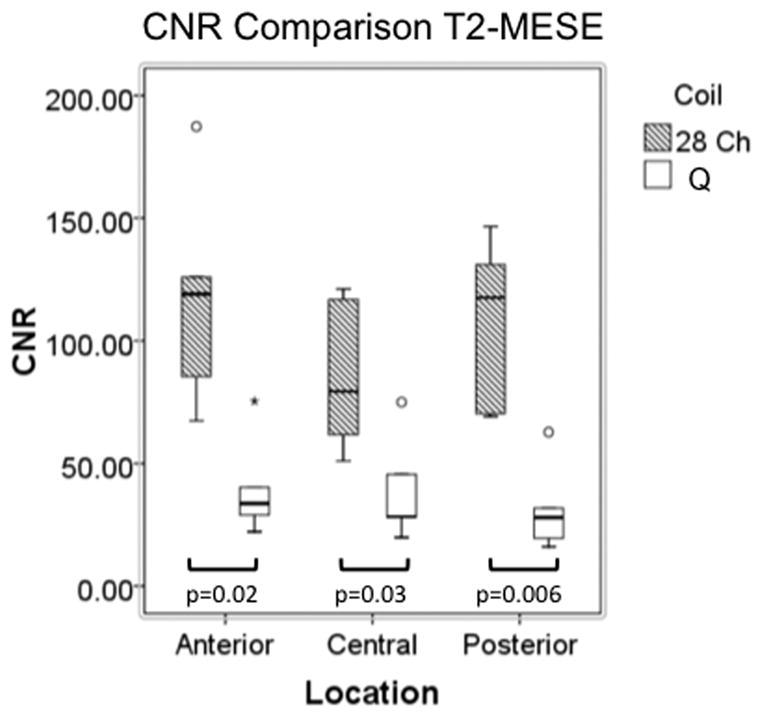
(a–d). Boxplots comparing SNR and CNR with adjacent subchondral bone in the anterior, central, and posterior locations for the 28 channel (28 Ch) coil and the quadrature (Q) coil for both the 3D-FLASH and the T2 multi-echo spin-echo (T2-MESE) sequence. For the T2-MESE sequence, the earliest TE was used to calculate SNR and CNR. For the 3D-FLASH sequence and for the T2-MESE sequence, SNR (a, c) and CNR (b, d) were greater in the 28 channel coil compared to the quadrature coil (p ≤ 0.05 for all).
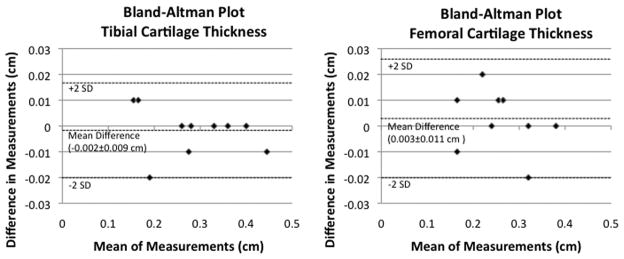
Measurements of tibial and femoral cartilage thickness obtained with each coil are shown in Figure 4a. Bland-Altman plots demonstrate good agreement between measurements of cartilage thickness obtained with each coil as demonstrated by small differences between measurements (Figure 4b). The average difference in measurement of cartilage thickness was −0.002±0.009 cm at the tibia and 0.003±0.011 cm at the femur. Tibial and femoral cartilage T2 values are shown in Figure 4c. Cartilage T2 values obtained with the 28 channel coil were lower than values obtained with the quadrature coil. Bland-Altman plots show poor agreement between measurements of T2 values obtained with each coil as demonstrated by large differences between measurements (Figure 4d). The average difference in measurement of cartilage T2 was −6.8±6.7 ms at the tibia and −8.2±9.7 ms at the femur.
Figure 4.
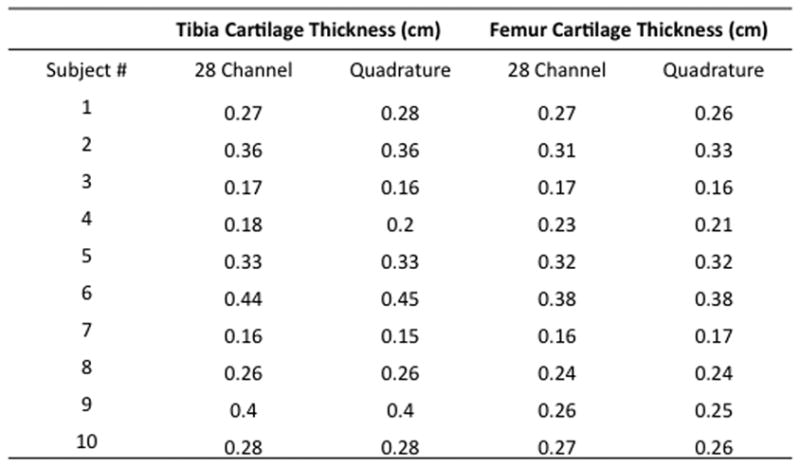
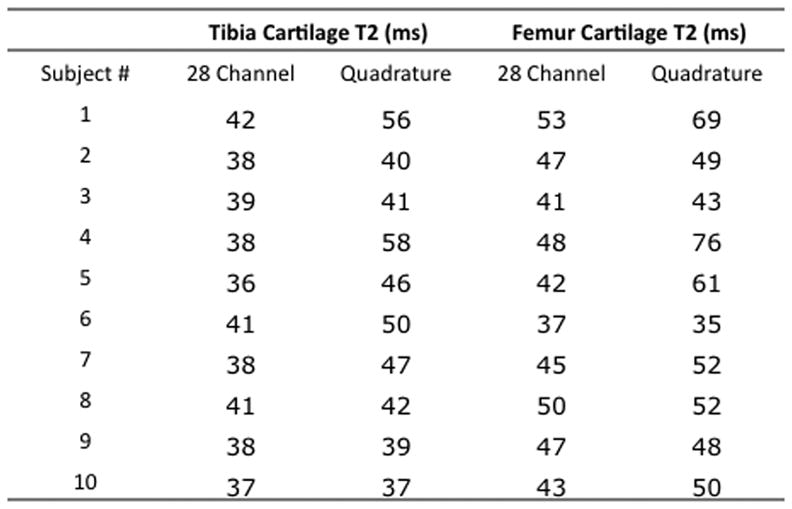
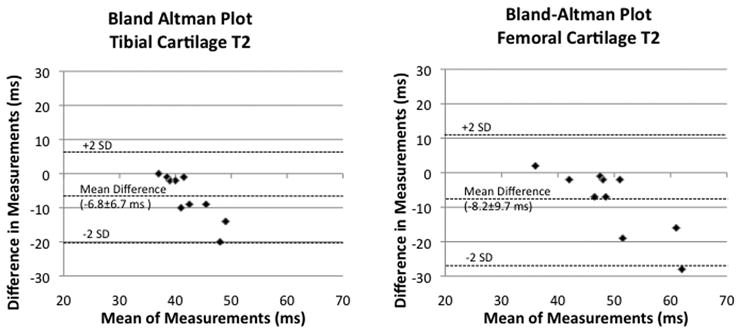
(a–d). (a) Tibial and femoral cartilage thickness measurements (cm) obtained with the 28 channel and quadrature coil for all subjects. (b) Bland-Altman plots show small differences in measurements of cartilage thickness made with the 28 channel coil and quadrature coil. (c) Tibial and femoral cartilage T2 values (ms) obtained with the 28 channel and quadrature coil for all subjects. (d) Bland-Altman plots show large differences in measurements of cartilage T2 values made with the 28 channel and quadrature coil.
Finally, since the 28 channel coil permits parallel imaging, we performed cartilage imaging with acceleration factors (AFs) 1 through 4 (Figure 5a). To assess the effect on SNR, we computed inverse g-factor maps (proportion of SNR retained) for each AF (Figure 5b). For acceleration factors of 2, 3, and 4, values of 1/g were 62–69%, 51–55%, and 39–45%, respectively with scan time reductions of 40–48%, 53–64%, and 61–72%, respectively.
Figure 5.
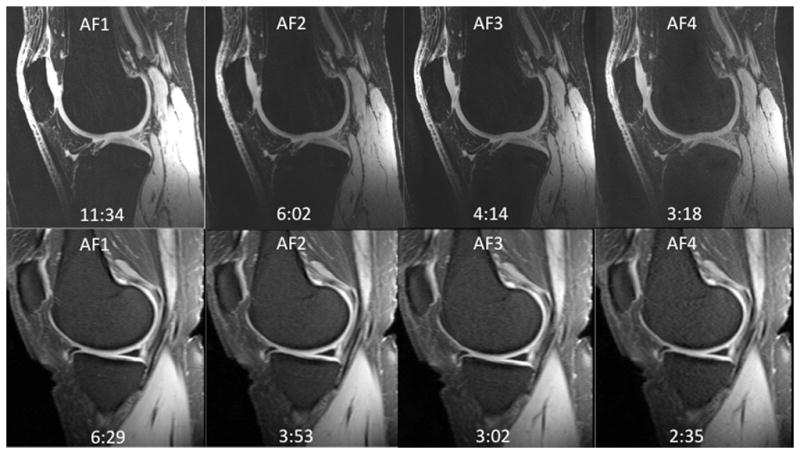
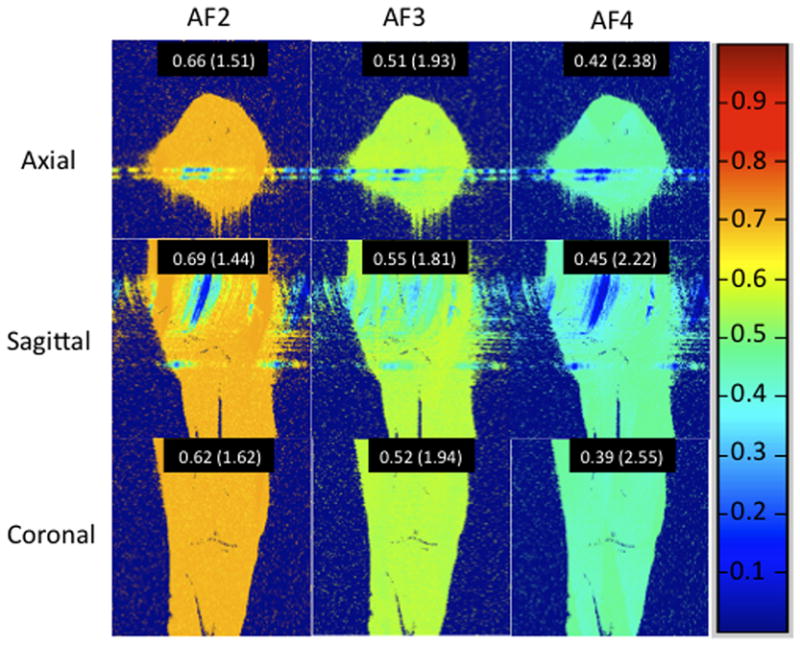
(a–b). (a) 7T knee cartilage imaging using the 28 channel coil with acceleration factor (AF) of 1 (no acceleration) through 4. (b) Inverse geometry-factor (g-factor) maps, demonstrating the proportion of SNR retained at each AF. Mean values for inverse g-factors are shown for each acceleration, with g-factor values shown in parentheses.
DISCUSSION
This study shows that a 28 channel coil provides 17–400% greater SNR/CNR compared to a quadrature coil for morphologic imaging and T2 mapping of knee cartilage at 7 Tesla. There was good agreement between measurements of cartilage thickness obtained with the two coils. However, agreement between measurements of cartilage T2 values obtained with the two coils was poor, with values obtained with the 28 channel coil less than those obtained with the quadrature coil (average difference in measurements of −6.8±6.7 ms at the tibia and −8.2±9.7 ms at the femur). Finally, the greater SNR of the 28 channel coil can be used to perform parallel imaging with an acceleration factor of 2 to obtain nearly the same SNR as the quadrature coil in 40–48% less scan time.
Multichannel phased-array coils provide the increased SNR of small surface coils with the larger field-of-view coverage of volume coils (4). Small surface coils maximize SNR by minimizing radiofrequency losses (energy dissipated or signal reduced) both in the coil and in the sample (16). A properly constructed encircling array should have the same central SNR as an equivalent volume coil, but much higher SNR in the periphery near the array elements (17).
In this study, the 28 channel coil demonstrated improvements in SNR and CNR both at the periphery and the center of the field of view compared to the volume coil. While SNR gains at the periphery were anticipated, the SNR gain within the center of the field of view was not necessarily expected because the coils have a similar diameter. For example, when a 96-channel head coil was compared to an identically sized 32 channel head coil at 3T, SNR gains were demonstrated at the periphery only (10). The ability to achieve SNR gains both at the periphery and at the center of the field of view for a multichannel coil depends on many factors including the ability to maintain body-noise dominant (as opposed to coil-noise dominant) conditions and the ability to reduce mutual inductance between coil elements via appropriate overlapping of coils and optimization of preamp decoupling (6, 10, 16).
The motivation for greater SNR and CNR stems from the desire to improve the visualization of cartilage on MR images, which may translate into improved measurement precision for quantitative assessment of cartilage (2, 14). Eckstein et al. compared a quadrature coil and an eight-channel phased array coil for cartilage morphologic imaging at 3T (14). Similar to the current study, he found greater cartilage SNR and CNR for images obtained with a multichannel coil. The improved SNR and CNR of the eight channel coil did translate into higher precision for measurements of summed cartilage plates.
Only a few studies have evaluated cartilage T2 values at 7T. In 2008, Welsch et al. compared healthy subjects and cartilage repair patients using a volume coil at 7T. The T2 values for healthy volunteers in this study (43.6 ms to 56.6 ms) are similar to values obtained with the volume coil in our study (9). In 2010, Welsch evaluated patellar cartilage T2 values using a surface coil at 3T and 7T (18). The T2 values obtained at 7T in this later study (mean 41.8 ms) were slightly lower than the ones reported in his 2008 volume coil study. Similarly, we have found that T2 values obtained with the 28 channel coil (an array of surface coils) are lower than values obtained with a volume coil. These results may be due to the lower SNR images obtained with the volume coil compared to surface/array coils; at longer echo times, elevated noise may raise the apparent signal detected, resulting in falsely longer T2 values. The results could also be due to differences in the transmit performance of the coils, even though both are birdcage transmit. A complete characterization of the transmit performance of the coils is outside the scope of this paper, but as noted in the Methods above, the 28 channel coil required radiofrequency pulse voltages 20% higher than the quadrature coil to achieve equivalent excitation. Such differences in transmit performance might be de to slight differences in birdcage coil diameters or slight shielding by receive elements in the 28 channel coil. Regardless of the reason, since different cartilage T2 values can be obtained depending on the coil utilized, it will be important to use the same coil during clinical studies of osteoarthritis.
Finally, because the 28 channel coil provides increased SNR compared to the quadrature coil, it is possible to use the additional SNR to perform parallel imaging, allowing decreased scan time. The inverse g-factor maps show that 62–69% of the original SNR with the 28 channel coil is retained at AF2. Based on Figures 1 and 3, this resultant SNR at AF2 is close to the SNR obtained with the quadrature coil at baseline, but involving 40–48% less imaging time. Faster scanning could allow extra sequences to be performed within the same imaging session, thus permitting additional information to be obtained in the same patient.
There are limitations to this study. First, we did not perform a comparison with 3T. Such a comparison will be necessary in the future to determine the benefit of scanning at 7T. Secondly, we did not scan any patients with osteoarthritis in this study. It remains to be determined whether SNR improvements will result in improved cartilage lesion detection, though this appears to be true for 3T compared to 1.5T (19). However, as a preliminary study, our aim was only to compare the performance of these two coils for morphologic imaging and T2 mapping in healthy volunteers. Finally, it remains to be determined whether the increased SNR and CNR of the 28 channel coil could be translated into improved measurement precision, though his does appear to be true for increased SNR at 3T compared to 1.5T (20).
In conclusion, we have shown that a 28 channel coil provides greater SNR and CNR compared to a quadrature coil for morphologic imaging and T2 mapping of knee cartilage at 7 Tesla. Though cartilage thickness measurements obtained with the two coils are similar, the 28 channel coil yields cartilage T2 values that are approximately 20% less than those obtained with the quadrature coil. Coils should be changed with caution during studies of osteoarthritis if T2 mapping is included as a parameter. The greater SNR of the 28 channel coil could be used to perform parallel imaging and obtain similar SNR as the quadrature coil, but in 40–48% less scan time. With further improvements in coil technology, researchers and clinicians should be able to take full advantage of the SNR benefit of UHF MRI.
Acknowledgments
Grant Support: The authors acknowledge grant support from the Radiological Society of North America (RR0806) and the United States National Institutes of Health (K23AR059748, R01AR056260, R01AR053133).
References
- 1.Regatte RR, Schweitzer ME. Ultra-high-field MRI of the musculoskeletal system at 7.0T. J Magn Reson Imaging. 2007 Feb;25(2):262–9. doi: 10.1002/jmri.20814. [DOI] [PubMed] [Google Scholar]
- 2.Gold GE, Suh B, Sawyer-Glover A, Beaulieu C. Musculoskeletal MRI at 3.0 T: initial clinical experience. AJR Am J Roentgenol. 2004 Nov;183(5):1479–86. doi: 10.2214/ajr.183.5.1831479. [DOI] [PubMed] [Google Scholar]
- 3.Krug R, Stehling C, Kelley DA, Majumdar S, Link TM. Imaging of the musculoskeletal system in vivo using ultra-high field magnetic resonance at 7 T. Invest Radiol. 2009 Sep;44(9):613–8. doi: 10.1097/RLI.0b013e3181b4c055. [DOI] [PubMed] [Google Scholar]
- 4.Roemer PB, Edelstein WA, Hayes CE, Souza SP, Mueller OM. The NMR phased array. Magn Reson Med. 1990 Nov;16(2):192–225. doi: 10.1002/mrm.1910160203. [DOI] [PubMed] [Google Scholar]
- 5.Constantinides CD, Atalar E, McVeigh ER. Signal-to-noise measurements in magnitude images from NMR phased arrays. Magn Reson Med. 1997 Nov;38(5):852–7. doi: 10.1002/mrm.1910380524. [DOI] [PMC free article] [PubMed] [Google Scholar]
- 6.Wiggins GC, Triantafyllou C, Potthast A, Reykowski A, Nittka M, Wald LL. 32-channel 3 Tesla receive-only phased-array head coil with soccer-ball element geometry. Magn Reson Med. 2006 Jul;56(1):216–23. doi: 10.1002/mrm.20925. [DOI] [PubMed] [Google Scholar]
- 7.Krug R, Carballido-Gamio J, Banerjee S, Stahl R, Carvajal L, Xu D, et al. In vivo bone and cartilage MRI using fully-balanced steady-state free-precession at 7 tesla. Magn Reson Med. 2007 Dec;58(6):1294–8. doi: 10.1002/mrm.21429. [DOI] [PubMed] [Google Scholar]
- 8.Banerjee S, Krug R, Carballido-Gamio J, Kelley DA, Xu D, Vigneron DB, et al. Rapid in vivo musculoskeletal MR with parallel imaging at 7T. Magn Reson Med. 2008 Mar;59(3):655–60. doi: 10.1002/mrm.21455. [DOI] [PubMed] [Google Scholar]
- 9.Welsch GH, Mamisch TC, Hughes T, Zilkens C, Quirbach S, Scheffler K, et al. In vivo biochemical 7.0 Tesla magnetic resonance: preliminary results of dGEMRIC, zonal T2, and T2* mapping of articular cartilage. Invest Radiol. 2008 Sep;43(9):619–26. doi: 10.1097/RLI.0b013e31817e9122. [DOI] [PubMed] [Google Scholar]
- 10.Wiggins GC, Polimeni JR, Potthast A, Schmitt M, Alagappan V, Wald LL. 96-Channel receive-only head coil for 3 Tesla: design optimization and evaluation. Magn Reson Med. 2009 Sep;62(3):754–62. doi: 10.1002/mrm.22028. [DOI] [PMC free article] [PubMed] [Google Scholar]
- 11.Authors identified in this reference. Citation hidden FOR REVIEW PURPOSES ONLY.
- 12.Kellman P, McVeigh ER. Image reconstruction in SNR units: a general method for SNR measurement. Magn Reson Med. 2005 Dec;54(6):1439–47. doi: 10.1002/mrm.20713. [DOI] [PMC free article] [PubMed] [Google Scholar]
- 13.Dietrich O, Raya JG, Reeder SB, Reiser MF, Schoenberg SO. Measurement of signal-to-noise ratios in MR images: influence of multichannel coils, parallel imaging, and reconstruction filters. J Magn Reson Imaging. 2007 Aug;26(2):375–85. doi: 10.1002/jmri.20969. [DOI] [PubMed] [Google Scholar]
- 14.Eckstein F, Kunz M, Hudelmaier M, Jackson R, Yu J, Eaton CB, et al. Impact of coil design on the contrast-to-noise ratio, precision, and consistency of quantitative cartilage morphometry at 3 Tesla: a pilot study for the osteoarthritis initiative. Magn Reson Med. 2007 Feb;57(2):448–54. doi: 10.1002/mrm.21146. [DOI] [PubMed] [Google Scholar]
- 15.Bland JM, Altman DG. Statistical methods for assessing agreement between two methods of clinical measurement. Lancet. 1986 Feb 8;1(8476):307–10. [PubMed] [Google Scholar]
- 16.Robitaille P-M, Berliner LJ. Ultra high-field magnetic resonance imaging. New York, NY: Springer; 2006. [Google Scholar]
- 17.Wright SM, Wald LL. Theory and application of array coils in MR spectroscopy. NMR Biomed. 1997 Dec;10(8):394–410. doi: 10.1002/(sici)1099-1492(199712)10:8<394::aid-nbm494>3.0.co;2-0. [DOI] [PubMed] [Google Scholar]
- 18.Welsch GH, Apprich S, Zbyn S, Mamisch TC, Mlynarik V, Scheffler K, et al. Biochemical (T2, T2* and magnetisation transfer ratio) MRI of knee cartilage: feasibility at ultra-high field (7T) compared with high field (3T) strength. Eur Radiol. 2010 Dec 12; doi: 10.1007/s00330-010-2029-7. [DOI] [PubMed] [Google Scholar]
- 19.Barr C, Bauer JS, Malfair D, Ma B, Henning TD, Steinbach L, et al. MR imaging of the ankle at 3 Tesla and 1.5 Tesla: protocol optimization and application to cartilage, ligament and tendon pathology in cadaver specimens. Eur Radiol. 2007 Jun;17(6):1518–28. doi: 10.1007/s00330-006-0446-4. [DOI] [PubMed] [Google Scholar]
- 20.Bauer JS, Krause SJ, Ross CJ, Krug R, Carballido-Gamio J, Ozhinsky E, et al. Volumetric cartilage measurements of porcine knee at 1.5-T and 3.0-T MR imaging: evaluation of precision and accuracy. Radiology. 2006 Nov;241(2):399–406. doi: 10.1148/radiol.2412051330. [DOI] [PubMed] [Google Scholar]


