

Background: Human holocarboxylase synthetase catalyzes post-translational biotin addition to five biotin-dependent carboxylases.
Results: Kinetic measurements indicate discrimination in HCS-catalyzed biotinylation of the five physiological substrates.
Conclusion: Mitochondrial substrates are modified at rates significantly faster than are cytosolic substrates.
Significance: Selectivity in post-translational biotin addition provides one mechanism of regulating important physiological processes, including gluconeogenesis and fatty acid and amino acid metabolism.
Keywords: Biotin, Kinetics, Metabolic Regulation, Post-translational Modification, Protein-Protein Interactions, Single Turnover Kinetics, Steady State Kinetics
Abstract
Human holocarboxylase synthetase (HCS) catalyzes linkage of the vitamin biotin to the biotin carboxyl carrier protein (BCCP) domain of five biotin-dependent carboxylases. In the two-step reaction, the activated intermediate, bio-5′-AMP, is first synthesized from biotin and ATP, followed by covalent linkage of the biotin moiety to a specific lysine residue of each carboxylase BCCP domain. Selectivity in HCS-catalyzed biotinylation to the carboxylases was investigated in single turnover stopped flow and quench flow measurements of biotin transfer to the minimal biotin acceptor BCCP fragments of the carboxylases. The results demonstrate that biotinylation of the BCCP fragments of the mitochondrial carboxylases propionyl-CoA carboxylase, pyruvate carboxylase, and methylcrotonoyl-CoA carboxylase is fast and limited by the bimolecular association rate of the enzyme with substrate. By contrast, biotinylation of the acetyl-CoA carboxylase 1 and 2 (ACC1 and ACC2) fragments, both of which are accessible to HCS in the cytoplasm, is slow and displays a hyperbolic dependence on substrate concentration. The correlation between HCS accessibility to biotin acceptor substrates and the kinetics of biotinylation suggests that mitochondrial carboxylase sequences evolved to produce fast association rates with HCS in order to ensure biotinylation prior to mitochondrial import. In addition, the results are consistent with a role for HCS specificity in dictating biotin distribution among carboxylases.
Introduction
Many post-translational modification enzymes must have specificity toward their intended targets but at the same time be sufficiently promiscuous to allow interaction with multiple partners. Biotin attachment is a post-translational modification essential for biotin-dependent carboxylase function. In mammalian cells, biotin linkage is catalyzed in a stepwise fashion by human holocarboxylase synthetase (HCS)2 in the following reaction.
 |
First, an activated intermediate, bio-5′-AMP, is synthesized from biotin and ATP with the release of pyrophosphate. In the second step, the biotin moiety is covalently attached to a specific lysine residue on the biotin carboxyl carrier protein (BCCP) domain of a carboxylase (1). At least three HCS variants are present in mammalian cells, two of which arise from differential mRNA splicing (2–4). The full-length variant (FL-HCS) is composed of 726 amino acids, and a shorter isoform (58-HCS) lacks the N-terminal 57 amino acids.
In mammalian cells, five carboxylases require post-translational biotin addition (5). Acetyl-CoA carboxylase 1 (ACC1) is a cytosolic enzyme that catalyzes the conversion of acetyl-CoA to malonyl-CoA, the first committed step of fatty acid biosynthesis (6). Acetyl-CoA carboxylase 2 (ACC2), although a product of a different gene, catalyzes the same reaction as ACC1 (5–6), is involved in fatty acid oxidation, and localizes to the cytosolic side of the mitochondrial membrane (7). Propionyl-CoA carboxylase (PCC) catalyzes synthesis of S-methylmalonyl-CoA from propionyl-CoA, which is part of the odd fatty acid synthesis pathway, and is also involved in isoleucine, threonine, methionine, and valine catabolism (5). Pyruvate carboxylase (PC) also localizes to the mitochondrial matrix and carboxylates pyruvate to produce oxaloacetate, a reaction that is integral to gluconeogenesis (5). Finally, mitochondrial methylcrotonoyl-CoA carboxylase (MCC) converts 3-methylcrotonoyl-CoA to 3-methylglutaconyl-CoA, a reaction that contributes to the leucine degradation pathway (5).
Previously, using single turnover assays in which biotin transfer to BCCP was monitored independent of bio-5′-AMP synthesis, it was demonstrated that FL-HCS discriminates among BCCP substrates from different species (8). The use of single turnover methods was necessary because comparison of steady state parameters for the overall two-step reaction with the rate of bio-5′-AMP synthesis alone indicated that intermediate synthesis is rate-limiting in the overall reaction (9, 10). These studies revealed that HCS biotinylates the BCCP domain of human PCC, does not biotinylate the BCCP domain from an archeal organism, and only slowly biotinylates the Escherichia coli acceptor protein (8). However, HCS selectivity in biotin transfer to endogenous, biologically relevant substrates is unknown.
In order to investigate HCS substrate specificity among mammalian carboxylases, single turnover assays were used to determine the rates of biotin transfer by FL- and 58-HCS to the BCCP domains of ACC1, ACC2, PC, PCC, and MCC (Fig. 1A). Transfer rates measured for the BCCP domains of the mitochondrial carboxylases PC, PCC, and MCC are faster than those for ACC1 and ACC2. In addition, the apparent rate versus concentration profiles are strikingly different for the latter two substrates. Whereas the BCCP fragments of MCC, PC, and PCC display linear dependences of the apparent rate on substrate concentration, those of ACC1 and ACC2 yielded hyperbolic dependences, suggesting a difference in the identity of the rate-limiting step for these two substrates. Because ACC1 and ACC2 are continuously accessible to HCS in the cytoplasm, whereas the remaining carboxylases are transported into the mitochondria, the different kinetic behaviors correlate with the carboxylase localization. A model consistent with these observations is proposed, whereby HCS biotinylates PC, PCC, and MCC at relatively faster rates because these enzymes are only transiently present in the cytoplasm and must be post-translationally modified prior to compartmentalization. Additionally, the results support a hierarchy that determines biotin distribution among carboxylases based on the rates of bimolecular association and carboxylase abundance.
FIGURE 1.

Mammalian biotin-dependent carboxylases. A, the PC BCCP fragment used for these studies shown in the context of the complete carboxylase structure. BC, biotin carboxylase domain; TC, transcarboxylase domain. The figure was generated using MolMol (23) with Protein Data Bank file 3BG5, which contains coordinates for Staphylococcus aureus PC carboxylase, as input (24). B, ClustalW multiple sequence alignment of the minimal biotin acceptor domains of the five mammalian biotin-dependent carboxylases, highlighting residues that are similar (gray) or identical (black). The biotin acceptor lysine lies in the conserved MKM sequence.
EXPERIMENTAL PROCEDURES
Chemicals and Biochemicals
All chemicals used were at least reagent grade. The concentrated biotin stock was prepared by dissolving a carefully weighed amount of d-biotin (Sigma) powder in reaction buffer, adjusting the pH to 7.5, and bringing up the final desired volume in a volumetric flask. After filtering through 0.22-μm syringe filter units (Millipore), 1-ml aliquots were stored at −70 °C. Because of its limited solubility, the biotin stock concentrations were always lower than 850 μm. The d-biotin (8,9-3H(N)) (PerkinElmer Life Sciences) was aliquoted and stored under argon gas in sealed containers at −70 °C. The ATP solutions were prepared by dissolving the dry powder (Sigma) in water and adjusting the pH to 7.5 by adding sodium hydroxide. After determining the concentration by UV absorbance using an extinction coefficient of 15,400 m−1 cm−1 at 259 nm, the solution was divided into 0.5-ml aliquots and stored at −70 °C. The enzyme and biotin acceptor substrate concentrations were determined from their UV absorption spectra using extinction coefficients calculated according to the method of Gill and von Hippel (11).
Design and Construction of BCCP Expression Plasmids
The SUMO fusion plasmid used for expression of the 67-amino acid-long C-terminal region of PCC carboxylase was described previously (8). This minimal biotin acceptor fragment corresponds to the 67 amino acids of the BCCP domain described by Leon-Del-Rio (residues 662–728), preceded by an additional exogenous N-terminal tyrosine introduced to aid in protein concentration determination by UV spectroscopy (12–14). ClustalW (15) multiple sequence alignment of the PCC BCCP minimal acceptor sequence with those of the remaining carboxylases served as a guide in selection of the corresponding regions of MCC, PC, and ACC2 (Fig. 1B). The coding regions for PC (residues 1112–1178), MCC (residues 649–715), and ACC2 (residues 897–962) BCCP domains were cloned into the SUMO-pro vector (LifeSensors) to yield constructs with a cleavable N-terminal His6-SUMO tag. The fragment sequences were amplified using Taq polymerase (Invitrogen) with PCR primers that introduced Eco31I (Fermentas) sites. In addition, in order to facilitate concentration determination, the amplification primers for PC BCCP were designed to introduce an exogenous tyrosine residue after the SUMO cleavage site. Additionally, because the SUMO protease does not cleave before a proline residue, a glycine residue was introduced at the N terminus of the MCC BCCP sequence. A plasmid encoding the full-length PC carboxylase (a gift from Dr. Lian Tong, Columbia University) was used as the template to amplify PC BCCP. The cDNA for subunit A of methyl crotonyl CoA carboxylase (Origene, Inc.) was used to amplify the MCC BCCP fragment. ACC2 BCCP was amplified from a pBSK plasmid containing the ACC2 BCCP coding sequence (Epoch Biolabs, Inc). After restriction enzyme digestion and agarose gel purification of the PCR products and the SUMO-pro vector, the fragments were ligated using T4 DNA ligase (Roche Applied Science). The resulting ligation reactions were transformed by electroporation into E. coli Top10 cells, and successful transformants were identified as ampicillin-resistant. Plasmid DNA from an antibiotic-resistant clone was isolated, and the sequence was verified (IBBR DNA sequencing facility).
The coding sequences for ACC2 (residues 891–965) and ACC1 (residues 785–859) BCCP fragments were cloned into a pET28 vector, introducing an uncleavable C-terminal hexahistidine tag. The primers used for PCR amplification contained NcoI and XhoI sites (New England Biolabs, Inc.). Template DNA plasmids containing the coding sequences for the two ACC BCCP domains were purchased from Epoch Biolabs Inc. After digestion, fragment purification, and ligation of the PCR products with the vector, the ligation mixtures were transformed into E. coli Top10 cells, and transformants were selected for kanamycin resistance. Plasmids were extracted using a miniprep plasmid extraction kit (Zymo Research). For ACC1, this plasmid DNA served as the template for replacement of the three cysteine codons with serine codons using the QuikChange multisite-directed mutagenesis kit (Stratagene, Inc). For both clones, DNA sequencing of the complete insert was used to verify the accuracy of each construct.
Protein Expression and Purification
FL-HCS, 58-HCS, and the PCC BCCP domain were purified as described previously (8, 9). ACC2, MCC, and PC BCCP domains were also purified by affinity chromatography as His6-SUMO fusions. Plasmids were transformed by electroporation into Rosetta BL21λDE3, and clones were selected for growth on 100 μg/ml ampicillin and 34 μg/ml chloramphenicol. A single colony was used to inoculate 5 ml of LB medium supplemented with antibiotics, and the culture was grown overnight at 37 °C with shaking at 250 rpm. After dilution into 50 ml of medium and 8 h of growth, the culture was used to inoculate 1 liter of medium containing antibiotics. When the A600 reached 0.6, the temperature was lowered to 20 °C, and expression was induced for 18–20 h by the addition of 0.1% (w/v) lactose. All subsequent steps were carried out at 4 °C. Cells were harvested by centrifugation at 4500 rpm. The resulting pellet was resuspended in 200 ml of lysis buffer (50 mm sodium phosphate, pH 8, 300 mm KCl, 10 mm imidazole, 5% (v/v) glycerol, 1 mm PMSF, 3 mm 2-mercaptoethanol), and cells were pelleted by centrifugation at 6000 rpm. The pellet was resuspended in a volume corresponding to 5 times its weight of lysis buffer, and cells were lysed by sonication until the A600 was reduced to 10% of its original value. The lysate was spun at 8000 rpm, and the supernatant was loaded on 10 ml of Ni2+-NTA resin (Qiagen) equilibrated with lysis buffer. The column was washed with lysis buffer containing 20 and then 50 mm imidazole until the absorbance returned to base line, after which the protein was eluted with Ni2+-NTA elution buffer (50 mm sodium phosphate, pH 8, 300 mm KCl, 250 mm imidazole, 5% (v/v) glycerol). SUMO protease-1, which was purified using a plasmid that was a generous gift from Dr. Christopher Lima (16), was added at a 1:100 (weight/weight) ratio, and the resulting sample was dialyzed overnight into SUMO protease digestion buffer (10 mm sodium phosphate, pH 8.0, 60 mm NaCl, 5% (v/v) glycerol, 5 mm 2-mercaptoethanol). The SUMO tag and SUMO protease were removed by passing the sample through the Ni2+-NTA column equilibrated with lysis buffer. The sample was concentrated down to 5 ml by dialysis against a viscous solution of PEG 20000 in storage buffer (10 mm Tris, pH 8.0, 200 mm KCl, 5% glycerol) and was loaded at flow rate of 0.1 ml/min on a 1.5 × 75-cm column containing 140 ml of Sephacryl S-100 resin equilibrated in storage buffer with 1 mm 2-mercaptoethanol for PC and MCC or 1 mm DTT for ACC2. Before loading the PC BCCP sample onto the size exclusion column, as described for MCC and ACC2, the sample was dialyzed against Q-Sepharose starting buffer (10 mm Tris, pH 7.5, at 4 °C, 30 mm NaCl, 5% (v/v) glycerol, 1 mm 2-mercaptoethanol) and loaded on 10 ml of Q-Sepharose resin (GE Healthcare) in a 1.5 × 10-ml Econo-Column (Bio-Rad) at 0.5 ml/min. After washing until the absorbance returned to base line, the protein was eluted at a flow rate of 0.5 ml/min using a linear NaCl gradient in Q-Sepharose buffer (30 mm to 1.0 m) of a total volume of 300 ml.
The ACC1 and a second ACC2 BCCP fragment were expressed as C-terminal His6-tagged fusion proteins. The design of these fragments, which are referred to as ACC1-His6 and ACC2-His6, was based on the ACC2 BCCP fragment described by Lee et al. (17). Their expression was carried out in Rosetta E. coli cells using a protocol similar to the one described for PC and MCC, with the exception that expression was induced with 1.5% (w/v) lactose, and selection was provided by 50 μg/ml kanamycin and 34 μg/ml chloramphenicol. After harvesting, washing, and resuspension in lysis buffer, the cells were lysed by sonication. After clearing the sample of insoluble debris by centrifugation, the supernatant was loaded on Ni2+-NTA resin. The column was washed with 20 and 50 mm imidazole in lysis buffer, and the protein was eluted with Ni2+-NTA elution buffer. The ACC1-His6 sample was then dialyzed into Q-Sepharose staring buffer, loaded on 10 ml of Q resin, and eluted with a gradient of Q-Sepharose elution buffer as described for PC BCCP. The ACC2-His6 sample did not require an ion exchange column. Both samples were concentrated to a 5-ml volume and chromatographed on Sephacryl S-100 columns as described above. All BCCP fragment preparations were determined to be >99% pure, as judged by electrophoresis on 16.5% polyacrylamide-SDS-Tricine gels (18). In addition, each BCCP preparation was tested using MALDI-TOF mass spectrometry for the absence of contamination with biotinylated BCCP as well as its ability to be quantitatively biotinylated by HCS (10). Samples were dialyzed into storage buffer and passed through 0.22-μm syringe filter units (Millipore). After UV spectrophotometric determination of their concentrations, the proteins were aliquoted in 500-μl volumes and stored at −70 °C.
Sedimentation Equilibrium Measurements
The molecular weights of PC, MCC, ACC1-His6, and ACC2-His6 were determined by equilibrium analytical ultracentrifugation. Measurements were performed in an Optima XL-I analytical ultracentrifuge (Beckman-Coulter) equipped with a four-hole AnTi-60 rotor. Centrifugation was performed at 20 °C with samples that had been extensively dialyzed against reaction buffer (10 mm Tris, pH 7.5, at 20 °C, 200 mm KCl, 2.5 mm MgCl2). In dialysis of BCCP fragments containing cysteine residues, the buffer contained 0.5 mm TCEP. Approximately 110 μl of sample at three different concentrations ranging from 40 to 400 μm were loaded into a cell assembled with a 12-mm six-channel charcoal-filled epon centerpiece equipped with sapphire windows. Scans were performed at 276 nm after a delay period of 8 h at two different speeds (28,000 and 32,000 rpm) as an average of five replicates with a 0.001-cm radial step size. In each case, a value for the reduced molecular weight, σ, was obtained by subjecting the data to global analysis using a single species model in WinNonLin (19), which was converted to molecular weight using the following equation,
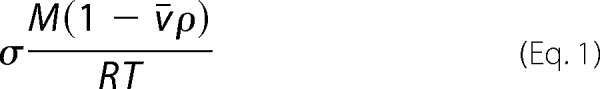 |
in which M is the molecular mass, v̄ is the partial specific volume of the protein, ρ is the buffer density, ω is the angular velocity, R is the gas constant, and T is the temperature. The reaction buffer density was 1.017 g/ml. Partial specific volumes were calculated based on the protein sequences using the program SedenTerp (available on the World Wide Web) and had values of 0.7375 ml/g for PCC BCCP, 0.7593 ml/g for PC BCCP, 0.7485 ml/g for MCC BCCP, 0.7274 ml/g for ACC2-His6, and 0.7311 ml/g for ACC1-His6.
Stopped Flow Measurements of Biotin Transfer
Biotin transfer was measured using a Kintek SF-2001 instrument as described previously (8–10). The method allows monitoring of the time-dependent increase in intrinsic tryptophan florescence that accompanies the disappearance of the enzyme intermediate upon biotin transfer (9, 10). In the experiments, one syringe contained a fixed concentration of enzyme-intermediate complex, whereas the second contained varying concentrations of the BCCP substrates, and reactions were initiated by rapidly mixing equal volumes of the two solutions. The enzyme intermediate complex was preformed by incubating 1 μm HCS with 0.5 μm biotin and 500 μm ATP in reaction buffer at 20 °C for 20 min, thus allowing bio-5′-AMP synthesis to occur. The excitation wavelength was 295 nm, and the emitted fluorescence as a function of time was monitored using a 340-nm cut-off filter (Corion Corp.). At least five transients were collected at each BCCP concentration, and the apparent rates were obtained by fitting each to an appropriate exponential model using the software provided with the Kintek instrument. Subsequent linear regression or non-linear least squares fitting to the Michaelis-Menten equation were performed using PRISM 5 (GraphPad, Inc).
Quenched Flow Measurements of Biotin Transfer
The rates of HCS-catalyzed biotin incorporation into the PC, PCC, and MCC BCCP fragments were monitored using a QF-3 quenched flow instrument as described previously (8). A single turnover of biotin transfer from HCS to BCCP was monitored by quantitating the amount of tritium-labeled biotin incorporated into the BCCP fragments. Briefly, a solution of enzyme-intermediate, HCS·bio-5′-AMP, which was preformed by incubating 1 μm ligase, 0.463 μm biotin, 37 nm [3H]biotin, and 500 μm ATP in reaction buffer at 20 °C for 20 min, was rapidly mixed with an equal volume of a BCCP solution. At each BCCP concentration, the biotin transfer reaction was repeatedly initiated and quenched with 2 m HCl after aging for an increasing amount of time. The reactions involving ACC1-His6, ACC2-His6, and ACC2 BCCP fragments were sufficiently slow to allow hand mixing of the enzyme-intermediate with substrate in a 280-μl total volume, followed by quenching of 24 μl in 180 μl of 2 m HCl at different times. BSA was added to a final concentration of 0.1 mg/ml, and the sample was transferred to dried 3MM Whatman paper squares prespotted with 200 μl of 800 μm biotin in 10% TCA. The papers were washed twice in 250 ml of cold 10% TCA and rinsed once with ethanol. After drying, the radioactivity on the papers was counted in an LS6500 Beckman counter using 5 ml of ReadyProtein+ (Beckman) scintillation fluid. After background correction, conversion from dpm to μm biotin was carried out using the relation between counting signal and molar quantity obtained from the precipitation of a reaction in which [3H]biotin was quantitatively incorporated. Apparent rates were obtained by fitting the transients to a single exponential model. The apparent rates versus concentration profiles were fit using either linear regression in the case of PCC, PC, and MCC or non-linear least square regression to the Michaelis-Menten equation in the case of ACC1-His6 and ACC2-His6.
Steady State Measurements of the Overall Biotin Transfer Reaction
Measurements of the overall HCS-catalyzed reaction as a function of BCCP concentration were performed by monitoring the incorporation of [3H]biotin into BCCP. The protocol is based on a previously published assay (20), with the following modifications. The reactions were carried out in reaction buffer at 20.0 ± 0.1 °C and contained between 100 and 300 nm HCS, 60 nm [3H]biotin, 10 μm biotin, 1 mm ATP, and variable BCCP fragment concentration. At designated time points, typically up to 5 min for the mitochondrial substrates or 45 min for the ACC-derived fragments, a 20-μl aliquot was quenched into a solution containing 5 μl of 10% TCA (in H2O) and 0.4 mg/ml BSA. After quenching, 20 μl were spotted on dried 2 × 2-cm Whatman 3MM papers that had been soaked in 10% TCA and 1 mm biotin. Unincorporated biotin was removed by washing the papers twice in 100 ml of cold 10% TCA and rinsing with ethanol. The acid-insoluble radioactivity retained on the papers was quantified as described above. Initial velocity versus substrate concentration data were subjected to nonlinear least squares analysis using the Michaelis-Menten equation with Prism 5 (GraphPad) to obtain Vmax and Km.
RESULTS
Design and Preparation of BCCP Fragments
Investigation of selectivity in HCS-catalyzed post-translational biotin addition to the five natural carboxylase targets requires the availability of acceptor protein substrates in sufficient quantities for detailed kinetic measurements. Human carboxylases are large proteins with complex oligomeric structures (Fig. 1A). Fortunately, it has previously been shown that a 67-residue fragment of the BCCP domain of human propionyl-CoA carboxylase contains all of the information necessary for HCS-catalyzed biotinylation (14) (Fig. 1B). Moreover, this fragment can be readily overexpressed and purified in large quantity using the SUMO fusion protein strategy (8). A similar strategy was used to obtain BCCP fragments of the remaining carboxylases. Multiple sequence alignment of the PCC fragment with the sequences of the remaining carboxylases was used to identify the corresponding biotin acceptor regions of MCC, PC, ACC1, and ACC2. The BCCP domains of PC and MCC were purified in quantities greater than 10 mg/liter of bacterial culture using the strategy employed previously for the PCC fragment. By contrast, several problems were encountered in purification of the ACC2 and ACC1 fragments. Yields of the ACC1 fragment were low (1 mg/liter), and the SUMO-ACC1 fragment could not be cleaved, even when extended to include seven additional endogenous residues before the tag. Consequently, based on the ACC2 BCCP fragment design of Lee et al. (17), which yielded a protein that both folds into the expected structure and is functional in biotin transfer, the two acceptor domains were produced as His6 fusion proteins. Relative to the MCC, PC, and PCC acceptor domains, both ACC1 and ACC2 fragments contained three additional endogenous residues, the noncleavable LEHHHHHH tag at the C terminus, and 6 additional endogenous residues at the N terminus. In addition, in order to prevent aggregation due to nonspecific disulfide bond formation, the three cysteine residues of ACC1-His6 were replaced by serine.
Oligomeric States of BCCP Fragments
Interpretation of the kinetic data was facilitated by determining the oligomeric states of all BCCP fragments using equilibrium analytical ultracentrifugation. Samples prepared at three different concentrations of each protein were allowed to reach equilibrium at two different speeds, and the resulting six scans were globally fit to a single species model to obtain values for σ, the reduced molecular weight. The σ values correspond to molecular weights that are consistent with the monomeric BCCP species at the concentrations relevant to our studies (Table 1). The FL-HCS and 58-HCS have previously been shown to be monomers in both the unliganded and bio-5′-AMP-bound forms (9).
TABLE 1.
Assembly states of BCCP fragments
| BCCP | Analytical Mr | Experimental Mr |
|---|---|---|
| PCC | 7033 | 7200 ± 500a,b |
| MCC | 7462 | 7600 ± 700b |
| PC | 7254 | 8000 ± 1000b |
| ACC1-His6 | 9234 | 9400 ± 900b |
| ACC2-His6 | 9408 | 9700 ± 600b |
a Value obtained from Ingaramo and Beckett (8).
b Molecular weights with 67% confidence limits obtained from global nonlinear least-squares analysis of equilibrium sedimentation data using WinNonLin.
Biotin Transfer Assays
The rate-determining step in the overall two-step biotinylation reaction catalyzed by HCS is bio-5′-AMP synthesis (8, 9). Consequently, in steady state measurements, information about the selectivity in the second step of biotin transfer from the adenylate to the acceptor protein is lacking. Therefore, two single-turnover assays were used to monitor the biotin transfer reaction independent of bio-5′-AMP synthesis (8–10). In both assays, biotin and ATP are first preincubated with HCS to allow bio-5′-AMP synthesis, the resulting enzyme-intermediate complex is rapidly mixed with BCCP, and biotin transfer is monitored as a function of time. The reaction monitored is as follows.
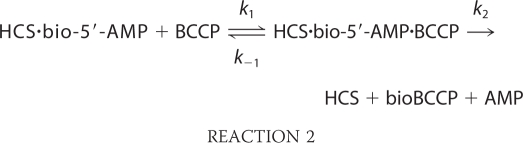 |
The stopped flow assay allows observation of the time-dependent increase in HCS intrinsic fluorescence that accompanies biotinylation (Fig. 2A). Transients obtained upon mixing equal volumes of a constant concentration of enzyme-bio-5′-AMP with BCCP at different concentrations fit to a single exponential model, except in the case of the PCC fragment. For this substrate, the stopped flow traces display a second slow phase, the rate of which is independent of BCCP concentration and is, therefore, interpreted as reporting on product dissociation (k2). The second assay, which employs a quench flow system, follows the product, bio-BCCP, accumulation and is based on the quantitation of the amount of [3H]biotin incorporated into BCCP. Each transient is obtained after repeatedly initiating the biotinylation reaction by mixing preformed enzyme intermediate complex with BCCP and quenching, with the addition of 2 m HCl, at different times (Fig. 2B). After protein precipitation with TCA, the acid-insoluble radioactivity is quantified to measure biotin incorporation. All transients obtained from this analysis are well described by a single exponential model.
FIGURE 2.

Single turnover assays of biotin transfer. A, stopped flow fluorescence (arbitrary units) trace obtained upon mixing 1:1 (v/v) of 0.5 μm FL-HCS·bio-5′-AMP with 120 μm MCC BCCP. The solid line represents the best fit of the data to a single exponential model. B, transient obtained by quantifying the amount of [3H]biotin incorporation after mixing equal volumes 0.5 μm FL-HCS·bio-5′-AMP and 120 μm MCC BCCP for different times before quenching. The solid line represents the best fit of the data to a single exponential model.
Biotin Transfer to MCC, PC, and PCC BCCPs Is Fast and Limited by Enzyme-Substrate Collision
Three of the BCCP fragments, including those of PC, MCC, and PCC, exhibit similar kinetic behavior in HCS-catalyzed biotin transfer. For all three substrates, the dependence of the apparent transfer rates measured by stopped flow fluorescence on BCCP concentration is linear (Fig. 3, A and B) with no leveling off at high substrate concentration. For the PCC fragment, which is characterized by biphasic transients, the linear dependence was obtained for the faster kinetic phase. The simplest interpretation of this behavior, which has previously been observed for the human, E. coli, and Pyrococcus horikoshii enzymes (8–10), is that it reports on the bimolecular association of the enzyme-bio-5′-AMP intermediate with the BCCP substrate, with the slope providing the bimolecular rate constant, k1. The magnitudes of k1 obtained for the three carboxylase substrates reveal moderate selectivity in the process with rate constants spanning a 3.5-fold range in the order PCC > MC > PC (Table 2).
FIGURE 3.

Dependence of the apparent rate of biotin transfer on BCCP concentration measured by stopped flow (filled symbols) and quench flow (open symbols). A, rate versus concentration profiles obtained by stopped flow for FL-HCS with PCC (●), MCC (▴), and PC (■) BCCPs and those obtained by quench flow for PCC (○), MCC (△), and PC (□) BCCPs. B, rate versus concentration profiles obtained by stopped flow for 58-HCS with PCC (●), MCC (▴), and PC (■) BCCPs and by quench flow for PCC (○), MCC (△), and PC (□) BCCPs. The data points represent the average of the apparent rate measured at each BCCP concentration in three independent experiments in the stopped flow or two independent experiments in the quench flow, with S.D. values shown as error bars. The solid lines were obtained from linear regression of the data.
TABLE 2.
FL- and 58-HCS biotin transfer rates to PCC, MCC, and PC BCCP
| HCS variant | BCCP | Stopped flowa | Quench flowb |
|---|---|---|---|
| × 104m−1s−1 | × 104m−1s−1 | ||
| FL-HCS | PCC | 3.5 ± 0.3c (0.23 ± 0.03)c,d | 3.1 ± 0.3c |
| MCC | 1.9 ± 0.2 | 1.9 ± 0.2 | |
| PC | 1.00 ± 0.07 | 1.00 ± 0.05 | |
| 58-HCS | PCC | 3.2 ± 0.2 (0.21 ± 0.02)d | 3.5 ± 0.3 |
| MCC | 2.03 ± 0.05 | 1.81 ± 0.07 | |
| PC | 1.2 ± 0.1 | 1.28 ± 0.05 |
a The errors represent the S.D. of the rates obtained in three independent stopped-flow experiments.
b The errors correspond to the S.D. of results obtained in two independent quench flow experiments.
c Values from Ingaramo and Beckett (8).
d PCC BCCP dissociation rate, in s−1, obtained from the concentration-independent phase.
Results obtained using the quench flow assay mirror those obtained in the stopped flow measurements. Transients are well described by a single exponential model for all BCCP fragments at all concentrations. Moreover, the same linear dependence of the apparent rate on substrate protein concentration that was observed in the stopped flow analysis is also obtained using the quench flow assay (Fig. 3, A and B). Additionally, for each enzyme-substrate pair, the best fit lines obtained from linear regression are nearly superimposable for the two assays. Identical behavior was also observed previously with the human, archaeal, and bacterial ligases (8). The linear dependence and similarity of the quench flow and stopped flow results indicate that collision between HCS and the mitochondrial BCCPs is rate-limiting and that the rate of biotin transfer to these substrates is not affected by the rate of the chemistry of biotin attachment to the acceptor lysine residue. Consistent with the stopped flow results, the 3.5 range in the magnitudes of the rate constants indicates that HCS displays modest selectivity for the three BCCP domains. Additionally, the linear dependences of the rates of FL- and 58-HCS-catalyzed reactions for any single BCCP substrate were similar.
Distinct Kinetic Behaviors of ACC1-His6 and ACC2-His6 in Biotin Transfer
The kinetic behavior of the two ACC BCCP fragments in HCS-catalyzed biotin transfer is distinct from that observed for the mitochondrial substrates. For simplicity, the results obtained with the ACC2 fragment are first presented, followed by those obtained for the ACC1 fragment. Like the PC and MCC fragments, stopped flow transients obtained upon mixing of the enzyme-intermediate complex with ACC2-His6 BCCPs were well described by a single exponential model. However, at any single substrate concentration, the measured rate was significantly slower than the rates obtained for the mitochondrial BCCP fragments. For example, the apparent rate obtained at a final concentration of 80 μm ACC2-His6 is ∼40-fold slower than that obtained at the same PC BCCP concentration, the slowest of the mitochondrial substrates. Additionally, in contrast to the linear behavior exhibited by the mitochondrial BCCPs, ACC2-His6 displays a hyperbolic dependence of the apparent biotinylation rate on BCCP concentration (Fig. 4, A and B). Nonlinear least squares analysis of the data using the Michaelis-Menten formalism yielded a Km of ∼65 μm and a kcat of 0.04 s−1 (Table 3). The saturable behavior indicates that, in contrast to the three BCCP fragments discussed above, the rate of the second half-reaction for the ACC2 substrate is limited by the chemistry of biotin attachment. In turn, bio-5′-AMP synthesis, which is associated with a rate of 0.1 s−1, is not the rate-limiting step in the overall two-step biotinylation reaction for this substrate.
FIGURE 4.

biotin transfer to the BCCP fragments of acetyl-CoA carboxylases. A and B, rate versus concentration profiles for FL-HCS (A) or 58-HCS (B) biotin transfer to His6-ACC2 obtained by stopped flow (●) and quench flow (○). The data points represent the average of the apparent rate measured at each BCCP concentration in three independent experiments in the stopped flow or two independent experiments in the quench flow, with S.D. values shown as error bars. The solid lines represent the best fits of the rate versus concentration profiles to the Michaelis-Menten equation. C and D, apparent rates for biotin transfer to ACC1-His6 obtained by stopped flow (♦) or quench flow (♢) with FL-HCS (C) and 58-HCS (D). The quench flow data points represent the average of the apparent rate measured at each BCCP concentration in two independent experiments, with S.D. values shown as error bars. The stopped flow data points for the three higher ACC1-His6 concentrations are the average of at least 10 traces each, whereas the data points at the lower concentrations represent the average of three independent experiments, with error bars indicating their S.D.
TABLE 3.
FL- and 58-HCS-catalyzed biotin transfer to ACC1-His6 and ACC2- His6 BCCP
| Stopped flow |
[3H] Biotin incorporation assay |
||||
|---|---|---|---|---|---|
| Km | kcat | Km | kcat | ||
| μm | s−1 | μm | s−1 | ||
| ACC2-his6 | FL-HCS | 80 ± 20a | 0.032 ± 0.005a | 60 ± 20b | 0.037 ± 0.004b |
| 58-HCS | 70 ± 30a | 0.038 ± 0.007a | 90 ± 20b | 0.058 ± 0.006b | |
| ACC1-his6 | FL-HCS | 190 ± 90c | 0.12 ± 0.04c | 70 ± 30b | 0.06 ± 0.02b |
| 58-HCS | 200 ± 90c | 0.15 ± 0.05c | 80 ± 30b | 0.12 ± 0.03b | |
a The errors represent the S.D. of the rates obtained in three independent stopped-flow experiments or the propagated 68% confidence interval obtained from the individual fits, whichever was larger.
b The errors correspond to the S.D. of results obtained in two independent experiments or the propagated 68% confidence interval obtained from the individual fits, whichever was larger.
c The errors represent the propagated 68% confidence limits obtained from globally fitting the data, which comprised three independent data sets for the three lower concentrations and at least 10 traces for the three largest concentrations.
Measurements of product accumulation using the quench flow assay with ACC2-His6 BCCP yielded results similar to those obtained in the stopped flow measurements (Fig. 4, A and B, Table 3). The slow reaction rates observed for this substrate obviated use of the quench flow, and manual mixing and quenching of the reactions was used to construct the transients, which are all well described by a single exponential model. The rates obtained from the analysis are, like those obtained using the stopped flow assay, slow. One potential source of concern associated with the slow measured rates of biotin transfer to the ACC2-His6 is the possible influence of the tag on the reaction rate. Although the untagged version of the fragment could not be obtained in sufficient quantities to determine full rate versus concentration profiles, enough material was available to compare its kinetic behavior with that of the tagged protein. Comparison of the transients obtained at a final concentration of 20 μm ACC2 BCCP with the corresponding transients for 20 μm ACC2-His6 reveals that FL- and 58-HCS catalyze biotin transfer to the two constructs with rates that are, within error, identical (data not shown). Furthermore, the results show that both tagged and untagged ACC2 BCCPs yield similarly slow rates. Plots of the measured rates versus substrate concentration displayed a hyperbolic dependence on ACC2-His6 concentration, and non-linear least squares analysis of the data to the Michaelis-Menten model yielded parameter values that agree with those obtained in the stopped flow measurements (Table 3).
HCS-catalyzed biotin transfer to ACC1-His6 is similar to transfer to ACC2-His6. Stopped flow traces display apparent rates that are very slow compared with those measured for the mitochondrial carboxylases (Fig. 4, C and D). In addition, as observed for ACC2-His6, the apparent rates exhibit a hyperbolic dependence on ACC1-His6 concentration. Non-linear least squares regression of the apparent rate dependence on BCCP fragment concentration to the Michaelis-Menten model provided kcat and Km values for the reaction (Table 3). The large errors associated with the Km values are due the limited concentration range over which the measurements could be performed because of the fragment's low solubility. Compared with ACC2-His6, the 3H incorporation experiments with the ACC1-His6 fragment yielded similar Km values (Table 3) and kcat values that are ∼2-fold larger. Moreover, the kcat values are similar in magnitude to that obtained for bio-5′-AMP synthesis (9).
Difference in Biotin Transfer Rates to Mitochondrial Versus Cytosolic BCCP Fragments Is Evident in Steady State Kinetic Measurements
Comparison of the results of single turnover analysis of the first and second half reaction indicates that the rate-limiting step in HCS-catalyzed biotin transfer to mitochondrial substrates is bio-5′-AMP synthesis, whereas the second half-reaction is slower and rate-limiting in overall biotin transfer to ACC1- and ACC2-derived BCCPs. Consequently, kcat measurements under steady state conditions are predicted to reflect these slower rates for the second half-reaction, particularly for biotin transfer to the ACC2 BCCP fragment. Indeed, the steady state kcat values for biotin transfer to the PC, PCC, and MCC fragments are all similar and equal to that measured for bio-5′-AMP synthesis (9), whereas the kcat for transfer to ACC2 BCCP fragment is 10-fold slower (Fig. 5 and Table 4). Biotin transfer to ACC1 is apparently partially limited by both bio-5′-AMP synthesis and biotin transfer because the rate of the latter step obtained in single turnover measurements is similar to that of the former step. Furthermore, the observed steady state kcat value is slower than either individual reaction rate but still faster than transfer to the ACC2 BCCP fragment.
FIGURE 5.

Steady state kinetics of the overall biotin transfer reaction to PCC BCCP fragment catalyzed by FL-HCS (A) or 58-HCS (B). The reactions contained 200 nm HCS, 10 μm biotin, 60 nm [3H]biotin, 1 mm ATP in 10 mm Tris-HCl pH 7.5 at 20 °C, 200 mm KCl, 2.5 mm MgCl2. Each point represents the average of the initial rate obtained from two independent experiments, and the error bars represent their S.D.
TABLE 4.
Steady state kinetic parameters for FL- and 58-HCS-catalyzed overall biotin transfer reaction
| HCS variant | BCCP fragment | Kma | kcata |
|---|---|---|---|
| μm | s−1 | ||
| FL-HCS | PCC | 15 ± 4 | 0.191 ± 0.009 |
| MCC | 30 ± 20 | 0.17 ± 0.02 | |
| PC | 29 ± 9 | 0.17 ± 0.01 | |
| ACC1-His6 | 100 ± 60 | 0.05 ± 0.02 | |
| ACC2- His6 | 80 ± 10 | 0.018 ± 0.002 | |
| 58-HCS | PCC | 15 ± 5 | 0.170 ± 0.008 |
| MCC | 40 ± 10 | 0.18 ± 0.02 | |
| PC | 30 ± 10 | 0.15 ± 0.03 | |
| ACC1- His6 | 70 ± 20 | 0.04 ± 0.01 | |
| ACC2- His6 | 90 ± 20 | 0.017 ± 0.002 |
a The errors correspond to the S.D. of results obtained in two independent experiments or the propagated 68% confidence interval obtained from the individual fits, whichever was larger.
DISCUSSION
Holocarboxylase synthetase has kinetic preference for its cognate human biotin acceptor (BCCP) domain over those of other species in biotin transfer (8). However, prior to these studies, it was not known if the enzyme shows any selectivity in biotin addition to the five endogenous human carboxylases. It was also not known if the HCS N terminus affects the interaction with these substrates. In this work, application of two single turnover assays allowed measurements of kinetic selectivity in HCS-catalyzed biotin transfer to the five endogenous human acceptor substrates (8–10) that reveals a kinetic preference for mitochondrial over cytosolic substrates.
The BCCP fragments of the mitochondrial carboxylases, PC, PCC, and MCC, display similar kinetic behaviors in biotin transfer. Each exhibits a linear dependence of apparent transfer rate on BCCP concentration as monitored by either stopped flow or quench flow. This behavior indicates that transfer to these substrates is limited by the rate of collision of the enzyme-intermediate with BCCP and provides a measure of the bimolecular association rate constant formation of the ternary complex. The slowest rate constant, 10,000 m−1 s−1, was measured for the PC substrate, and the fastest, 33,000 m−1 s−1, for the PCC fragment. This 3-fold difference in rate indicates that HCS shows modest discrimination in biotin transfer to the three mitochondrial carboxylases. However, for all substrates, the full-length and the N-terminal truncated enzymes showed identical rates of transfer.
The properties of ACC1 and ACC2 BCCP fragments in HCS-catalyzed biotin transfer are both qualitatively and quantitatively distinct from those of the three mitochondrial substrates. Although, like the mitochondrial substrates, transients for the cytosolic substrates are well described by a single exponential model, the apparent rates at comparable acceptor protein concentrations are significantly slower (∼100-fold). The identical rates measured for the untagged and tagged versions of the ACC2 substrate indicate that the slow rates cannot be attributed to the presence of the His6 tag. Furthermore, in contrast to the linear dependence observed for the mitochondrial substrates, the apparent rates of transfer to the ACC substrates displayed hyperbolic dependences on BCCP concentration. The saturable behavior and slow transfer rates, as well as the decreased magnitude of kcat for the overall biotin transfer reaction for these two substrates, indicate that the rate-limiting step in the second step of biotin transfer to the ACC substrates differs from that for the PCC, PC, and MCC substrates. Presumably, it corresponds to the chemistry of biotin attachment and/or the dissociation rate. Additionally, the slow rates measured for HCS-catalyzed biotin addition to the ACC substrates indicates that, in contrast to the mitochondrial substrates for which bio-5′-AMP synthesis is rate-limiting, it is the second step of biotin transfer from the adenylate to the acceptor protein that is rate-limiting in the overall two-step biotinylation reaction. The kcat value in the second step of the transfer reaction for the ACC2 BCCP fragment is ∼0.04 s−1, and that for ACC1 is twice as large. Comparison of these rates with the bio-5′-AMP synthesis rate of 0.1 s−1 indicates that for the ACC substrates, the overall reaction rate for the two-step biotin transfer reaction is influenced by the second step of biotin transfer from the adenylate to the lysine residue on BCCP (9).
The 2-fold larger kcat value observed for 58- versus FL-HCS catalyzed biotinylation of the BCCP fragment of ACC2 is the largest difference observed for the two enzyme isoforms. This suggests that the N terminus of HCS affects biotin acceptor substrate recognition mainly for ACC2 and perhaps for ACC1 and is consistent with results of NMR measurements performed on the ACC2-His6 construct. Lee et al. monitored the chemical shift perturbations that occur in ACC2-His6 spectra upon the addition of FL-HCS and the initial 160 amino acids of HCS (160-HCS) (17). Signals for several ACC2-His6 side chains were shown to undergo chemical shift perturbations upon the addition of either HCS partner, which led to the proposal that the N terminus might be involved in recruitment of the BCCP substrate. In addition, chemical shift perturbations on the N-terminal HCS fragment indicated that this domain undergoes conformational rearrangements upon binding ACC2-His6. Although these NMR studies provided valuable structural information, only the ACC2-His6 BCCP has been subjected to them.
The magnitudes of the rates of BCCP biotinylation correlate with the cellular localization of the carboxylases. Biotinylation of the BCCP fragments of PC, PCC, and MCC displayed faster apparent rates than those of ACC1 and ACC2. Whereas the latter two are present in the cytoplasm, the first three carboxylases are transported into the mitochondria matrix. It is tempting to speculate that HCS biotinylates PC, PCC, and MCC enzymes faster because mitochondrial enzymes are only transiently present in the cytoplasm and must be biotinylated prior to mitochondrial import. Conversely, HCS has continuous access to ACC1 and ACC2, so there is no biological pressure to increase the rate of biotinylation of these substrates.
Previous studies provide some support for a model that rationalizes faster biotinylation rates of substrates destined for the mitochondria based on lack of access once transported. First, although ACC2 is associated with the mitochondria, it localizes to the cytosolic side of the mitochondrial membrane (7). Thus, HCS has continuous access to ACC2 as well as ACC1, and a fast biotinylation rate would not need to evolve. Second, carboxylases are imported into mitochondria regardless of biotinylation state (21). If indeed there is no mechanism to prevent unbiotinylated carboxylase transport into the mitochondria, then it is even more pressing that biotinylation of mitochondrial carboxylases display a fast rate.
The above model assumes that HCS localizes to the cytoplasm, with no HCS found in the mitochondria. Subcellular localization of HCS has been a matter of debate. Its presence in the cytoplasm is well established through fluorescence microscopy localization studies and Western blots of fractionated cells (22). Although no mitochondrial localization of HCS was evidenced in microscopy studies of intact cells in which the N- and C-terminally GFP-tagged enzyme were expressed, Western blots of mitochondrial fractions obtained from human placenta were inconclusive and showed a 60 kDa band that is inconsistent with the isoform sizes expected for HCS splice variants (2). The identity of this band remains to be confirmed, but it suggests the presence of a processed form of HCS in the mitochondria. In addition, an independent study involving pulse-chase 35S labeling of PC provided evidence supporting the presence of biotinylating activity in the mitochondria (21). The possibility of HCS mitochondrial localization poses a problem for our explanation for HCS faster biotin transfer rates to mitochondrial carboxylases. However, confirming the presence of biotinylating activity in the mitochondria and the identity of the 60-kDa species would reveal new mechanistic possibilities and would not negate the fact that HCS displays specificity among its natural biotinylation targets.
The observed HCS selectivity suggests a mechanism for biotin distribution among carboxylases that is kinetically controlled at two levels. First, HCS displays a marked distinction between cytosolic and mitochondrial substrates, favoring biotin transfer to those carboxylases to which it has only transient access. Second, HCS displays selectivity among the mitochondrial carboxylases. The intracellular biotin supply is low, and, accordingly, the HCS·adenylate complex is limiting. Kinetically, the carboxylase that associates most rapidly with this complex will be favored in biotinylation. However, the significance of the relative intrinsic rates of biotinylation can be overridden by altering relative carboxylase concentrations. Carboxylases will compete for the biotin, and those that have the fastest kinetics of association, which is dependent on substrate concentration and inherent association rate, will be preferentially modified. Accordingly, the cell can establish a hierarchy among the carboxylases that determines metabolic use of biotin based on the rates of bimolecular association and carboxylase abundance.
This work was supported, in whole or in part, by National Institutes of Health Grants R01GM46511 and S10RR15899 (to D. B.).
- HCS
- human holocarboxylase synthetase
- BCCP
- biotin carboxyl carrier protein
- ACC1 and -2
- acetyl-CoA carboxylase 1 and 2, respectively
- PCC
- propionyl-CoA carboxylase
- PC
- pyruvate carboxylase
- MCC
- methylcrotonoyl-CoA carboxylase
- SUMO
- small ubiquitin-like modifier.
REFERENCES
- 1. Lane M. D., Rominger K. L., Young D. L., Lynen F. (1964) The enzymatic synthesis of holotranscarboxylase from apotranscarboxylase and (+)-biotin. II. Investigation of the reaction mechanism. J. Biol. Chem. 239, 2865–2871 [PubMed] [Google Scholar]
- 2. Hiratsuka M., Sakamoto O., Li X., Suzuki Y., Aoki Y., Narisawa K. (1998) Identification of holocarboxylase synthetase (HCS) proteins in human placenta. Biochim. Biophys. Acta 1385, 165–171 [DOI] [PubMed] [Google Scholar]
- 3. León-Del-Rio A., Leclerc D., Akerman B., Wakamatsu N., Gravel R. A. (1995) Isolation of a cDNA encoding human holocarboxylase synthetase by functional complementation of a biotin auxotroph of Escherichia coli. Proc. Natl. Acad. Sci. U.S.A. 92, 4626–4630 [DOI] [PMC free article] [PubMed] [Google Scholar]
- 4. Suzuki Y., Aoki Y., Ishida Y., Chiba Y., Iwamatsu A., Kishino T., Niikawa N., Matsubara Y., Narisawa K. (1994) Isolation and characterization of mutations in the human holocarboxylase synthetase cDNA. Nat. Genet. 8, 122–128 [DOI] [PubMed] [Google Scholar]
- 5. Jitrapakdee S., Wallace J. C. (2003) The biotin enzyme family. Conserved structural motifs and domain rearrangements. Curr. Protein Pept. Sci. 4, 217–229 [DOI] [PubMed] [Google Scholar]
- 6. Brownsey R. W., Boone A. N., Elliott J. E., Kulpa J. E., Lee W. M. (2006) Regulation of acetyl-CoA carboxylase. Biochem. Soc. Trans. 34, 223–227 [DOI] [PubMed] [Google Scholar]
- 7. Abu-Elheiga L., Brinkley W. R., Zhong L., Chirala S. S., Woldegiorgis G., Wakil S. J. (2000) The subcellular localization of acetyl-CoA carboxylase 2. Proc. Natl. Acad. Sci. 97, 1444–1449 [DOI] [PMC free article] [PubMed] [Google Scholar]
- 8. Ingaramo M., Beckett D. (2011) Biotinylation, a post-translational modification controlled by the rate of protein-protein association. J. Biol. Chem. 286, 13071–13078 [DOI] [PMC free article] [PubMed] [Google Scholar]
- 9. Ingaramo M., Beckett D. (2009) Distinct amino termini of two human HCS isoforms influence biotin acceptor substrate recognition. J. Biol. Chem. 284, 30862–30870 [DOI] [PMC free article] [PubMed] [Google Scholar]
- 10. Nenortas E., Beckett D. (1996) Purification and characterization of intact and truncated forms of the Escherichia coli biotin carboxyl carrier subunit of acetyl-CoA carboxylase. J. Biol. Chem. 271, 7559–7567 [DOI] [PubMed] [Google Scholar]
- 11. Gill S. C., von Hippel P. H. (1989) Calculation of protein extinction coefficients from amino acid sequence data. Anal. Biochem. 182, 319–326 [DOI] [PubMed] [Google Scholar]
- 12. Healy S., Heightman T. D., Hohmann L., Schriemer D., Gravel R. A. (2009) Nonenzymatic biotinylation of histone H2A. Protein Sci. 18, 314–328 [DOI] [PMC free article] [PubMed] [Google Scholar]
- 13. Healy S., McDonald M. K., Wu X., Yue W. W., Kochan G., Oppermann U., Gravel R. A. (2010) Structural impact of human and Escherichia coli biotin carboxyl carrier proteins on biotin attachment. Biochemistry 49, 4687–4694 [DOI] [PubMed] [Google Scholar]
- 14. Leon-Del-Rio A., Gravel R. A. (1994) Sequence requirements for the biotinylation of carboxyl-terminal fragments of human propionyl-CoA carboxylase α subunit expressed in Escherichia coli. J. Biol. Chem. 269, 22964–22968 [PubMed] [Google Scholar]
- 15. Chenna R., Sugawara H., Koike T., Lopez R., Gibson T. J., Higgins D. G., Thompson J. D. (2003) Multiple sequence alignment with the Clustal series of programs. Nucleic Acids Res. 31, 3497–3500 [DOI] [PMC free article] [PubMed] [Google Scholar]
- 16. Mossessova E., Lima C. D. (2000) Ulp1-SUMO crystal structure and genetic analysis reveal conserved interactions and a regulatory element essential for cell growth in yeast. Mol. Cell 5, 865–876 [DOI] [PubMed] [Google Scholar]
- 17. Lee C. K., Cheong C., Jeon Y. H. (2010) The N-terminal domain of human holocarboxylase synthetase facilitates biotinylation via direct interaction with the substrate protein. FEBS Lett. 584, 675–680 [DOI] [PubMed] [Google Scholar]
- 18. Schägger H., von Jagow G. (1987) Tricine-sodium dodecyl sulfate-polyacrylamide gel electrophoresis for the separation of proteins in the range from 1 to 100 kDa. Anal. Biochem. 166, 368–379 [DOI] [PubMed] [Google Scholar]
- 19. Johnson M. L., Correia J. J., Yphantis D. A., Halvorson H. R. (1981) Analysis of data from the analytical ultracentrifuge by nonlinear least-squares techniques. Biophys. J. 36, 575–588 [DOI] [PMC free article] [PubMed] [Google Scholar]
- 20. Chapman-Smith A., Morris T. W., Wallace J. C., Cronan J. E. (1999) Molecular recognition in a post-translational modification of exceptional specificity. Mutants of the biotinylated domain of acetyl-CoA carboxylase defective in recognition by biotin protein ligase. J. Biol. Chem. 274, 1449–1457 [DOI] [PubMed] [Google Scholar]
- 21. Taroni F., Rosenberg L. E. (1991) The precursor of the biotin-binding subunit of mammalian propionyl-CoA carboxylase can be translocated into mitochondria as apo- or holoprotein. J. Biol. Chem. 266, 13267–13271 [PubMed] [Google Scholar]
- 22. Bailey L. M., Wallace J. C., Polyak S. W. (2010) Holocarboxylase synthetase. Correlation of protein localisation with biological function. Arch. Biochem. Biophys. 496, 45–52 [DOI] [PubMed] [Google Scholar]
- 23. Koradi R., Billeter M., Wüthrich K. (1996) MOLMOL. A program for display and analysis of macromolecular structures. J. Mol. Graph. 14, 51–55 [DOI] [PubMed] [Google Scholar]
- 24. Xiang S., Tong L. (2008) Crystal structures of human and Staphylococcus aureus pyruvate carboxylase and molecular insights into the carboxyltransfer reaction. Nat. Struct. Mol. Biol. 15, 295–302 [DOI] [PubMed] [Google Scholar]