Background: Proper cell surface localization of RET is crucial for its function, however the molecular mechanisms regulating RET surface expression are still unclear.
Results: Neuronal activity enhances RET surface expression through phosphorylation of its Thr675 residue by PKC.
Conclusion: Neuronal activity and PKC regulate RET surface expression.
Significance: These findings reveal a novel mechanism for the modulation of RET surface expression.
Keywords: Cell Surface Receptor, Protein Chimeras, Protein Kinase C (PKC), Protein Motifs, Protein Phosphorylation, RET, Thr675, TrkB, Depolarization, Surface Expression Level
Abstract
The RET tyrosine kinase receptor plays an important role in the development and maintenance of the nervous system. Although the ligand-induced RET signaling pathway has been well described, little is known about the regulation of RET surface expression, which is integral to the cell ability to control the response to ligand stimuli. We found that in dorsal root ganglion (DRG) neurons, which co-express RET and TrkB, the receptor surface levels of RET are significantly higher than that of TrkB. Using a sequence substitution strategy, we identified a key motif (Box1), which is necessary and sufficient for the differential RET and TrkB surface levels. Furthermore, pharmacological and mutagenesis assays revealed that protein kinase C (PKC) and high K+ depolarization increase RET surface levels through phosphorylation of the Thr675 residue in the Box1 motif. Finally, we found that the phosphorylation status of the Thr675 residue influences RET mediated response to GDNF stimulation. In all, these findings provide a novel mechanism for the modulation of RET surface expression.
Introduction
The RET tyrosine kinase receptor is required for the development of kidneys, testes, and the enteric, and peripheral and central nervous systems (1–3). In the nervous system, RET expression and functions have been well investigated in peripheral and sensory neurons. For instance, RET-positive neurons comprise about half of total adult DRG neurons, which are called non-peptidergic nociceptors. Herein, RET is proposed to be critical for the proper development and maintenance of non-peptidergic nociceptors (4–6). Interestingly, tropomyosin-related kinase B (TrkB)2 is also expressed in adult non-peptidergic DRG neurons and is essential for postnatal survival of non-peptidergic nociceptive neurons (7). The activation of RET is governed by the glial cell line-derived neurotrophic factor (GDNF) family ligands (GFLs). GFLs binds directly to RET co-receptors known as GDNF family receptor α1–4 (GFRα1–4), which then form active receptor complexes with RET (3). GFL-mediated RET activation stimulates multiple intracellular signaling pathways including MAPK and PI3K/Akt that promote cell survival, cell migration, and neurite outgrowth (8, 9).
Proper cell surface localization of the RET receptor is crucial for its normal functioning, however little is known about the regulation of RET surface expression (10). Increasing evidence suggests that complex arrays of short signal and recognition amino acid sequences are responsible for the accurate trafficking of transmembrane receptors into the cell membrane (11–13). Recent reports also suggest that protein kinases are involved in cell surface receptor trafficking (14–16). For example, it has been reported that PKC could facilitate NMDA receptor surface delivery (15). Neuronal activity could also enhance receptor surface insertion through activation of protein kinases (17, 18). In the nervous system, the activity-dependent surface insertion of AMPA receptors is a well-researched model (18). However, it is still unknown whether such mechanisms are involved in the regulation of RET surface expression.
In the present study, we found that RET and TrkB receptors, which are co-expressed in non-peptidergic DRG neurons, displayed differential cell surface levels. We further identified a key motif (Box1) in the juxtamembrane region of RET that was necessary and sufficient to distinguish the different RET and TrkB surface levels. Finally, we showed that PKC and high K+ depolarization could modulate RET cell surface levels through phosphorylation of the Thr675 site in the Box1 motif.
EXPERIMENTAL PROCEDURES
Reagents and Antibodies
Human recombinant NGF, GDNF and BDNF were purchased from PeproTech (Rocky Hill, NJ). Soluble GFRα1 (GFRα1-Fc chimera) was obtained from R&D system (Minneapolis, MN). Chelerythrine (CHE), 12-O-tetradecanoylphorbol-13-acetate (TPA), N-[2-(p-bromocinnamylamino)ethyl]-5-isoquinolinesulfonamide (H89), forskolin, and dynasore were purchased from Sigma-Aldrich. Antibodies were purchased as follows: rabbit anti-TrkB antibody from Millipore (Temecula, CA); mouse anti-Flag (M2) antibody and protein A-Sepharose from Sigma-Aldrich; goat anti-RET, rabbit anti-RET, mouse anti-p-Tyr (pY99) and mouse anti-Akt antibodies from Santa Cruz Biotechnology (Santa Cruz, CA); rabbit anti-phospho-Akt (Ser473), rabbit anti-p44/42 MAPK (Erk1/2), mouse anti-phospho-p44/42 MAPK (pErk1/2) (Thr202/Tyr204) antibodies from Cell Signaling Technology (Beverly, MA); Alexa Fluor 488- or 594-conjugated donkey anti-mouse, rabbit and goat IgG from Invitrogen (Carlsbad, CA); horseradish peroxidase (HRP)-conjugated goat anti-mouse or rabbit IgG, horseradish peroxidase (HRP)-conjugated rabbit anti-goat IgG antibodies from Calbiochem (La Jolla, CA). The restriction enzymes were purchased from Fermentas (Hanover, MD). Trypsin and collagenase were purchased from Invitrogen. The other reagents were from Sigma-Aldrich except when specifically indicated.
Plasmid Construction
The coding region of human RET and TrkB were subcloned into pcDNA3.1 (Invitrogen) expression vector. Flag-tagged TrkB-GFP and RET-GFP constructs were prepared on pEGFP-N1 backbone as previously described (19). RET and TrkB chimeras with swapped domains were generated by means of two-step PCR. RET mutants at Thr675 site were made by site-directed mutagenesis. All the constructs were confirmed by DNA sequencing to exclude potential PCR introduced mutations.
PC12 Cell Culture and Transfection
PC12 cells were grown in Dulbecco's Modified Eagle's Medium (DMEM, Invitrogen) containing 10% house serum (Invitrogen), 5% fetal bovine serum (Invitrogen), supplemented with 100 units/ml penicillin-streptomycin (Invitrogen) and 2 mm l-glutamine (Invitrogen). For immunostaining, PC12 cells were planted to a 6-well dish at a density of 3 × 10⁵ cells per well and transfected with indicated plasmids using Lipofectamine 2000 (Invitrogen) on the next day. For surface biotinylation, Western blot and cell differentiation experiments, PC12 cells were electroporated using NucleofectorTM-II (Amaxa Biosystems, Köln, Germany) according to the manufacturer's instruction.
DRG Neuron Culture
Newborn Sprague-Dawley rats (postnatal day 7, P7) were killed via heart bleeding under ethyl ether anesthesia. The spinal columns were removed aseptically, and DRGs from all levels were dissected out and collected in ice-cold Hank's Buffered Salt Solution (HBSS). Nerve fibers were cleared and ganglions were digested with 0.1% collagenase I twice, followed by 0.25% trypsin-EDTA for 15∼30 min at 37 °C. DMEM/F12 medium (plus 10% fetal bovine serum) was added to terminate the digestion. The ganglions were triturated through a flame-polished pasteur pipette to form a single cell suspension. Cells were then collected by centrifugation at 30 × g for 10 min and cultured with DMEM/F12 medium supplemented with 10% fetal bovine serum, 100 units/ml penicillin-streptomycin, 0.5 mm l-glutamine, and 50 ng/ml NGF. For endogenous receptor surface levels quantification, DRG neurons were seeded into PDL-coated 6-cm dishes at a density of 1 × 10⁶ cells per dish, and surface biotinylation experiment was carried out at the culture day 5. For immunofluorescence assay, DRG neurons were electroporated using NucleofectorTM-II and the immunocytochemistry staining experiment was carried out 48 h later.
Surface Biotinylation, Immunoprecipitation, and Western Blot
For collection of cell surface proteins, cells were washed twice with ice-cold phosphate-buffered saline (PBS) buffer (pH 7.4, with 0.1 mm Ca2+ and 1 mm Mg2+) and then incubated with Sulfo-NHS-biotin (0.3 mg/ml in cold PBS) for 45 min at 4 °C to biotinylate surface proteins. Unreacted biotin was quenched twice with ice-cold Tris-buffered saline (TBS) containing 0.1 mm Ca2+. Cells were lysed in TNE lysis buffer, which contains 150 mm NaCl, 10 mm Tris, 1 mm EDTA, and 1% Nonidet P-40 with protease and phosphatase inhibitors. Cell lysates were rotated for 45 min at 4 °C, and the cell extracts were clarified by centrifugation (12,000 × g, 15 min). Biotinylated surface proteins were then pulled down by avidin-agarose, and the remaining supernatant was collected as cytoplasmic protein samples.
For quantifying endogenous RET and TrkB surface levels in DRG neurons, surface biotinylation was performed first, and then one-half of the clarified lysates were immunoprecipitated with avidin beads to capture cell surface receptors. The other half of the lysates were immunoprecipitated with rabbit anti-RET (Santa Cruz Biotechnology) or rabbit anti-TrkB (Upstate) antibodies (total RET or TrkB groups) overnight at 4 °C followed by incubation with protein A-Sepharose beads to capture total RET or TrkB. The beads were washed three times with TNE lysis buffer; the precipitated proteins were eluted in SDS sample buffer (Invitrogen) and analyzed by Western blot. RET or TrkB proteins were detected by goat anti-RET (1:1000, Santa Cruz Biotechnology) or mouse anti-TrkB (1:1000; BD) antibody. Immunoreactive bands were visualized by enhanced chemiluminescence (ECL; Pierce) and quantified by NIH Image J software (NIH Image, Bethesda, MD).
Immunohistochemistry, Immunofluorescence Staining, and Microscopic Quantitative Analysis
Endogenous RET and TrkB expression were detected by immunohistochemistry staining. P7 newborn rat DRGs were fixed with 4% paraformaldehyde (PFA) followed by equilibration in 30% sucrose/PBS overnight. Ganglions were sectioned at 40 μm thickness by a freezing microtome (Microm HM550, Thermo) at −20 °C onto gelatin-coated slides. These sections were then stained with goat anti-RET (1:100, Santa Cruz Biotechnology) and rabbit anti-TrkB (1:100, Upstate) antibodies followed by Alexa Fluor 594-conjugated donkey anti-goat IgG and Alexa Fluor 488-conjugated donkey anti-rabbit IgG. Fluorescence images were acquired by a HQ2 cool CCD camera mounted on a Nikon Eclipse TE 2000-U microscope, and assigned to a pseudo color (red, green). All of the images were collected using a 10× objective lens and processed by MetaMorph software (Universal Imaging Corporation, West Chester, PA).
To visualize cell surface levels of GFP-fused receptors in transfected PC12 cells and DRG neurons, immunofluorescence staining methods were used from our previous study (19). Briefly, fixed cells were stained with anti-Flag M2 antibody (1:1000, Sigma) under non-permeabilized conditions followed by Alexa Fluor 594-conjugated goat anti-mouse secondary antibody (1:1000; Invitrogen). All of the images were acquired using a 60× objective lens by a HQ2 cool CCD camera mounted on a Nikon Eclipse TE 2000-U microscope. In each experiment, a consistent set of acquisition parameters was used for each set of images, which were processed by MetaMorph software and assigned to a pseudo color (red, green). The intensity of anti-FLAG staining (red) or GFP (green) for each of selected cells was measured by MetaMorph software.
Generation of Antibody against Phosphorylated RET at Thr675 Residue
A peptide containing the predicted PKC phosphorylation site at Thr675 of human RET (SAEMpTFRRP-C) was used to immunize rabbits. Crude serum was first passed through an affinity column made by coupling the non-phosphorylated version of the peptide. Flow-through from this column was then passed through a column made by coupling the phosphopeptide. Specificity of collected antibody (rabbit anti-pT675-RET) was tested by a peptide competition assay in which a more than 5-fold weight excess of either phosphorylated or non-phosphorylated RET peptide was pre-incubated with antibody for 2 h at 4 °C and then used for immunoblotting with TPA-treated PC12 cells lysates transfected with RET-GFP.
Receptor Stimulation and Downstream Signaling Activation Assay
PC12 cells electroporated with low amounts of indicated constructs (0.5 μg) were cultured at a density of 2.0 × 10⁶ cells/ml onto 6-cm dishes coated with poly-d-lysine. 24 h later, cells were serum starved for 12 h and then treated with 50 ng/ml GDNF (PeproTech) plus 300 ng/ml soluble GFRα1 (R&D System) for 5, 10, and 60 min. Total cell lysates were obtained as described previously. To detect receptor tyrosine autophosphorylation levels, cell lysates were immunoprecipitated with rabbit anti-RET antibody, followed by immunoblotting with mouse anti-pTyr (pY99, Santa Cruz Biotechnology) and goat anti-RET antibodies respectively. For Erk and Akt activation, anti-pErk1/2, anti-Erk1/2, anti-pAkt, and anti-Akt Western blots were performed, respectively, as previously described. Immunoreactive bands were scanned and quantitated using NIH Image J software. Ratios of phosphoprotein over total protein were defined to present protein activation levels.
PC12 Cell Neurite Outgrowth
12 h after transfection with a low amount of the indicated constructs (0.5 μg), PC12 cells were switched to differentiation medium (DMEM, 0.5% horse serum, 0.25% FBS, 100 units/ml penicillin-streptomycin and 2 mm glutamine) in the presence or absence of 50 ng/ml GDNF plus 300 ng/ml soluble GFRα1. Cells were left to differentiate for 3 days, and subsequent images were collected using a ×10 objective lens with a Nikon Eclipse TE 2000-U microscope. GFP-expressing cells, carrying neurites at least twice the diameter of the cell soma, were defined as differentiated cells. Differentiation percentage was calculated as the number of differentiated cells divided by the total number of transfected cells, which had GFP-fluorescence. At least 300 cells from ten different fields were counted for each construct.
Statistical Analysis
Statistical significance was assessed using Student's t test or analysis of variance (ANOVA) followed by post hoc tests. Data were presented as mean ± S.E., and differences were considered significant at p < 0.05.
RESULTS
RET and TrkB Receptors Exhibit Differential Cell Surface Levels in DRG Neurons
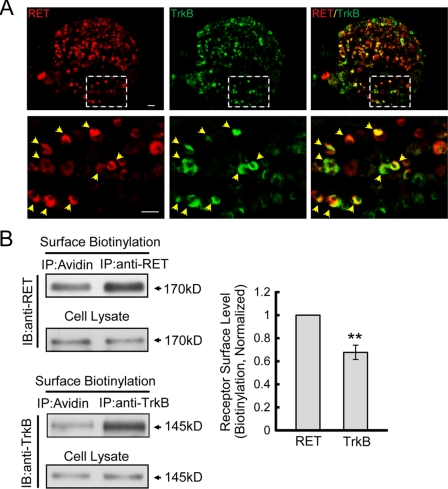
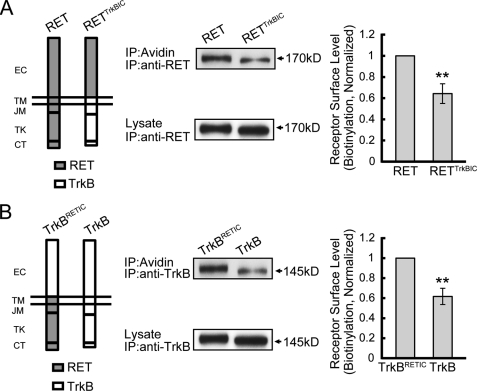
Although RET and TrkB receptors are both expressed in non-peptidergic DRG neurons, direct investigations of their co-expression are rarely reported (20, 21). We confirmed the co-expression of RET and TrkB in a subset of P7 rat DRG neurons by immunohistochemical staining (Fig. 1A). As the receptor surface levels may play a critical role in cell responsiveness to particular stimuli, we compared the endogenous RET and TrkB surface levels in DRG neurons by surface biotinylation assay and calculated the ratios of surface RET and TrkB compared with their respective total amounts. Quantitative analyses of immunoblotting revealed that RET exhibits significantly higher cell surface expression than TrkB (Fig. 1B). We then sought to determine the structural basis for the differential RET and TrkB cell surface levels. Chimeric receptors with switched intracellular domains for RET and TrkB were constructed (RETTrkBIC and TrkBRETIC) and transfected into PC12 cells, a well-established neuronal cell line with little endogenous RET and TrkB expression and as such a model system to express various RET and TrkB mutants (supplemental Fig. S1) (22–25). Using a surface biotinylation assay, we found that though their extracellular domains were replaced, RET and TrkB chimeras containing their respective cytoplasmic domains still exhibited differential cell surface levels (Fig. 2, A and B), which suggested that the intracellular domains of RET and TrkB were responsible for their differential surface expression.
FIGURE 1.
RET and TrkB receptors show differential cell surface levels in DRG neurons. A, immunohistochemical analysis of RET and TrkB expressions in P7 rat DRG. Lower panels show images of the dotted box at higher magnification. Co-expression is shown as red and green overlap (yellow) and indicated by yellow arrowhead. Scale bar: 10 μm. B, surface levels of RET and TrkB receptors were quantified by surface biotinylation method in cultured DRG neurons. Total RET or TrkB and their respective surface immunoprecipitates were run side by side in SDS-PAGE. Immunoreactive bands were quantified by Image J software and surface fractions are represented as surface/total ratios. Cell lysates were added as protein controls. The value of RET surface levels were arbitrarily set to 1. The results are represented as mean ± S.E. from three independent experiments (**, p < 0.01 versus RET surface levels; Student's t test).
FIGURE 2.
The differential RET and TrkB surface levels depends on their intracellular portion. A, cell surface levels of RET and RETTrkBIC receptors were compared. RET and RETTrkBIC chimeric receptors were constructed on the pcDNA3.1 backbone and electroporated into PC12 cells. Surface proteins were collected by biotinylation methods and run on an SDS-PAGE gel. Cell lysates were added as protein level control. Immunoreactive bands were quantified by Image J software, and surface levels were represented as surface/lysate ratios. Relative receptor surface levels were normalized to that of RET. The results are represented as mean ± S.E. from three independent experiments (**, p < 0.01 versus RET surface levels; Student's t test). B, cell surface levels of TrkBRETIC and TrkB receptors were compared. TrkB and TrkBRETIC chimeric receptors were constructed on the pcDNA3.1 backbone and electroporated into PC12 cells. The same experiment process was carried out as in A. Relative receptor surface levels were normalized to that of TrkBRETIC. The results are represented as mean ± S.E. from three independent experiments (**, p < 0.01 versus TrkBRETIC surface levels; Student's t test).
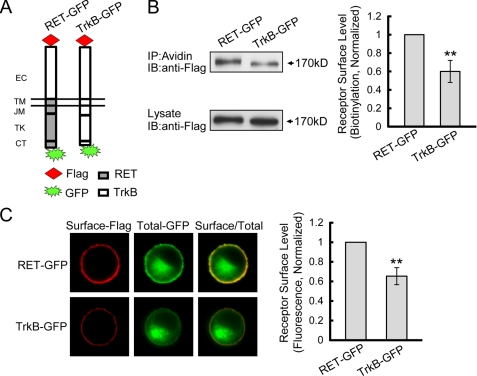
To provide a convenient and visible method for comparing relative receptor cell surface levels, we adopted a ratiometric fluorescence assay described in a previous study of TrkB surface insertion (19). In this assay, receptors were Flag-tagged at the N-terminal of the extracellular domain and fused with green fluorescence protein (GFP) in the cytoplasmic C-terminal. Thus, cell-surface receptor levels were quantified by fluorescence intensity of Flag staining normalized to GFP intensity per cell under non-permeabilized conditions, which served to control for variable receptor expression levels in each cell due to transient transfection. Having shown that the extracellular domain was not responsible for the differential surface levels of RET and TrkB (Fig. 2), we then generated the chimeric RET-GFP receptor, which expressed the Flag-tagged TrkB extracellular domain to eliminate the potential detection bias due to accessibility differences of the Flag epitope between the receptors (Fig. 3A). After transfection into PC12 cells, surface biotinylation experiments showed that the cell surface levels of Flag-tagged TrkB-GFP was ∼0.61-fold compared with that of RET-GFP (Fig. 3B), which was consistent with the surface levels differences between RET and TrkB under endogenous conditions in DRG neurons and suggested that the Flag and GFP tag did not affect the surface distribution of the receptors. Next we performed the ratiometric fluorescence assay. Quantitative fluorescence analysis revealed that the surface receptor levels of TrkB-GFP was ∼0.65-fold compared with that of RET-GFP (Fig. 3C), which further confirmed our surface biotinylation results. Taken together, these data suggest that cell surface levels of RET and TrkB are differentially expressed and that this differential expression is mediated by the residues within the intracellular domain.
FIGURE 3.
Ratiometric fluorescence assay to measure RET and TrkB receptor surface levels. A, expression plasmids of RET and TrkB chimeras tagged with Flag epitope were constructed on the pEGFP-N1 backbone as shown. B, receptor cell surface levels were quantified by biotinylation methods in transfected PC12 cells. Immunoreactive bands were quantified by Image J software and cell surface receptor levels were represented as surface/lysate ratios. Relative receptor surface levels were normalized to that of RET-GFP. The results are represented as mean ± S.E. from three independent experiments (**, p < 0.01 versus RET surface levels; Student's t test). C, ratiometric fluorescence assay to quantify RET and TrkB receptor surface levels. PC12 cells expressing indicated receptors were stained with anti-Flag M2 antibody under unpermeabilization condition followed with Alexa Fluor 594-conjugated donkey anti-mouse IgG (red). The Alexa Fluor 594 fluorescence represented surface receptor levels, and the GFP fluorescence represented total receptor levels. Surface receptor levels were represented as the ratios of surface-Alexa Fluor 594/total-GFP fluorescence. Relative receptor surface levels were normalized to that of RET-GFP. The results are represented as mean ± S.E. from three independent experiments (**, p < 0.01 versus RET surface levels; one-way ANOVA).
Identification of the Key Motif Responsible for the Differential RET and TrkB Surface Levels
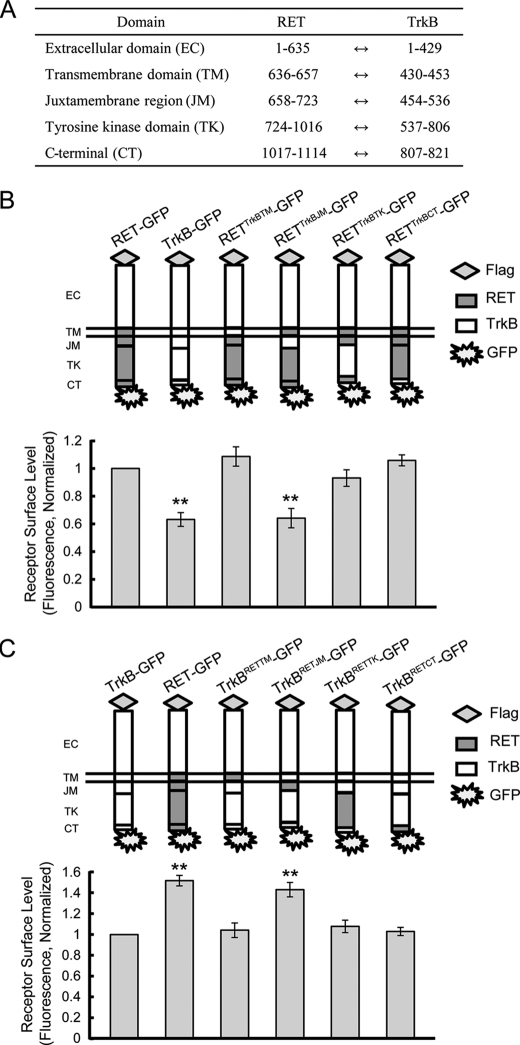
Having determined that the differential surface levels of RET and TrkB might be due to the intracellular domain, we then sought to determine whether there was a key motif responsible for this difference. The ratiometric fluorescence assay was used to define the potential regions in the RET receptor required for higher surface expression levels compared with TrkB. We generated chimeras in which different RET domains (transmembrane, juxtamembrane, kinase, and C-terminal) were substituted with the corresponding TrkB domains (Fig. 4, A and B). We hypothesized that monitoring for a decrease in the cell surface expression levels from these chimeras would allow us to identify the motif necessary for the higher RET surface levels compared with TrkB. In PC12 cells, we observed that substitution of only the TrkB juxtamembrane region into RET (RETTrkBJM-GFP) led to a significant decrease in RET surface levels comparable to that of wild-type TrkB (Fig. 4B). Swapping in other TrkB domains had no effect on surface expression of RET chimeras. These observations indicated that the RET juxtamembrane region contains structural elements that are necessary for the differential RET and TrkB surface expression. We next sought to determine whether the RET juxtamembrane region was sufficient for the higher RET surface levels compared with TrkB. Various domains including the juxtamembrane region were transplanted from RET into TrkB, and their surface expression levels were assessed (Fig. 4C). Only the TrkB chimera swapped with the RET juxtamembrane region (TrkBRETJM-GFP) showed a significant increase in surface expression comparable with wild-type RET (Fig. 4C), which suggested that the RET juxtamembrane region was not only necessary but also sufficient for the differential RET and TrkB cell surface levels.
FIGURE 4.
RET juxtamembrane domain is responsible for the differential RET and TrkB surface levels. A, amino acid position of each domain based on published sequences is shown. B, surface levels of chimeric RET-GFP receptors with domain substitutions of TrkB were measured using a ratiometric fluorescence assay in transfected PC12 cells. Schematic diagrams show the structures of RET (gray) and TrkB (white) subdomains. Relative surface expression levels of each chimera were normalized to that of RET-GFP. The results are represented as mean ± S.E. from three independent experiments (**, p < 0.01 versus RET surface levels; one-way ANOVA). C, surface levels of chimeric TrkB receptors with domain substitution of RET were determined as in B. Schematic diagrams show the structures of TrkB (white) and RET (gray) subdomains. Relative surface expression levels of each chimera were normalized to that of TrkB-GFP. The results are represented as mean ± S.E. from three independent experiments (**, p < 0.01 versus TrkB surface levels; one-way ANOVA).
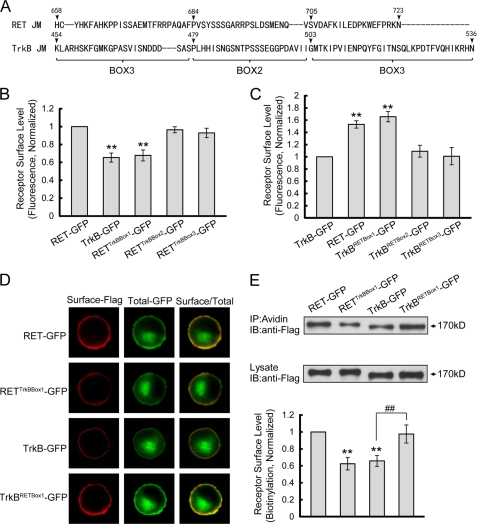
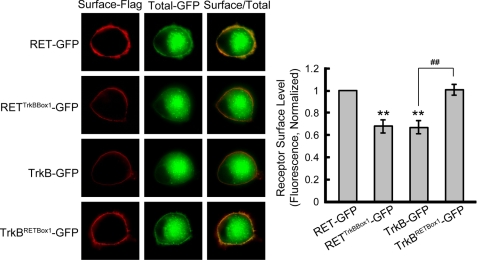
To define more precisely the structural motif in the juxtamembrane region required for efficient RET surface targeting, we divided the RET juxtamembrane region into three boxes (Fig. 5A). Chimeric receptors with swapped sequences between the corresponding boxes of RET and TrkB were generated and their cell surface levels were assessed in PC12 cells by ratiometric fluorescence assay. Substitution of TrkB Box1 into RET led to a significant decrease in surface receptor levels similar to that observed with RETTrkBJM-GFP (Fig. 5B). Conversely, transplantation of RET Box1 into TrkB led to a significant increase in surface receptor levels equivalent to that observed with TrkBRETJM-GFP (Fig. 5C). Swapping in other boxes had no significant effect on RET and TrkB chimera surface expression levels. Representative PC12 immunostaining images are shown in Fig. 5D. Receptor surface biotinylation experiments were performed to confirm our ratiometric fluorescence results. Quantitative analysis of the immunoblotting results showed that RETTrkBBox1-GFP exhibited decreased surface levels similar to TrkB. In contrast, TrkBRETBox1-GFP showed significantly increased cell surface levels comparable to RET-GFP (Fig. 5E). Finally we repeated the immunostaining experiment in primary cultured DRG neurons where we found results consistent with those observed in PC12 cells (Fig. 6). Taken together, these results suggest that Box1 in the RET juxtamembrane domain (amino acid 658–683) is necessary and sufficient for the differential RET and TrkB cell surface levels.
FIGURE 5.
Box1 motif in RET juxtamembrane domain is necessary and sufficient for the higher RET surface levels compared with TrkB. A, sequences of the juxtamembrane regions of RET and TrkB were aligned and three motifs (Box1–3) in the juxtamembrane region were divided. B, surface levels of chimeric RET-GFP receptors with Box1–3 substitution of TrkB were measured using a ratiometric fluorescence assay in transfected PC12 cells. Relative surface levels of each chimera were normalized to that of RET-GFP. The results are represented as mean ± S.E. from three independent experiments (**, p < 0.01 versus RET surface levels; one-way ANOVA). C, surface levels of chimeric TrkB receptors with Box1–3 substitution of RET were analyzed as in B. Relative surface levels of each chimera were normalized to that of TrkB-GFP. The results are represented as mean ± S.E. from three independent experiments (**, p < 0.01 versus TrkB surface levels; one-way ANOVA). D, represented images of immunostained PC12 cells used for statistics in B and C are shown. E, chimeric receptor surface levels were quantified by biotinylation methods in transfected PC12 cells. Relative surface expression levels of each chimera were normalized to that of RET-GFP. The results are represented as mean ± S.E. from three independent experiments (**, p < 0.01 versus RET surface levels; ##, p < 0.01 versus TrkB surface levels; one-way ANOVA).
FIGURE 6.
RET Box1 motif is necessary and sufficient for the differential RET and TrkB surface levels in DRG neurons. Cultured DRG neurons were transfected with indicated chimeric receptors. Surface levels of each chimera were measured using a ratiometric fluorescence assay and normalized to that of RET-GFP. The results are represented as mean ± S.E. from three independent experiments (**, p < 0.01 versus RET surface levels; ##, p < 0.01 versus TrkB surface levels; one-way ANOVA).
PKC Activation Enhances RET Surface Expression
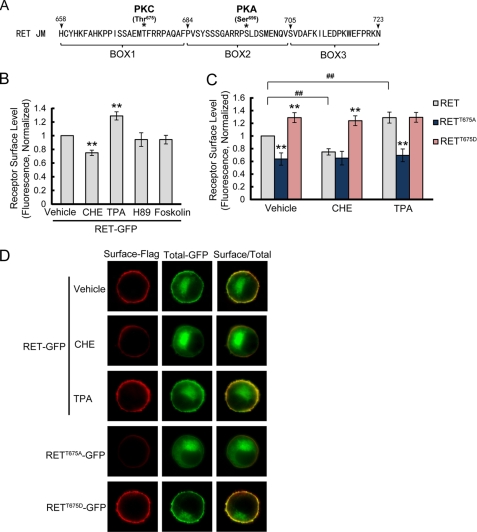
It is well known that sequence/residue and protein phosphorylation plays an important role in the modulation of receptor surface expression (16, 26). Given the finding that Box1 in the RET juxtamembrane domain is responsible for the differential RET and TrkB cell surface expression levels, we investigated whether this motif might contain a phosphorylation site to modulate RET cell surface levels. Inspection of the RET Box1 sequence revealed a threonine residue (Thr675) confirming the presence of a PKC phosphorylation consensus sequence (Fig. 7A). Notably, a PKA phosphorylation site (Ser696) in RET Box2 has also been reported (27). To test the effect of PKC or PKA activation on RET surface expression, PC12 cells expressing RET-GFP were treated with PKC and PKA inhibitors or activators, respectively. Receptor cell surface levels were then determined by a ratiometric fluorescence assay. Compared with vehicle group, treatment with the PKC inhibitor, CHE (5 μm) for 2 h resulted in significantly decreased cell surface levels of RET receptors. Accordingly, treatment with the PKC activator, TPA (10 μm), for 30 min up-regulated RET surface levels. In contrast, the PKA inhibitor H-89 or activator forskolin had no effect on RET surface levels (Fig. 7B).
FIGURE 7.
PKC but not PKA activation increases RET surface levels through the phosphorylation on RET Thr675 residue. A, inspection of RET Box1 sequence revealed Thr675 residue confirming the presence of a PKC phosphorylation consensus sequence. B, pharmacological treatment revealed PKC but not PKA could regulate RET cell surface levels. PC12 cells expressing RET-GFP were respectively treated with PKC inhibitor CHE for 2 h, PKC activator TPA for 30 min, PKA inhibitor H89 for 2 h or PKA activator forskolin for 30 min. Surface receptor levels were determined using a ratiometric fluorescence assay and normalized to that of vehicle-treated cells. The results are represented as mean ± S.E. from three independent experiments (**, p < 0.01 versus RET surface levels in vehicle-treated group; one-way ANOVA). C, mutagenesis of Thr675 residue affects RET surface levels and blocks the change in PKC-regulated RET surface levels. PC12 cells expressing T675A or T675D RET mutants were treated with CHE or TPA. Surface receptor levels were determined using ratiometric fluorescence assay and normalized to that of RET-GFP in vehicle-treated cells. The results are represented as mean ± S.E. from three independent experiments (**, p < 0.01 versus RET surface levels in the same group; ##, p < 0.01 versus RET surface levels in vehicle-treated group; one-way ANOVA). D, representative images of immunostained PC12 cells are shown.
Having identified Thr675 as a potential PKC phosphorylation site, we mutated Thr675 to Ala or Asp to mimic the non-phosphorylation or activated phosphorylation status, respectively. The T675A mutation significantly decreased RET receptor cell surface expression while the T675D mutation enhanced RET receptor cell surface expression (Fig. 7C). Moreover, the PKC inhibitor, CHE, or activator, TPA, could not further decrease or increase the cell surface levels of T675A or T675D mutants, which excluded the possibility that PKC might phosphorylate a site other than Thr675 to regulate RET surface expression. Representative immunostaining images are shown in Fig. 7D. Together, these findings suggested that PKC could positively modulate RET surface expression through phosphorylation of the Thr675 site in Box1.
To understand further the underlying mechanism by which Thr675 regulates RET surface expression, we compared the internalization and recycling levels between RET and RET-Thr675 mutants using a previously established methods (28, 29). After 30 min of ligand stimulation, about 50% of RET and RET-Thr675 mutants were internalized with no significant differences between each other (supplemental Fig. S2A). After 45 min of ligand stimulation, RET and RET-Thr675 mutants exhibited similar recycling levels (supplemental Fig. S2B). Furthermore, when receptor internalization was blocked by dynasore, a GTPase inhibitor that targets dynamin and blocks endocytosis, the differential receptor surface levels among RET and RET-Thr675 mutants were retained, suggesting that the role of Thr675 in RET surface expression is independent of the endocytic pathway (supplemental Fig. S2C). Taken together, these results suggest that the phosphorylation of Thr675 regulates RET surface expression via the exocytic pathway.
Depolarization Enhances RET Cell Surface Expression through PKC
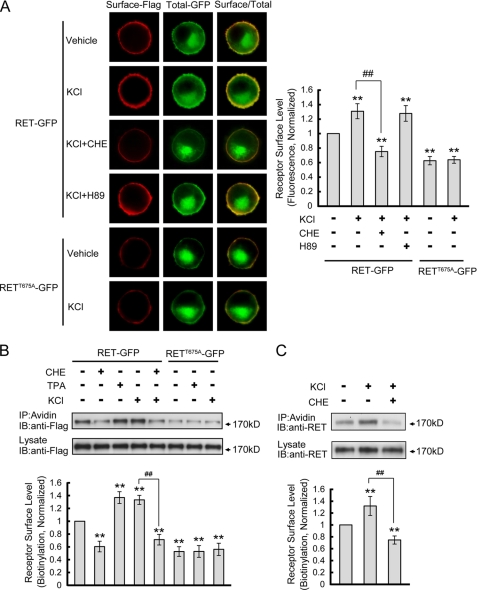
Neuronal activity can induce the activation of intracellular protein kinases and modulate cell response to stimuli through regulation of cell surface receptor levels (14, 30). We hypothesized that neuronal activity could modulate RET surface levels through activation of PKC. To investigate this hypothesis, we treated PC12 cells with 50 mm KCl for 30 min where we found that KCl treatment significantly enhanced RET surface expression. Pre-incubation with PKC inhibitor, CHE, but not PKA inhibitor, H89, blocked KCl induced increases in RET cell surface expression (Fig. 8A). The K+ depolarization had no effect on the cell surface levels of RETT675A receptor (Fig. 8A), which suggested that the phosphorylation of Thr675 residue by PKC was involved in activity-dependent enhancement of RET cell surface levels.
FIGURE 8.
Depolarization enhances RET cell surface levels through PKC but not PKA activation. A, PC12 cells transfected with RET-GFP or RETT675A-GFP were treated with 50 mm KCl for 30 min in the presence of various inhibitors. Receptor surface levels were determined using ratiometric fluorescence assay and normalized to that of RET-GFP in vehicle-treated cells. The results are represented as mean ± S.E. from three independent experiments (**, p < 0.01 versus RET surface levels in vehicle-treated group; ##, p < 0.01 versus RET surface levels in KCl-treated group; one-way ANOVA). B, receptor surface levels under various conditions were quantified by biotinylation methods in transfected PC12 cells. Relative receptor surface levels were normalized to that of RET-GFP in vehicle-treated cells. The results are represented as mean ± S.E. from three independent experiments (**, p < 0.01 versus RET surface levels in vehicle-treated group; ##, p < 0.01 versus RET surface levels in KCl-treated group; one-way ANOVA). C, effect of depolarization on endogenous RET surface expression was determined in cultured DRG neurons. RET cell surface levels were quantified by surface biotinylation in DRG neurons after KCl treatment with or without CHE pre-incubation. Relative RET surface levels were normalized to that of vehicle-treated neurons. The results are represented as mean ± S.E. from three independent experiments (**, p < 0.01 versus RET surface levels in vehicle-treated group; ##, p < 0.01 versus RET surface levels in KCl-treated group; one-way ANOVA).
A receptor surface biotinylation experiment was performed to confirm our previous immunofluorescence results. Treatment with TPA or KCl increased RET cell surface levels while CHE treatment decreased RET cell surface levels (Fig. 8B). Moreover, CHE pre-treatment or using a RETT675A mutant blocked KCl-induced increases in RET cell surface levels (Fig. 8B). To substantiate the results seen in PC12 cells, cultured DRG neurons were also depolarized by KCl with or without CHE pre-incubation and the endogenous RET surface levels were determined by biotinylation methods. We found KCl depolarization also increased RET surface levels in DRG neurons and that this effect could be blocked by CHE (Fig. 8C). Taken together, our results suggest that neuronal depolarization could enhance RET surface levels through the PKC-dependent phosphorylation of Thr675 in the RET juxtamembrane domain.
Thr675 Residue in RET Is Phosphorylated by PKC and Depolarization
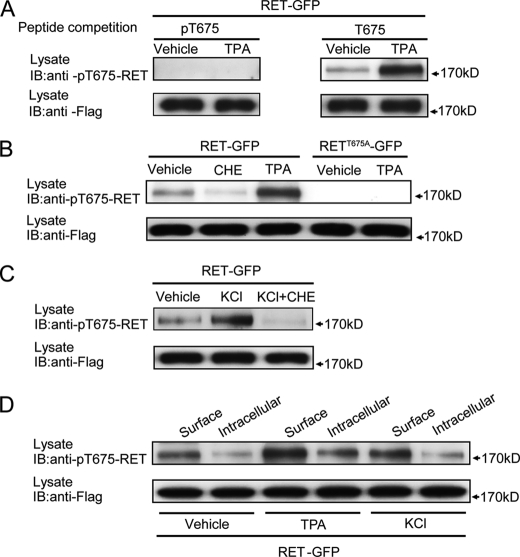
To confirm that the Thr675 site in RET Box1 is directly phosphorylated upon PKC activation or high K+ depolarization, we generated a new phospho-specific antibody against the RET Thr675 site (rabbit anti-pT675-RET). The antibody is directed against a phosphopeptide spanning the PKC phosphorylation site at Thr675. Specificity of the antibody was first confirmed by a peptide competition experiment. Preincubation with the phosphorylated peptide but not the non-phosphorylated peptide, was found to block the binding of the antibody to phosphorylated RET evoked by TPA treatment (Fig. 9A). This finding verifies that our rabbit anti-pT675-RET antibody could specially recognize phosphorylated RET on Thr675 residue. This rabbit anti-pT675-RET antibody was then used to detect directly the phosphorylation of the Thr675 site under various conditions. In contrast to TPA treatment, the PKC inhibitor, CHE, decreased and RETT675A mutagenesis completely abolished RET Thr675 phosphorylation (Fig. 9B). Thus, the Thr675 residue in RET specially serves as a PKC phosphorylation site to modulate RET surface levels.
FIGURE 9.
RET Thr675 residue is phosphorylated by PKC and depolarization. A, specificity of the rabbit anti-pT675-RET antibody was analyzed by a peptide competition experiment. B, RET Thr675 residue was phosphorylated by PKC in transfected PC12 cells. PC12 cells expressing RET-GFP were incubated with CHE for 2 h or TPA for 30 min, and then RET phosphorylation was detected by rabbit anti-pT675-RET antibody. Phosphorylation of RETT675A-GFP after TPA treatment was measured to confirm the binding specificity of our rabbit anti-pT675-RET antibody. C, phosphorylation of RET Thr675 residue upon depolarization in transfected PC12 cells was measured. PC12 cells expressing RET-GFP were treated with 50 mm KCl for 30 min in the absence or presence of CHE pre-treatment. Phospho-Thr675 levels were analyzed by Western blot. D, cell surface RET was preferentially phosphorylated on Thr675 compared with cytoplasmic RET. After incubation with TPA or KCl for 30 min, surface and cytoplasmic RET proteins in transfected PC12 cells were respectively collected. Thr675 phosphorylation levels were examined in surface or cytoplasmic RET fraction from vehicle, TPA, or KCl groups.
As we proposed phosphorylation of Thr675 by PKC mediates K+ depolarization induced RET surface levels increase, the phosphorylation of Thr675 was then detected under depolarizing conditions. Treatment with 50 mm KCl for 30 min increased RET Thr675 phosphorylation, which could be blocked by pre-treatment with CHE in transfected PC12 cells (Fig. 9C). These results indicated that depolarization could induce Thr675 phosphorylation through PKC. Since phosphorylation of Thr675 could enhance RET surface expression, the next question was whether cell surface RET was preferentially phosphorylated on Thr675. PC12 cells expressing RET-GFP were treated with 10 μm TPA or 50 mm KCl for 30 min, then surface biotinylation was performed and cell surface and cytoplasmic RET proteins were collected respectively according to the experimental procedures. When normalized to the total RET protein amount, the phosphorylation levels of the RET Thr675 site were significantly higher in the cell surface fraction compared with that in cytoplasmic fraction under vehicle, TPA and KCl-treated conditions (Fig. 9D), which suggested that cell surface RET receptors were preferentially phosphorylated on Thr675 compared with cytoplasmic RET receptors. Taken together, our findings suggest that neuronal depolarization could enhance RET surface expression through PKC-mediated phosphorylation of the RET Thr675 residue.
Thr675 Site in RET Regulates Ligand-induced Signaling and Cell Differentiation
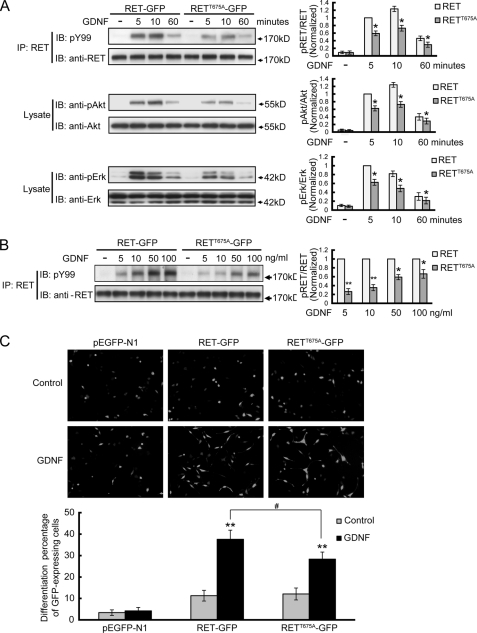
Modulation of cell surface receptor levels is a well-established mechanism for controlling cell response to a particular stimulus. Because we found that the Thr675 site was critical for modulating RET surface distribution, we next wanted to determine whether the Thr675 site might modulate GDNF-induced signaling pathways and cell response. As GDNF/sGFRα1 induced activation and downstream signaling of RET depend on the phosphorylation of several tyrosine residues in its intracellular domain, we examined RET activation levels by means of RET immunoprecipitation followed by pY99 immunoblotting. GDNF-stimulated receptor activation and downstream signaling of RETT675A-GFP exhibited a similar time course but reduced levels compared with those of RET-GFP (Fig. 10A). When treated with GDNF at different concentrations, the activation of RETT675A was mostly reduced under 5 ng/ml GDNF treatment (∼25%) compared with that of RET, which suggested that the T675A mutation could decrease RET receptor sensitivity to ligand stimuli (Fig. 10B). PC12 cells transfected with pEGFP-N1, RET-GFP, or RETT675A-GFP were treated with 50 ng/ml GDNF for 3 days and the differentiation percentages of GFP-positive cells were measured. Compared with RET-GFP group, RETT675A-GFP positive cells showed reduced cell differentiation in response to GDNF treatment (Fig. 10C). Therefore, the Thr675 site in RET Box1 domain could modulate GDNF-induced RET downstream signaling as well as cell differentiation, through its regulation of RET cell surface levels.
FIGURE 10.
RET Thr675 residue regulates ligand-induced RET signaling and cell differentiation. A, analysis of the signal transduction mediated by RETT675A receptor in response to GDNF stimulation. PC12 cells were transfected with GFP fused RET or RETT675A and stimulated with 50 ng/ml GDNF for 5, 10 or 60 min. Immunoprecipitates or cell lysates were analyzed with the indicated antibodies. The levels of phospho-RET, phospho-Akt, and phospho-Erk1/2 were represented as the ratios of phosphoprotein over total protein. The histogram shows the phosphorylation levels of RET, Akt or Erk1/2 from three independent experiments normalized to their respective 5 min RET group. The results are represented as mean ± S.E. from three independent experiments (*, p < 0.05 versus their respective RET group; Student's t test). B, analysis of RET and RETT675A activation in response to different GDNF concentrations. PC12 cells were transfected with GFP-fused RET or RETT675A and stimulated by different GDNF concentrations. The levels of phospho-RET were represented as the ratios of phospho-RET versus total RET. At each GDNF concentration, phosphorylation levels of RETT675A were normalized to that of RET. The results are represented as mean ± S.E. from three independent experiments (*, p < 0.05, **, p < 0.01 versus their respective RET group; Student's t test). C, GDNF induced differentiation of PC12 cells expressing GFP fused RET or RETT675A. PC12 cells transfected with the indicated constructs were stimulated with 50 ng/ml GDNF for 3 days. Cells displaying neurite extension longer than twice the cell diameter were counted as differentiated cells. The results were normalized to the total number of transfected (GFP-positive) PC12 cells in each field. All of the GDNF stimulations were supplemented with 300 ng/ml soluble GFRα1. The results are represented as mean ± S.E. from three independent experiments (**, p < 0.01 versus their respective control group; #, p < 0.05 versus GDNF-treated RET group; one-way ANOVA).
DISCUSSION
Receptor surface levels can determine cell responsiveness to particular stimuli. Previous studies have found that sequence motifs, protein kinases, and neuronal activity could modulate receptor surface expression (16, 17). But it is still unknown whether such mechanisms exist in the control of RET surface levels. In the present study, we demonstrated that RET and TrkB exhibit differential cell surface levels in DRG neurons and identified a key motif (Box1) in the RET juxtamembrane region responsible for this difference. Furthermore, we identified Thr675 in Box1 as a critical residue, which is phosphorylated upon PKC activation and cell depolarization, and thereby regulates RET cell surface levels. Finally we found the Thr675 site modulates ligand-induced RET signaling and cell differentiation.
Our studies provided three novel insights into the regulation of RET cell surface levels. First, we found that RET and TrkB receptors exhibit differential surface levels and identified a key motif (Box1) in the RET juxtamembrane region responsible for this difference. When RET and TrkB were co-expressed in non-peptidergic DRG neurons (20, 21), we found that the cell surface levels of RET were higher than TrkB. An increasing number of studies indicate that receptor trafficking from the biosynthetic pathway to the cell surface is tightly regulated (12, 13, 31) and that the targeting and sorting of membrane receptors are directed by their intrinsic sequence based signal motifs (32, 33). The differential cell surface levels between RET and TrkB suggested that a specific structural motif was responsible for this difference. In this context, studies by Huang and co-workers (34) have also suggested a model for a motif-dependent differential cell surface expression in their studies of two cytokine receptors, the thrombopoietin (TpoR) and erythropoietin (EpoR) receptors. TpoR shares a similar intracellular structure with EpoR but exhibits higher surface levels than EpoR, which depends on its juxtamembrane Box1 and Box2 regions (34). By swapping the corresponding domains between RET and TrkB, we have found that the Box1 motif in the RET juxtamembrane region is necessary and sufficient for the differential RET and TrkB surface levels in transfected PC12 cells and DRG neurons. This finding advances our understanding of the structural motif responsible for RET surface expression and suggests that the Box1 motif may contain some regulatory mechanisms that direct RET surface targeting.
Second, we found that PKC activation and neuronal depolarization can enhance RET cell surface levels through phosphorylation of the Thr675 site in the RET Box1 motif. Protein kinases have been reported previously to be involved in regulating receptor surface expression. For example, PKC activation has been reported to increase NMDA receptor levels on the cell surface, and PKA has also been found to increase GluA1 containing AMPA receptor cell surface levels (15, 35). Pharmacological treatments in our study suggested that PKC but not PKA is involved in RET cell surface levels regulation. Mutagenesis of the predicted PKC phosphorylation site (Thr675) blocked the modulatory effects of PKC on RET surface expression. By generating a specific antibody for the phosphorylated Thr675 site, we demonstrated that a PKC agonist or inhibitor could increase or decrease, respectively, the Thr675 phosphorylation levels, which provides direct evidence that the Thr675 residue is the key PKC phosphorylation site. Direct phosphorylation of the receptor is a well-established mechanism by which PKC modulates receptor surface levels. In cultured retinal neurons and transfected HEK293 cells, phosphorylation on Ser842 by PKC upon TPA stimulation leads to increased surface expression of GluA4 (26). Scott DB et al. reported that Ser890 and Ser896 phosphorylation by PKC is essential for the suppression of the ER retention signal in the C-terminal of the NMDA receptor and promotes its surface delivery (16). Our study provides an additional example of the role of PKC in surface receptor trafficking through our observation that it modulates RET cell surface levels by phosphorylation of the Thr675 site. Although our results suggest the phosphorylation of the Thr675 site by PKC regulates RET surface expression via the exocytic pathway, the detailed mechanisms underlying RET trafficking from the biosynthetic pathway requires further investigation.
Neuronal depolarization has been found to enhance GDNF induced survival of cultured sympathetic neurons. It has been proposed that the high K+ depolarization promotes the binding of GDNF to RET by increasing GFRα1 expression (36). In our study, we found that high K+ depolarization increases RET cell surface levels, which provides an alternative explanation for neuronal activity enhanced GDNF function. Neuronal depolarization regulated receptor cell surface trafficking typically requires the activation of intracellular protein kinases. Neuronal depolarization by K+ leads to the insertion of GluA2 containing AMPA receptors into the synaptic membrane and requires the phosphorylation of Ser880 by PKC (18). We found that depolarization enhanced phosphorylation of the Thr675 site, which required PKC but not PKA activation, and increased RET cell surface levels by ∼0.3-fold. A previous study reported that long-term potentiation (LTP) could enhance membrane surface expression of NR2A and NR1 subunits by ∼0.2-fold via a PKC and Src family tyrosine kinase pathway in hippocampal CA1 mini-slices (37), which is comparable to the depolarization-induced RET surface levels changes observed in DRG neurons. Together, our study establishes a model that neuronal depolarization enhances RET surface levels through the phosphorylation of its Thr675 site by PKC and thus facilitates enhanced cell responsiveness to GDNF stimulation. This finding suggests a novel regulatory pathway by which neuronal activity enhances GDNF functions.
Third, we found that the RET Thr675 residue can regulate GDNF-induced signaling and cell differentiation. Several key residues in the RET intracellular portion important for RET signaling and functions have been previously identified (3, 27). Among these residues, the most investigated are the tyrosine residues which are critical for RET mediated cell functions and can be phosphorylated to initiate downstream signaling events upon ligand stimulation. For example, phosphorylated Tyr1062 has the capacity to recruit PI3K/Akt, Ras/Erk, and so on for downstream transduction (38, 39). GDNF-stimulated phosphorylation of Erk and Akt in DRG neurons is significantly decreased in Y1062F homozygous mice, which die within 1 month after birth due to serious developmental deficiencies during embryogenesis (40, 41). In addition to the tyrosines, the RET Ser696 residue, which acts as PKA phosphorylation site, is required for GDNF-mediated activation of the Rac signaling pathway (27). We found that Thr675 represents a PKC phosphorylation site and that GDNF induced MAPK and PI3K signaling pathways and cell differentiation were impaired in cells containing RETT675A. Our results revealed that the Thr675 residue in RET intracellular domain can regulate RET mediated signaling and function via its modulation of RET cell surface levels.
In conclusion, our study identified a key motif (Box1) in the RET juxtamembrane region responsible for differential RET and TrkB surface levels. We further found that the RET Thr675 residue in Box1 represents a PKC phosphorylation site and mediates PKC activation and neuronal depolarization enhanced RET surface expression. These findings provide new mechanistic links between receptor sequence, protein kinase, and neuronal activity in the modulation of RET surface levels.
Supplementary Material
This study was supported by National Natural Science Foundation of China (No. 30725020, 30900717, 31071254, 31130026), the National 973 Basic Research Program of China (No. 2010CB912004, 2012CB911004), the State Program of National Natural Science Foundation of China for Innovative Research Group (No. 81021001), the Foundation for Excellent Young Scientists of Shandong Province (BS2010SW022, BS2010SW023), Research Fund for the Doctoral Program of Higher Education of China (200804221070), and Independent Innovation Foundation of Shandong University (IIFSDU).

This article contains supplemental Figs. S1–S2.
- TrkB
- tropomyosin-related kinase B
- GDNF
- glial cell line-derived neurotrophic factor
- GFL
- GDNF family ligands
- DRG
- dorsal root ganglion
- TPA
- 12-O-tetradecanoylphorbol-13-acetate.
REFERENCES
- 1. Schuchardt A., D'Agati V., Larsson-Blomberg L., Costantini F., Pachnis V. (1994) Defects in the kidney and enteric nervous system of mice lacking the tyrosine kinase receptor Ret. Nature 367, 380–383 [DOI] [PubMed] [Google Scholar]
- 2. Baloh R. H., Enomoto H., Johnson E. M., Jr., Milbrandt J. (2000) The GDNF family ligands and receptors - implications for neural development. Curr. Opin. Neurobiol. 10, 103–110 [DOI] [PubMed] [Google Scholar]
- 3. Airaksinen M. S., Saarma M. (2002) The GDNF family: signaling, biological functions, and therapeutic value. Nat. Rev. Neurosci. 3, 383–394 [DOI] [PubMed] [Google Scholar]
- 4. Molliver D. C., Wright D. E., Leitner M. L., Parsadanian A. S., Doster K., Wen D., Yan Q., Snider W. D. (1997) IB4-binding DRG neurons switch from NGF to GDNF dependence in early postnatal life. Neuron 19, 849–861 [DOI] [PubMed] [Google Scholar]
- 5. Honma Y., Kawano M., Kohsaka S., Ogawa M. (2010) Axonal projections of mechanoreceptive dorsal root ganglion neurons depend on Ret. Development 137, 2319–2328 [DOI] [PubMed] [Google Scholar]
- 6. Luo W., Wickramasinghe S. R., Savitt J. M., Griffin J. W., Dawson T. M., Ginty D. D. (2007) A hierarchical NGF signaling cascade controls Ret-dependent and Ret-independent events during development of nonpeptidergic DRG neurons. Neuron 54, 739–754 [DOI] [PubMed] [Google Scholar]
- 7. Valdés-Sánchez T., Kirstein M., Pérez-Villalba A., Vega J. A., Fariñas I. (2010) BDNF is essentially required for the early postnatal survival of nociceptors. Dev. Biol. 339, 465–476 [DOI] [PubMed] [Google Scholar]
- 8. Sariola H., Saarma M. (2003) Novel functions and signaling pathways for GDNF. J. Cell Sci. 116, 3855–3862 [DOI] [PubMed] [Google Scholar]
- 9. Fisher C. E., Michael L., Barnett M. W., Davies J. A. (2001) Erk MAP kinase regulates branching morphogenesis in the developing mouse kidney. Development 128, 4329–4338 [DOI] [PubMed] [Google Scholar]
- 10. Asai N., Iwashita T., Matsuyama M., Takahashi M. (1995) Mechanism of activation of the ret proto-oncogene by multiple endocrine neoplasia 2A mutations. Mol. Cell. Biol. 15, 1613–1619 [DOI] [PMC free article] [PubMed] [Google Scholar]
- 11. Hein L., Ishii K., Coughlin S. R., Kobilka B. K. (1994) Intracellular targeting and trafficking of thrombin receptors. A novel mechanism for resensitization of a G protein-coupled receptor. J. Biol. Chem. 269, 27719–27726 [PubMed] [Google Scholar]
- 12. Achour L., Labbé-Jullie C., Scott M. G., Marullo S. (2008) An escort for GPCRs: implications for regulation of receptor density at the cell surface. Trends Pharmacol Sci 29, 528–535 [DOI] [PubMed] [Google Scholar]
- 13. Horak M., Chang K., Wenthold R. J. (2008) Masking of the endoplasmic reticulum retention signals during assembly of the NMDA receptor. J. Neurosci. 28, 3500–3509 [DOI] [PMC free article] [PubMed] [Google Scholar]
- 14. Crump F. T., Dillman K. S., Craig A. M. (2001) cAMP-dependent protein kinase mediates activity-regulated synaptic targeting of NMDA receptors. J. Neurosci. 21, 5079–5088 [DOI] [PMC free article] [PubMed] [Google Scholar]
- 15. Lan J. Y., Skeberdis V. A., Jover T., Grooms S. Y., Lin Y., Araneda R. C., Zheng X., Bennett M. V., Zukin R. S. (2001) Protein kinase C modulates NMDA receptor trafficking and gating. Nat. Neurosci. 4, 382–390 [DOI] [PubMed] [Google Scholar]
- 16. Scott D. B., Blanpied T. A., Ehlers M. D. (2003) Coordinated PKA and PKC phosphorylation suppresses RXR-mediated ER retention and regulates the surface delivery of NMDA receptors. Neuropharmacology 45, 755–767 [DOI] [PubMed] [Google Scholar]
- 17. Bouchard J. F., Horn K. E., Stroh T., Kennedy T. E. (2008) Depolarization recruits DCC to the plasma membrane of embryonic cortical neurons and enhances axon extension in response to netrin-1. J. Neurochem. 107, 398–417 [DOI] [PubMed] [Google Scholar]
- 18. Patten S. A., Ali D. W. (2009) PKCγ-induced trafficking of AMPA receptors in embryonic zebrafish depends on NSF and PICK1. Proc. Natl. Acad. Sci. U.S.A. 106, 6796–6801 [DOI] [PMC free article] [PubMed] [Google Scholar]
- 19. Zhao L., Sheng A. L., Huang S. H., Yin Y. X., Chen B., Li X. Z., Zhang Y., Chen Z. Y. (2009) Mechanism underlying activity-dependent insertion of TrkB into the neuronal surface. J. Cell Sci. 122, 3123–3136 [DOI] [PubMed] [Google Scholar]
- 20. Kramer I., Sigrist M., de Nooij J. C., Taniuchi I., Jessell T. M., Arber S. (2006) A role for Runx transcription factor signaling in dorsal root ganglion sensory neuron diversification. Neuron 49, 379–393 [DOI] [PubMed] [Google Scholar]
- 21. Kashiba H., Uchida Y., Senba E. (2003) Distribution and colocalization of NGF and GDNF family ligand receptor mRNAs in dorsal root and nodose ganglion neurons of adult rats. Brain Res. Mol. Brain Res. 110, 52–62 [DOI] [PubMed] [Google Scholar]
- 22. Greene L. A., Tischler A. S. (1976) Establishment of a noradrenergic clonal line of rat adrenal pheochromocytoma cells which respond to nerve growth factor. Proc. Natl. Acad. Sci. U.S.A. 73, 2424–2428 [DOI] [PMC free article] [PubMed] [Google Scholar]
- 23. O'Lague P. H., Huttner S. L. (1980) Physiological and morphological studies of rat pheochromocytoma cells (PC12) chemically fused and grown in culture. Proc. Natl. Acad. Sci. U.S.A. 77, 1701–1705 [DOI] [PMC free article] [PubMed] [Google Scholar]
- 24. Califano D., D'Alessio A., Colucci-D'Amato G. L., De Vita G., Monaco C., Santelli G., Di Fiore P. P., Vecchio G., Fusco A., Santoro M., de Franciscis V. (1996) A potential pathogenetic mechanism for multiple endocrine neoplasia type 2 syndromes involves ret-induced impairment of terminal differentiation of neuroepithelial cells. Proc. Natl. Acad. Sci. U.S.A. 93, 7933–7937 [DOI] [PMC free article] [PubMed] [Google Scholar]
- 25. Kelly-Spratt K. S., Klesse L. J., Merenmies J., Parada L. F. (1999) A TrkB/insulin receptor-related receptor chimeric receptor induces PC12 cell differentiation and exhibits prolonged activation of mitogen-activated protein kinase. Cell Growth & Differ. 10, 805–812 [PubMed] [Google Scholar]
- 26. Gomes A. R., Correia S. S., Esteban J. A., Duarte C. B., Carvalho A. L. (2007) PKC anchoring to GluR4 AMPA receptor subunit modulates PKC-driven receptor phosphorylation and surface expression. Traffic 8, 259–269 [DOI] [PubMed] [Google Scholar]
- 27. Fukuda T., Kiuchi K., Takahashi M. (2002) Novel mechanism of regulation of Rac activity and lamellipodia formation by RET tyrosine kinase. J. Biol. Chem. 277, 19114–19121 [DOI] [PubMed] [Google Scholar]
- 28. Chen Z. Y., Ieraci A., Tanowitz M., Lee F. S. (2005) A novel endocytic recycling signal distinguishes biological responses of Trk neurotrophin receptors. Mol. Biol. Cell 16, 5761–5772 [DOI] [PMC free article] [PubMed] [Google Scholar]
- 29. Huang S. H., Zhao L., Sun Z. P., Li X. Z., Geng Z., Zhang K. D., Chao M. V., Chen Z. Y. (2009) Essential role of Hrs in endocytic recycling of full-length TrkB receptor but not its isoform TrkB.T1. J. Biol. Chem. 284, 15126–15136 [DOI] [PMC free article] [PubMed] [Google Scholar]
- 30. Wakade T. D., Bhave S. V., Bhave A. S., Malhotra R. K., Wakade A. R. (1991) Depolarizing stimuli and neurotransmitters utilize separate pathways to activate protein kinase C in sympathetic neurons. J. Biol. Chem. 266, 6424–6428 [PubMed] [Google Scholar]
- 31. Brismar H., Asghar M., Carey R. M., Greengard P., Aperia A. (1998) Dopamine-induced recruitment of dopamine D1 receptors to the plasma membrane. Proc. Natl. Acad. Sci. U.S.A. 95, 5573–5578 [DOI] [PMC free article] [PubMed] [Google Scholar]
- 32. Kirchhausen T. (2002) Single-handed recognition of a sorting traffic motif by the GGA proteins. Nat. Struct. Biol. 9, 241–244 [DOI] [PubMed] [Google Scholar]
- 33. Dupré D. J., Hébert T. E. (2006) Biosynthesis and trafficking of seven transmembrane receptor signaling complexes. Cell Signal 18, 1549–1559 [DOI] [PubMed] [Google Scholar]
- 34. Tong W., Sulahian R., Gross A. W., Hendon N., Lodish H. F., Huang L. J. (2006) The membrane-proximal region of the thrombopoietin receptor confers its high surface expression by JAK2-dependent and -independent mechanisms. J. Biol. Chem. 281, 38930–38940 [DOI] [PubMed] [Google Scholar]
- 35. Man H. Y., Sekine-Aizawa Y., Huganir R. L. (2007) Regulation of {alpha}-amino-3-hydroxy-5-methyl-4-isoxazolepropionic acid receptor trafficking through PKA phosphorylation of the Glu receptor 1 subunit. Proc. Natl. Acad. Sci. U.S.A. 104, 3579–3584 [DOI] [PMC free article] [PubMed] [Google Scholar]
- 36. Doxakis E., Wyatt S., Davies A. M. (2000) Depolarisation causes reciprocal changes in GFR(alpha)-1 and GFR(alpha)-2 receptor expression and shifts responsiveness to GDNF and neurturin in developing neurons. Development 127, 1477–1487 [DOI] [PubMed] [Google Scholar]
- 37. Grosshans D. R., Clayton D. A., Coultrap S. J., Browning M. D. (2002) LTP leads to rapid surface expression of NMDA but not AMPA receptors in adult rat CA1. Nat. Neurosci. 5, 27–33 [DOI] [PubMed] [Google Scholar]
- 38. Segouffin-Cariou C., Billaud M. (2000) Transforming ability of MEN2A-RET requires activation of the phosphatidylinositol 3-kinase/AKT signaling pathway. J. Biol. Chem. 275, 3568–3576 [DOI] [PubMed] [Google Scholar]
- 39. Kurokawa K., Iwashita T., Murakami H., Hayashi H., Kawai K., Takahashi M. (2001) Identification of SNT/FRS2 docking site on RET receptor tyrosine kinase and its role for signal transduction. Oncogene 20, 1929–1938 [DOI] [PubMed] [Google Scholar]
- 40. Jijiwa M., Fukuda T., Kawai K., Nakamura A., Kurokawa K., Murakumo Y., Ichihara M., Takahashi M. (2004) A targeting mutation of tyrosine 1062 in Ret causes a marked decrease of enteric neurons and renal hypoplasia. Mol. Cell. Biol. 24, 8026–8036 [DOI] [PMC free article] [PubMed] [Google Scholar]
- 41. Miyamoto R., Jijiwa M., Asai M., Kawai K., Ishida-Takagishi M., Mii S., Asai N., Enomoto A., Murakumo Y., Yoshimura A., Takahashi M. (2011) Loss of Sprouty2 partially rescues renal hypoplasia and stomach hypoganglionosis but not intestinal aganglionosis in Ret Y1062F mutant mice. Dev. Biol. 349, 160–168 [DOI] [PubMed] [Google Scholar]
Associated Data
This section collects any data citations, data availability statements, or supplementary materials included in this article.


