

Abstract
The tumor suppressor p53 is a hub protein with a multitude of binding partners, many of which target its intrinsically disordered N-terminal domain, p53-TAD. Partners, such as the N-terminal domain of MDM2, induce formation of local structure and leave the remainder of the domain apparently disordered. We investigated segmental chain motions in p53-TAD using fluorescence quenching of an extrinsic label by tryptophan in combination with fluorescence correlation spectroscopy (PET-FCS). We studied the loop closure kinetics of four consecutive segments within p53-TAD and their response to protein binding and phosphorylation. The kinetics was multiexponential, showing that the conformational ensemble of the domain deviates from random coil, in agreement with previous findings from NMR spectroscopy. Phosphorylations or binding of MDM2 changed the pattern of intrachain kinetics. Unexpectedly, we found that upon binding and phosphorylation chain motions were altered not only within the targeted segments but also in remote regions. Long-range interactions can be induced in an intrinsically disordered domain by partner proteins that induce apparently only local structure or by post-translational modification.
Introduction
The tumor suppressor protein p53 is a transcription factor that, among other functions, up-regulates the expression of genes involved in cell-cycle arrest, senescence, and apoptosis in response to cellular stress.1,2 Its activity is modulated through key interactions with coactivators that control its stability and transcriptional output. Repression of p53 activity is importantly mediated by the interaction of its N-terminal domain, p53-TAD, with the ubiquitin ligase MDM2.3 There is competition for binding the p53-TAD between the N-terminal domain of MDM2 and coactivators, such as p300, that assist in up-regulation of transcription.3 p53-TAD consists of two subdomains, TAD1 (residues 1–40) and TAD2 (41–61), which are essential for interactions with coactivators.4,5 On stress-induced activation, p53-TAD undergoes extensive phosphorylation, which inhibits the binding to MDM2 and enhances binding to p300.6 An array of kinases dynamically phosphorylates serine and threonine residues throughout the domain, dependent on the type and dose of damage or stress.7 The influence of these post-translational modifications on binding affinity and consequences on p53 activity have been studied intensively using biochemical methods as well as at the cellular level.5,6,8−12 Overall phosphorylation modulates p53-TAD interactions with various binding partners, enhancing transcription protein contacts and activity.
The isolated p53-TAD is intrinsically disordered.13−15 Its hydrodynamic radius in physiological solution is similar to that of chemically denatured proteins of same sequence length.14,16 p53-TAD forms local elements of helical structure that become fully helical on binding to coactivators/repressors.17−20 Nascent local structural elements have been detected in subdomains in isolation, structures that are thought to be dynamic, even in the context of tight associations with transcription proteins as shown by NMR.14,21−25 Further, in the context of intrinsically disordered domains, phosphorylation can disrupt or stabilize structure locally, influencing protein function.18,26,27 However, the consequences of post-translational modifications on the structural and dynamic properties of p53-TAD are not well understood.
p53 is misregulated in >70% of all types of human cancers, and it has thus been a highly targeted protein for pharmacological intervention. Further, its structure and function are representative of a large and important class of transcriptional activators, and as a result, p53 serves as an exceptional model for dissecting transcriptional activator binding networks. One of the prevailing questions for this class of activators is how the transcriptional activation domains, domains that are intrinsically disordered in the absence of binding partners, are structurally altered by post-translational modifications and/or the binding of partner proteins. For p53, phosphorylation at several positions is known to alter its binding preference from an interaction with its repressor protein Mdm2 to the formation of complexes with coactivators such as CBP/p300.6 Protein phosphorylation in disordered proteins (or disordered segments of proteins) is a very common phenomenon, important and relevant to different human diseases, and in these cases, where there is an absence of crystallographic data, the effects of protein phosphorylation are particularly difficult to understand from a structural perspective.
Here, we measured the kinetics of segmental chain motions in p53-TAD(1–93) and studied their response to binding of the N-terminal domain of MDM2(2–125) and site-specific phosphorylation, using fluorescence quenching by photoinduced electron transfer (PET) in combination with fluorescence correlation spectroscopy (PET-FCS).28,29 We found site-dependent, multiexponential kinetics of loop closure on the nanosecond to microsecond time scale. MDM2(2–125) dramatically altered chain motions in sequence segments directly involved in binding but also influenced chain motions in neighboring segments. Phosphorylation of p53-TAD slowed loop closure of the targeted chain segment. Unexpectedly, we observed the appearance of additional microsecond kinetics in chain segments that were remote from the sites of phosphorylation. Our results indicate allosteric communication in the mechanism of regulation of p53 through its transactivation domain.
Results
Design of the Reporter System To Measure Chain Motions in p53-TAD
PET-FCS measures kinetics of protein chain motions by correlation analysis of fluorescence fluctuations arising from individual molecules passing through the detection volume of a confocal fluorescence microscope setup by Brownian motion.28 The side chain of Trp (W) quenches the fluorescence of extrinsic labels on contact with it via PET. Fluorescence fluctuations caused by interactions between fluorophore and Trp within proteins reveal kinetics of ultrafast folding,28,29 motions within folding intermediates,30 and loop closure kinetics within protein denatured states or intrinsically disordered domains.16,29 The rate constant of loop closure is the rate at which two side chains within a polypeptide form contact, thereby closing a loop. The process is mediated by diffusional motions of the polypeptide backbone. Here, we applied PET-FCS to measure loop closure kinetics of segments within the intrinsically disordered p53-TAD.
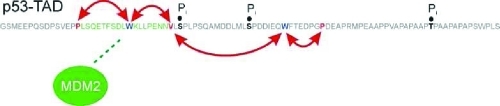
p53-TAD contains three Trps that can serve as fluorescence quenchers in PET-FCS. To probe loop closure kinetics site-specifically, we replaced two Trp residues by phenylalanine and used the third as a PET probe. The oxazine fluorphore AttoOxa11 (Oxa) was attached site-specifically to p53-TAD using a thiol-reactive maleimide-derivative of the fluorophore to modify single cysteine residues that had been introduced via site-directed mutagenesis. Residues P13, V31, and P60, which border the helical and turn regions of TAD1 and TAD2, were replaced by cysteine.5,14 The TAD1 and TAD2 tryptophans W23 and W53 were used as PET probes, while W91 was present as a phenyalanine in all constructs. In this way, we generated four 93-residue p53-TAD(1–93) constructs to measure the loop closure kinetics of segments Oxa13-W23, W23-Oxa31, Oxa31-W53, and W53-Oxa60 (Figure 1).
Figure 1.

Segmental chain motions in p53-TAD(1–93) and influence of MDM2(2–125) binding. Top: Sequence of p53-TAD(1–93) from the N- to the C-terminus. The positions where the fluorophore AttoOxa11 has been introduced and where the natural Trp side chains are located to probe loop closure kinetics are indicated in red and blue, respectively. The four chain segments probed are color-coded at the top of the sequence. The sequence segment that binds to MDM2(2–125) is indicated by a black bar. Middle: ACFs recorded from modified p53-TAD(1–93) in the free and MDM2(2–125)-bound states. The probed chain segments are color-coded as illustrated in the top sequence and shown in each panel. The black lines are data fits to a model for a single diffusing species exhibiting up to three monoexponential relaxations. ACFs of segments 13–23 and 23–31 without MDM2(2–125) are offset along the y-axis for reasons of clarity. Bottom: Plots of the amplitudes of each of the monoexponential submillisecond decays versus the corresponding rate constant of loop closure, kic, calculated from the fitted parameters (Materials and Methods). The color code from the panels above applies. The arrows indicate the observed changes in amplitude and rate constant of the individual relaxations upon MDM2(2–125)-binding. Arrows from or to the zero-line of amplitude (x-axis) indicate the appearance or disappearance, respectively, of a relaxation. Error bars are propagated standard errors from data fits.
Kinetics of Loop Closure within p53-TAD and Influence of MDM2 (2–125) Binding
We recorded autocorrelation functions (ACFs) of all four p53-TAD (1–93) constructs using FCS to determine rate constants of loop closure of individual chain segments (Figure 1). We observed pronounced decays of the ACFs in the submillisecond time domain reporting on intrachain dynamics. We could exclude nonstructural causes as the origin of the observed submillisecond relaxations in PET-FCS experiments because the label is devoid of photophysical effects under the employed experimental conditions.29,30 The submillisecond decays did not fit to a single-exponential function but instead required an FCS model containing a sum of two single-exponential decays (Materials and Methods). The kinetics varied with sequence position. There was a dominant ∼100-ns kinetic phase and a microsecond phase of minor amplitude present in all constructs (Figure 1). While the nanosecond-decays reported loop closure, the microsecond relaxations originated from the formation of nonrandom chain configurations that modulate kinetics of chain contacts between fluorophore and Trp. All rate constants of loop closure determined by PET-FCS are summarized in Table 1. The microsecond rate constant and corresponding amplitude of Oxa13-W23 were within the experimental error limits of the major phase and could not be determined accurately.
Table 1. Rate Constants of Loop Closure in p53-TAD(1–93) and Influence of MDM2(2–125) Binding and Phosphorylationa.
| k1 (×106 s–1) | k2 (×105 s–1) | k3 (×104 s–1) | |
|---|---|---|---|
| Oxa13-W23 | 2.81 ± 0.46 | -- | |
| Oxa13-W23 + MDM2 | 0.30 ± 0.12 | ||
| Oxa13-W23-phos | 2.27 ± 0.40 | 1.3 ± 0.7 | |
| Oxa13-W23-phos + MDM2 | -- | 4 ± 2 | |
| W23-Oxa31 | 3.24 ± 0.83 | 3.9 ± 1.7 | |
| W23-Oxa31 + MDM2 | 0.64 ± 0.50 | 4.5 ± 0.8 | |
| W23-Oxa31-phos | 1.9 ± 0.6 | 3.1 ± 1.5 | |
| W23-Oxa31-phos + MDM2 | n.d. | n.d. | n.d. |
| Oxa31-W53 | 1.39 ± 0.47 | 7.5 ± 4.9 | |
| Oxa31-W53 + MDM2 | 2.1 ± 1.1 | 2.2 ± 0.5 | 0.58 ± 0.25 |
| Oxa31-W53-phos | 2.6 ± 0.9 | ||
| Oxa31-W53-phos + MDM2 | 1.01 ± 0.24 | 0.43 ± 0.12 | 0.11 ± 0.06 |
| W53-Oxa60 | 3.59 ± 0.52 | 2.8 ± 2.7 | |
| W53-Oxa60 + MDM2 | 4.20 ± 0.72 | 2.8 ± 0.9 | 1.13 ± 0.30 |
| W53-Oxa60-phos | 3.33 ± 0.73 | 1.7 ± 1.5 | |
| W53-Oxa60-phos + MDM2 | 10 ± 5 | 1.1 ± 0.4 | 0.53 ± 0.27 |
“--“: Experimental error larger than value. n.d.: Not determined because of protein aggregation. Errors are standard errors from data fits.
To monitor changes in each of the observed phases upon induced structure formation, we investigated the influence of MDM2(2–125) binding on loop closure kinetics. The effects of the p53-TAD(1–93) tryptophan mutations on MDM2(2–125) binding affinity were measured in independent isothermal titration calorimetry (ITC) experiments (Supporting Information Figure 1). Although the W53F mutation did not cause significant changes in affinity, a decreased affinity was observed for the W23F mutant, likely due to its direct participation in the MDM2(2–125) binding interaction. For this mutant, the binding affinity was determined to be approximately 10-fold weaker than the wild-type interaction measured by tryptophan fluorescence (Supporting Information Figure 2). To overcome problems from differences in affinity, we performed all PET-FCS experiments under saturating conditions (excess of 50 μM MDM2(2–125) over 1 nM p53-TAD(1–93)), where p53-TAD(1–93) was near-quantitatively bound to MDM2 (2–125).
Recorded ACFs of MDM2(2–125)-binding experiments and data analysis are shown in Figure 1. The primary MDM2(2–125) binding site within the p53-TAD(1–93) spans segments Oxa13-W23 and W23-Oxa31, while weaker influences are reported in the neighboring Oxa31-W53 and the remote W53-Oxa60 segments.21 We observed a substantial decrease in amplitude of motions within segments directly involved in MDM2(2–125) binding, i.e. Oxa13-W23 and W23-Oxa31. Accordingly, rate constants of loop closure slowed from the ∼100-ns to the microsecond time scale. There was evidence for residual chain motions in segments directly involved in MDM2 binding from the presence of submillisecond PET-FCS decays. The nanosecond loop closure kinetics in segments remote from the primary MDM2(2–125) binding site, i.e. Oxa31-W53 and W53-Oxa60, were unaffected. But, there were significant changes in the microsecond chain motions of these remote segments upon MDM2(2–125) binding: The amplitude of the microsecond kinetic phases of Oxa31-W53 and W53-Oxa60 increased, and an additional, slow ∼100-μs phase appeared in both segments. We also attempted to evaluate binding of p53-TAD(1–93) to the Taz1 domain of p300, which was not influenced by any of the tryptophan mutations. However, complex kinetics was observed including the appearance of new microsecond phases that could not be fitted to simple exponentials. The origin of this complex kinetics remained unclear but most likely arose from the presence of multiple binding sites in p53-TAD that recognize the Taz1 domain of p300. A binding equilibrium as origin of complex kinetics can be ruled out because the dissociation constant of the interaction is in the nanomolar range, and experiments were carried out under saturating conditions, i.e. μM p300-Taz1.
Effects of Phosphorylation on Chain Motions within p53-TAD(1–93)
Enzymatic phosphorylation of sites S33, S46, and T81 did not induce any significant global structural changes in p53-TAD(1–93) as judged by far-UV CD spectroscopy (Figure 2). p53-TAD(1–93) displays the spectral characteristics of a random coil, with the CD spectrum recorded after phosphorylation virtually superimposable on that of the wild-type p53-TAD (1–93). But, in PET-FCS experiments, phosphorylation of p53-TAD(1–93) influenced intrachain motions significantly (Figure 3). PET-FCS showed a drop in amplitude of the nanosecond relaxation and correspondingly slower loop closure of segment Oxa31-W53, which contains two phosphorylation sites. The microsecond relaxation in the same segment vanished. Likewise, the amplitude and rate constant of loop closure in the neighboring segment, W23-Oxa31, dropped. Significant changes in loop closure kinetics were also observed in the nanosecond kinetics of segments W53-Oxa60 and Oxa13-W23 (Figure 3), with the latter one remote from sites of phosphorylation. All rate constants of loop closure and corresponding values of phosphorylated p53-TAD(1–93) are summarized in Table 1.
Figure 2.

Far-UV CD spectra of 10 μM p53-TAD(1–93) before (black) and after (gray) phosphorylation of residue side chains S33, S46, and T81 at 15 °C.
Figure 3.

Segmental chain motions in p53-TAD(1–93) and influence of phosphorylation. Top: Sequence as shown in Figure 1. The sites of enzymatic phosphorylation are indicated in bold and as black dots. Middle: Autocorrelation functions (ACFs) recorded from modified p53-TAD(1–93) with and without side chains S33, S46, and T81 phosphorylated. The probed chain segments are color-coded as illustrated in the top sequence and shown in each panel (phosphorylation is indicated as P). The black lines are data fits to a model for a single diffusing species exhibiting up to two monoexponential relaxations. ACFs of the nonphosphorylated constructs are offset along the y-axis for reasons of clarity. Bottom: Plots of the amplitudes of each of the monoexponential submillisecond decays versus the corresponding rate constant of loop closure, kic, calculated from the fitted parameters (Materials and Methods). The color code from the panels above applies. The arrows indicate the observed changes in amplitude and rate constant of the individual relaxations upon phosphorylation. An arrow to the zero-line of amplitude (x-axis) indicates the disappearance of a relaxation. Error bars are propagated standard errors from data fits.
Discussion
The p53-TAD(1–93) is largely unfolded, exhibiting characteristics of a randomly coiled polypeptide. But, the distinct elements of secondary structure visible by NMR spectroscopy in both free and bound p53-TAD(1–93) suggest the presence of dynamic local structure.14,22 Energy transfer experiments and correlation analysis have been used to study the fluctuations in unstructured proteins to reveal hetererogeneous flexibility and dynamics often invisible by conventional bulk spectroscopic methods.15,31,32 The PET-FCS data with p53-TAD(1–93) presented here show that although the p53-TAD(1–93) is flexible, it exhibits significant deviations from random coil behavior in isolation as well as in the presence of MDM2(2–125) binding. The rate constants of loop closure in p53-TAD(1–93) of (1.4–3.6) × 106 s–1 measured for 7–22 residue loop segments were comparable with those measured within the denatured state of a natural protein domain.16,29 But, noninteracting Gaussian chains exhibit purely monoexponential rate constants of contact formation between distinct sites within the chain.33,34 Loop closure kinetics measured for p53-TAD deviated from those expected for a Gaussian chain, since their description required a biexponential decay function. The second exponential, therefore, provided evidence for the presence of nonrandom chain configurations populated within the ensemble of p53-TAD(1–93) conformations, consistent with an earlier single-molecule FRET study.15 The time constant of the second relaxation was slower than nanoseconds, i.e. on the microsecond time scale, and of smaller amplitude. However, the amplitude of the microsecond relaxation was largest in W23-Oxa31, the segment that has nascent helical structure,14,22 and is directly involved in MDM2(2–125) binding.20 Nanosecond to microsecond structural fluctuations in other disordered domains have previously been uncovered by FRET experiments in combination with FCS.32,35
Previous NMR studies identified helical propensities of ∼30% for residues 22–25,14 coinciding with the significant microsecond relaxation in segment W23-Oxa31 observed here. The result suggests this local helical structural element fluctuates at ∼3 μs and corroborates the presence of nascent structure within the chain segment of p53 that is directly involved in MDM2(2–125) binding. We further identified microsecond relaxations of small but significant amplitude in segment Oxa31-W53 that revealed previously unidentified, nonrandom structural fluctuations at that site.
PET-FCS showed residual mobility of chain segments directly bound to MDM2(2–125). The finding is in agreement with results from NMR studies with MDM2(2–125) and the same chain segments bound to domains of p300, and with peak disappearance due to resonance broadening.19,21,23 MDM2(2–125) binding also caused significant changes in the kinetic pattern of loop closure of segments remote from the primary binding site. Binding of MDM2(2–125) to N-terminal segments of p53-TAD(1–93) amplified microsecond relaxations in the neighboring segments as judged by their increased amplitude, indicating enhancement of structural heterogeneity. The additional kinetics may result from weak interactions between TAD2 and MDM2(2–125) or induced structural changes that alter p53 flexibility in this region.5,21 The bound complex thus appears to deviate from a classical lock/key-type rigid body interaction between two proteins, suggested by the traditional structure–function relationship, but instead exhibits dynamic character and structural malleability.
Cellular stress caused by DNA damage triggers a cascade of phosphorylation events in p53 that modulate binding of coactivators and repressors and results in the stabilization and accumulation of p53, leading to cell-cycle arrest and apoptosis.3,7 This multisite phosphorylation has recently been suggested to act as a rheostat enhancing p53 binding to partner proteins in an additive manner.10 Each phosphorylation introduces two negative charges at the site of modification that can directly enhance or diminish interactions within a binding interface by local electrostatic and steric effects. But it is difficult to rationalize how phosphorylation can modulate activity in chain segments remote from the site of phosphorylation. This effect is, in particular, puzzling if the post-translational modification takes place in a largely unfolded protein domain that is expected to lack significant intrachain interactions. Here, we showed that multisite p53-TAD(1–93) phosphorylation has both direct as well as remote effects on p53 flexibility, which are likely to influence p53 regulatory protein interactions. We found slowed kinetics of loop closure in segments 23–31 and 31–53 upon phosphorylation of sites S33, S46, and T81. These changes could arise from repulsive electrostatic forces introduced by negative charges: S33 is in a local neighborhood to V31, which has been modified to contain the fluorophore. The slower kinetics for the 31–53 segment likely reflected the presence of the additional phosphorylation on S46 between V31 and W53. But, we also found allosteric effects in the modulation of chain motions in segments remote from these phosphorylation sites. The amplitudes of loop closure kinetics between residues 13/23 and 53/60 dropped significantly upon phosphorylation of S33, S46, and T81. A decrease in amplitude can be interpreted microscopically. The PET-FCS amplitude a equals kc/ko. kc is the microscopic rate constant of loop closure, and ko is the microscopic rate constant of dissociation of the looped chain segment. The rate constant of loop closure of segments 13–23 and 53–60 remained constant, within error. Therefore, the observed decrease of a reflected an increased rate constant of loop dissociation. The observed effects are difficult to rationalize by repulsive electrostatic interactions introduced by negative charges. Segments 13–23 are close to the N-terminus and outside the sequence area where phosphorylation occurs. Changes in loop closure kinetics can be explained by the presence of transient interaction networks, as evident from the nascent structure in the MDM2(2–125)-binding segment discussed above. Indications for structural changes upon phosphorylation of p53-TAD have been found by Stern–Volmer analysis in Trp fluorescence experiments.36 Fluctuating long-range interactions within p53-TAD(1–93) seem to transmit local structural changes to remote sites within each TAD subdomain, manifested in changes in loop closure kinetics. The transmission of local structural changes, induced through phosphorylation, through transient interaction networks to remote sites within this disordered domain, extends the effector potential of such modifications from local to global.
Materials and Methods
Protein Synthesis and Purification
The p53(1–93) plasmid containing a His6/lipoyl tag has been described previously.23 Briefly, wild type and mutant His6/lipoyl-tagged p53(1–93) was transformed into C41 cells and grown to an OD of 0.8 before addition of IPTG and induction for 16 h at 22 °C. The cells were pelleted and lysed in 50 mM phosphate 200 mM NaCl, 10 mM imidazole pH 7.5 and run on a nickel affinity column. The his lipoyl tag was cleaved with thrombin along with dialysis into 50 mM phosphate 200 mM NaCl pH 7.5. It was applied to a second nickel column and subsequently run on a POROS S. Relevant fractions were concentrated and run on a Superdex 30 gel filtration column. Site directed mutagenesis (Stratagene) was used to generate the phenylalanine and cysteine mutants, and the mutants were purified in a similar manner as the wild type protein. Human MDM2(2–125) was purified as described previously.23
Phosphorylation of p53 (1–93)
To generate phosphorylated material, approximately 1 mL of 1 mM wild type or mutant p53(1–93) was submitted to multiple rounds of phosphorylation in reactions consisting of 100 ng of JNK2α (Millipore) in 25 mM Tris pH 7.4, 150 mM NaCl, 1 mM DTT, 0.2 mM EGTA, 10 mM MgCl2, EDTA-free protease inhibitors (Roche). After phosphorylation, wild type or mutant p53(1–93) was further purified on a C18 column using reverse phase HPLC (Waters 600E) and gel filtration on a Superdex 30 column. The correct molecular weight was confirmed using MALDI mass spectrometry on an Applied Biosystems Voyager DE-RP MALDI TOF mass spectrometer. Phosphorylation of S33, S46, and T81 by JNK2α has been confirmed in NMR experiments.
Protein Labeling
To label the cysteine mutants, approximately 1 mL of 150 μM p53 (1–93) was buffer exchanged into 20 mM Tris pH 7.0 and incubated with 10 mM TCEP and 0.5 mg of AttoOxa11 maleimide or 7-diethylamino-3-(4′-maleimidylphenyl)-4-methylcoumarin (CPM) (in 20 μL acetonitrile) overnight at 4 °C. Excess fluorophore was removed by buffer exchange before purification on a C18 column using a linear 20–70% 0.1%TFA/CH3CN gradient on a Waters 600E HPLC system. Samples were dialyzed overnight at 4 °C in 50 mM MES pH 6.8, 100 mM NaCl, 2.5 mM DTT at 25 °C before PET-FCS experiments.
Circular Dichroism
CD spectra of wild type and phosphorylated p53 (1–93) were performed on a Jasco J-815 CD spectrometer. Samples were dialyzed overnight in 25 mM phosphate pH 6.8, 50 mM NaCl, 1 mM DTE. p53(1–93) (10 μM) was equilibrated for 5 min at 15 °C in a 1 cm quartz glass cuvette before the spectra were taken with the following parameters: 1 nm band-pass, 1 nm increment, 1 s integration, 25 nm/min scan speed. The final spectrum was smoothed using the Savitsky-Golay algorithm (11 points) in the Jasco Spectra Manager software.
PET-FCS Experiments
PET-FCS experiments were performed on a home-built confocal fluorescence microscope setup consisting of a Nikon Eclipse TE2000-U microscope body equipped with a high numerical aperture objective lens (Nikon, Plan Apo VC 60x/1.40 oil) and a He–Ne laser at 633 nm (Melles Griot) as excitation source. The temperature was adjusted to 25 °C using a custom-built objective-type heater. The excitation power was adjusted to 400 μW, low enough to prevent photophysical fluorescence fluctuations in the ACFs, using a neutral density filter. The fluorescence signal of the sample was optically and spatially filtered using a dichroic mirror (Semrock, BrightLine FF 494/540/650), a 150 μm pinhole, and a long-pass cutoff filter (Semrock, RazorEdge 647 nm). A 50% cubic, nonpolarizing beam splitter (ThorLabs) was used to partition photons between two fiber-coupled avalanche photodiode detectors (Perkin-Elmer, SPCM-AQR-15-FC), overcoming detector dead-time and after-pulsing effects. ACFs were recorded in the cross-correlation mode using a digital hardware correlator device (Flex02-01D, Correlator.com). Sample/glass surface interactions in LabTek sample chambers (Nunc) were suppressed by surface passivation using poly-l-lysine hydro bromide (Sigma), together with the use of 0.3 mg/mL BSA and 0.05% Tween-20 as additives in buffered solutions containing 1 nM labeled protein.
PET-FCS Data Analysis
ACFs were fitted to a model for a single molecule diffusing in two dimensions and exhibiting independent chemical relaxations described as a sum of single-exponential decays:37
| 1 |
τ is the lag time, N denotes the average number of molecules in the detection focus, τD is the observed diffusion time constant, and ai and τi,obs denote the amplitude and the observed time constant of the ith relaxation. A two-dimensional diffusion model was of sufficient accuracy, since the horizontal dimensions (x, y) of the detection focus were much smaller than the lateral (z) one. ACFs shown in figures were normalized to N for reasons of clarity. Rate constants of loop closure, ki, were calculated from ai and τi,obs assuming a two-state equilibrium between an open, fluorescent (o) and a closed, fluorescence-quenched (c) conformation:
| 2 |
| 3 |
ko denotes the microscopic rate constant of loop dissociation and kc = ki denotes the microscopic rate constant of loop closure.
Acknowledgments
This work was funded by the Medical Research Council, including MRC Programme Grant G0901534.
Supporting Information Available
Supplemental figures, tables and methods. This material is available free of charge via the Internet at http://pubs.acs.org.
Author Present Address
† Department of Biotechnology & Biophysics, Julius-Maximilians University Würzburg, Am Hubland, 97074 Würzburg, Germany.
Supplementary Material
References
- Laptenko O.; Prives C. Cell Death Differ. 2006, 13, 951–61. [DOI] [PubMed] [Google Scholar]
- Vousden K. H.; Lane D. P. Nat. Rev. Mol. Cell Biol. 2007, 8, 275–83. [DOI] [PubMed] [Google Scholar]
- Kruse J. P.; Gu W. Cell 2009, 137, 609–22. [DOI] [PMC free article] [PubMed] [Google Scholar]
- Candau R.; Scolnick D. M.; Darpino P.; Ying C. Y.; Halazonetis T. D.; Berger S. L. Oncogene 1997, 15, 807–16. [DOI] [PubMed] [Google Scholar]
- Ferreon J. C.; Lee C. W.; Arai M.; Martinez-Yamout M. A.; Dyson H. J.; Wright P. E. Proc. Natl. Acad. Sci. U. S. A. 2009, 106, 6591–6. [DOI] [PMC free article] [PubMed] [Google Scholar]
- Teufel D. P.; Bycroft M.; Fersht A. R. Oncogene 2009, 28, 2112–8. [DOI] [PMC free article] [PubMed] [Google Scholar]
- Bode A. M.; Dong Z. Nat. Rev. Cancer 2004, 4, 793–805. [DOI] [PubMed] [Google Scholar]
- Dai C.; Gu W. Trends Mol. Med. 2010, 16, 528–36. [DOI] [PMC free article] [PubMed] [Google Scholar]
- Lavin M. F.; Gueven N. Cell Death Differ. 2006, 13, 941–50. [DOI] [PubMed] [Google Scholar]
- Lee C. W.; Ferreon J. C.; Ferreon A. C.; Arai M.; Wright P. E. Proc. Natl. Acad. Sci. U. S. A. 2010, 107, 19290–5. [DOI] [PMC free article] [PubMed] [Google Scholar]
- Meek D. W.; Anderson C. W. Cold Spring Harbor Perspect. Biol. 2009, 1, a000950. [DOI] [PMC free article] [PubMed] [Google Scholar]
- Olsson A.; Manzl C.; Strasser A.; Villunger A. Cell Death Differ. 2007, 14, 1561–75. [DOI] [PubMed] [Google Scholar]
- Dawson R.; Muller L.; Dehner A.; Klein C.; Kessler H.; Buchner J. J. Mol. Biol. 2003, 332, 1131–41. [DOI] [PubMed] [Google Scholar]
- Wells M.; Tidow H.; Rutherford T. J.; Markwick P.; Jensen M. R.; Mylonas E.; Svergun D. I.; Blackledge M.; Fersht A. R. Proc. Natl. Acad. Sci. U. S. A. 2008, 105, 5762–7. [DOI] [PMC free article] [PubMed] [Google Scholar]
- Huang F.; Rajagopalan S.; Settanni G.; Marsh R. J.; Armoogum D. A.; Nicolaou N.; Bain A. J.; Lerner E.; Haas E.; Ying L.; Fersht A. R. Proc. Natl. Acad. Sci. U. S. A. 2009, 106, 20758–63. [DOI] [PMC free article] [PubMed] [Google Scholar]
- Teufel D.; Johnson C. M.; Lum J. K.; Neuweiler H. J. Mol. Biol. 2011, 409, 250–262. [DOI] [PubMed] [Google Scholar]
- Bochkareva E.; Kaustov L.; Ayed A.; Yi G. S.; Lu Y.; Pineda-Lucena A.; Liao J. C.; Okorokov A. L.; Milner J.; Arrowsmith C. H.; Bochkarev A. Proc. Natl. Acad. Sci. U. S. A. 2005, 102, 15412–7. [DOI] [PMC free article] [PubMed] [Google Scholar]
- Di Lello P.; Jenkins L. M.; Jones T. N.; Nguyen B. D.; Hara T.; Yamaguchi H.; Dikeakos J. D.; Appella E.; Legault P.; Omichinski J. G. Mol. Cell 2006, 22, 731–40. [DOI] [PubMed] [Google Scholar]
- Feng H.; Jenkins L. M.; Durell S. R.; Hayashi R.; Mazur S. J.; Cherry S.; Tropea J. E.; Miller M.; Wlodawer A.; Appella E.; Bai Y. Structure 2009, 17, 202–10. [DOI] [PMC free article] [PubMed] [Google Scholar]
- Kussie P. H.; Gorina S.; Marechal V.; Elenbaas B.; Moreau J.; Levine A. J.; Pavletich N. P. Science 1996, 274, 948–53. [DOI] [PubMed] [Google Scholar]
- Chi S. W.; Lee S. H.; Kim D. H.; Ahn M. J.; Kim J. S.; Woo J. Y.; Torizawa T.; Kainosho M.; Han K. H. J. Biol. Chem. 2005, 280, 38795–802. [DOI] [PubMed] [Google Scholar]
- Lee H.; Mok K. H.; Muhandiram R.; Park K. H.; Suk J. E.; Kim D. H.; Chang J.; Sung Y. C.; Choi K. Y.; Han K. H. J. Biol. Chem. 2000, 275, 29426–32. [DOI] [PubMed] [Google Scholar]
- Teufel D. P.; Freund S. M.; Bycroft M.; Fersht A. R. Proc. Natl. Acad. Sci. U. S. A. 2007, 104, 7009–14. [DOI] [PMC free article] [PubMed] [Google Scholar]
- Vise P.; Baral B.; Stancik A.; Lowry D. F.; Daughdrill G. W. Proteins 2007, 67, 526–30. [DOI] [PubMed] [Google Scholar]
- Vise P. D.; Baral B.; Latos A. J.; Daughdrill G. W. Nucleic Acids Res. 2005, 33, 2061–77. [DOI] [PMC free article] [PubMed] [Google Scholar]
- Sakaguchi K.; Saito S.; Higashimoto Y.; Roy S.; Anderson C. W.; Appella E. J. Biol. Chem. 2000, 275, 9278–83. [DOI] [PubMed] [Google Scholar]
- Bielska A. A.; Zondlo N. J. Biochemistry 2006, 45, 5527–37. [DOI] [PubMed] [Google Scholar]
- Neuweiler H.; Doose S.; Sauer M. Proc. Natl. Acad. Sci. U. S. A. 2005, 102, 16650–5. [DOI] [PMC free article] [PubMed] [Google Scholar]
- Neuweiler H.; Johnson C. M.; Fersht A. R. Proc. Natl. Acad. Sci. U. S. A. 2009, 106, 18569–18574. [DOI] [PMC free article] [PubMed] [Google Scholar]
- Neuweiler H.; Banachewicz W.; Fersht A. R. Proc. Natl. Acad. Sci. U. S. A. 2010, 107, 22106–22110. [DOI] [PMC free article] [PubMed] [Google Scholar]
- Lee J. C.; Langen R.; Hummel P. A.; Gray H. B.; Winkler J. R. Proc. Natl. Acad. Sci. U. S. A. 2004, 101, 16466–71. [DOI] [PMC free article] [PubMed] [Google Scholar]
- Ferreon A. C.; Gambin Y.; Lemke E. A.; Deniz A. A. Proc. Natl. Acad. Sci. U. S. A. 2009, 106, 5645–50. [DOI] [PMC free article] [PubMed] [Google Scholar]
- Krieger F.; Fierz B.; Bieri O.; Drewello M.; Kiefhaber T. J. Mol. Biol. 2003, 332, 265–74. [DOI] [PubMed] [Google Scholar]
- Neuweiler H.; Lollmann M.; Doose S.; Sauer M. J. Mol. Biol. 2007, 365, 856–69. [DOI] [PubMed] [Google Scholar]
- Mukhopadhyay S.; Krishnan R.; Lemke E. A.; Lindquist S.; Deniz A. A. Proc. Natl. Acad. Sci. U. S. A. 2007, 104, 2649–54. [DOI] [PMC free article] [PubMed] [Google Scholar]
- Kar S.; Sakaguchi K.; Shimohigashi Y.; Samaddar S.; Banerjee R.; Basu G.; Swaminathan V.; Kundu T. K.; Roy S. J. Biol. Chem. 2002, 277, 15579–85. [DOI] [PubMed] [Google Scholar]
- Krichevsky O.; Bonnet G. Rep. Prog. Phys. 2002, 65, 251–97. [Google Scholar]
Associated Data
This section collects any data citations, data availability statements, or supplementary materials included in this article.