

Abstract
Light intensity is an important determinant of diverse physiological and behavioral responses within the non-image-forming visual system. Thresholds differ among various photic responses, namely control of circadian rhythms, vigilance state, activity level and pupil constriction, but the mechanisms that regulate photosensitivity are not known. Calbindin D28k (CalB) is a calcium-binding protein associated with light processing in the mammalian circadian clock. Loss-of-function studies indicate that CalB-deficient mice (CalB−/−) have deficits in their ability to entrain to light–dark cycles. To explore the role of CalB in modulating photosensitivity, thresholds for three behaviors mediated by the non-image-forming visual system (entrainment, masking and pupillary light reflex; PLR) were compared in CalB−/− and wildtype mice, and the localization of CalB protein in these circuits was examined in adult and juvenile mice. The results reveal a divergence in how CalB affects thresholds to photic cues among these responses. Entrainment and masking were 40- to 60-fold less sensitive in CalB−/− than in wildtype mice. On the other hand, the PLR in CalB−/− mice was 80-to 200-fold more sensitive. Though CalB is expressed in the retina and in brain circuits regulating entrainment we found no CalB expression in any component of the PLR pathway, namely the olivary pretectal nucleus, Edinger–Westphal nucleus and ciliary ganglion. The behavioral and anatomical data together suggest that, in normal animals, the retinal response to light is blunted in the presence of CalB, but responsiveness of the higher order processes that transduce afferent retinal input is enhanced.
Keywords: circadian rhythms, entrainment, masking, mouse, pupillary reflex
Introduction
Light alters many aspects of physiology and behavior, including circadian rhythms, activity level, vigilance state and pupil size. These adaptive responses all engage the non-image-forming visual system, which detects irradiance and modulates function of the circadian system, pupillary light reflex (PLR) and masking. Circadian rhythms are coordinated by a clock in the suprachiasmatic nucleus (SCN) of the hypothalamus, are entrained by light and are sensitive to light intensity (Aschoff, 1960; Stephan & Zucker, 1972). Pupil size, too, is determined by light intensity and is generally insensitive to rod and cone adaptation (Zhu et al., 2007), while masking reflects the acute effect of light on locomotor activity (Hattar et al., 2003). These responses all differ in their thresholds (Butler & Silver, 2011). The object of the present study is to understand the basis of these differences in threshold of irradiance detection.
The Ca2+ binding protein calbindin D28k (CalB) is highly expressed in the retina, including in the melanopsin-containing retinal ganglion cells which are critical for non-image-forming vision (Haverkamp & Wässle, 2000; Güler et al., 2008; Kriegsfeld et al., 2008). CalB affects the acute and tonic responses of cells to excitatory stimuli, contributes to intracellular Ca2+ buffering, modulates the shape of synaptic calcium transients and protects against Ca2+-dependent excitotoxicity (Airaksinen et al., 1997; Rintoul et al., 2001; Schmidt et al., 2003). CalB-containing SCN neurons are of considerable interest with regard to photosensitivity. CalB is expressed in the subset of SCN neurons that is directly retinorecipient in hamsters and similarly expressed in the mouse SCN during development (Silver et al., 1996; Ikeda & Allen, 2003). The amount of CalB in the SCN increases in constant darkness and decreases in constant light (LeSauter & Silver, 1999; Yamazaki et al., 2002; Kriegsfeld et al., 2008; Drouyer et al., 2010). Finally, CalB antisense oligonucleotides dose-dependently inhibit light-induced phase shifts in circadian rhythms, showing a direct role for CalB in the circadian system’s response to light (Hamada et al., 2003).
Mice with a targeted mutation of the CalB gene (CalB−/−) show deficits in entrainment possibly associated with altered photosensitivity (Kriegsfeld et al., 2008). When wildtype mice are released from light–dark cycles into constant darkness (DD), they begin activity at the point of prior lights off. In contrast, when CalB−/− mice are released into DD, onset phases are widely distributed and shifted towards earlier activity onset during what had previously been lights-on (Kriegsfeld et al., 2008). In mammals, the phase angle of entrainment varies with light intensity in a systematic way, with activity onset occurring earlier in dim than in bright light (Pohl, 1976; Wright et al., 2005). Thus the behavior of CalB−/− animals is consistent with reduced responsiveness of the circadian system to light.
To understand the role of CalB in determining threshold of responses to light in the non-image-forming visual system we established irradiance–response relationships for entrainment, masking and PLR, three functions associated with different CNS pathways. We then examined these circuits for CalB expression to determine potential sites of action.
Materials and methods
Animals and housing
Male wildtype mice (C57Bl/6; Charles River, Wilmington, MA, USA) and CalB−/− mice bred locally were age-matched and housed individually with access to running wheels (entrainment and masking experiments) or group-housed two to four per cage (PLR experiments) in clear polycarbonate cages (32 × 14 × 13 cm, on pine shavings, and 29 × 19 × 13 cm, on corn cob bedding, respectively). CalB−/− mice on a mixed C57BL6/129Sv background, originally produced in the laboratory of Dr Michael Meyer (Max Planck Institute of Neurobiology, Germany; Airaksinen et al., 1997), were obtained from Dr Sylvia Christakos (Department of Biochemistry and Molecular Biology, New Jersey Medical School, USA). The founders were crossed with C57Bl/6 mice and bred in our laboratory. Food (LabDiet 5001; PMI Nutrition, Brentwood, MO, USA) and water were available ad libitum. Room temperature was maintained at 21 ± 2 °C, and environmental noise was masked by white noise (76 dB SPL). Genotypes were determined by PCR on an Eppendorf Mastercycler Gradient (Hamburg, Germany) using genomic DNA from either tail clips or ear punches using Sigma REDExtract-N-Amp tissue PCR kit (Sigma, St Louis, MO, USA) with a common primer Cs3 (5′-GCAAGTAACTAATGGCATCG-3′), wildtype primer C2 (5′-TGCAGCGGCTAGTTTGAGAGTG-3′) and mutant primer Pa1 (5′-TGACTAGGGGAGGAGTAGAAG-3′), and cycling set to: 95 °C for 2 min (1 cycle), 95 °C for 45 s, 55 °C for 45 s, 72 °C for 2 min (35 cycles) and 72 °C for 10 min (1 cycle), and held at 4 °C. PCR products were separated on agarose gels and visualized with ethidium bromide: wildtype bands are 753 bp and CalB−/− bands are 226 bp (Kriegsfeld et al., 2008).
Light was provided by an array of green LEDs (see Butler & Silver, 2011; peak wavelength 524 nm, half-maximal width 47 nm, mean dominant wavelength 518 nm, HLMP-AM01-Q00zz; Avago Technologies, San Jose, CA, USA) on the ceiling of each housing shelf. Irradiance and photopic illuminance were measured 4 cm from the cage floor (IL1700; International Light Technologies, Peabody, MA, USA). Irradiance was converted and reported as log photon flux [log(photons/cm2/s)]. For the highest intensity used for masking, the green lights were supplemented with white LEDs (570 lux : ~300 lux from the white light; an equivalent log photon flux of 14.4 was estimated by calculating the intensity of green light necessary to produce 300 lux). For control animals, entrainment and masking thresholds (shown here in Figs 1A and B, and 2C) have previously been reported (Butler & Silver, 2011). All procedures were approved by the Institutional Animal Care and Use Committee of Columbia University.
Fig. 1.
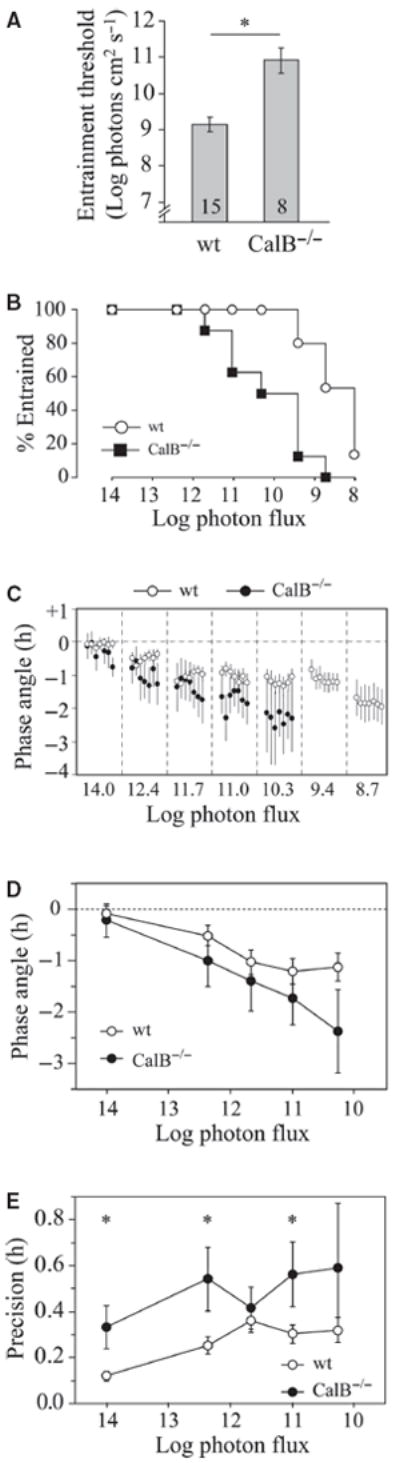
Entrainment threshold and phase angle. (A) Mean entrainment thresholds (± SEM) are shown for wildtype (wt) and CalB−/− mice (n in bars). *t-test, P < 0.001. (B) Survival plot shows % mice entrained at each step. (C) Mean phase angles (± SEM) of entrained mice are shown for the last week of data at each irradiance step. Lights-off is set at 0, and different light intensities separated by vertical dotted lines. Values of n by intensity step: wildtype, 13, 13, 13, 14, 14, 11, 7; CalB−/−, 6, 8, 7, 5, 4, 0, 0. (D) Phase angle of entrained mice over the last 7 days of each intensity step. Though there were significant main effects of light intensity and genotype, there were no significant pairwise differences at any particular irradiance. Note that the larger SEMs in CalB−/− mice are due in part to smaller sample sizes (n as in C). (E) Precision of entrained mice (SD of onset residuals) at each intensity step (n as in C). *Tukey test, P < 0.05.
Fig. 2.
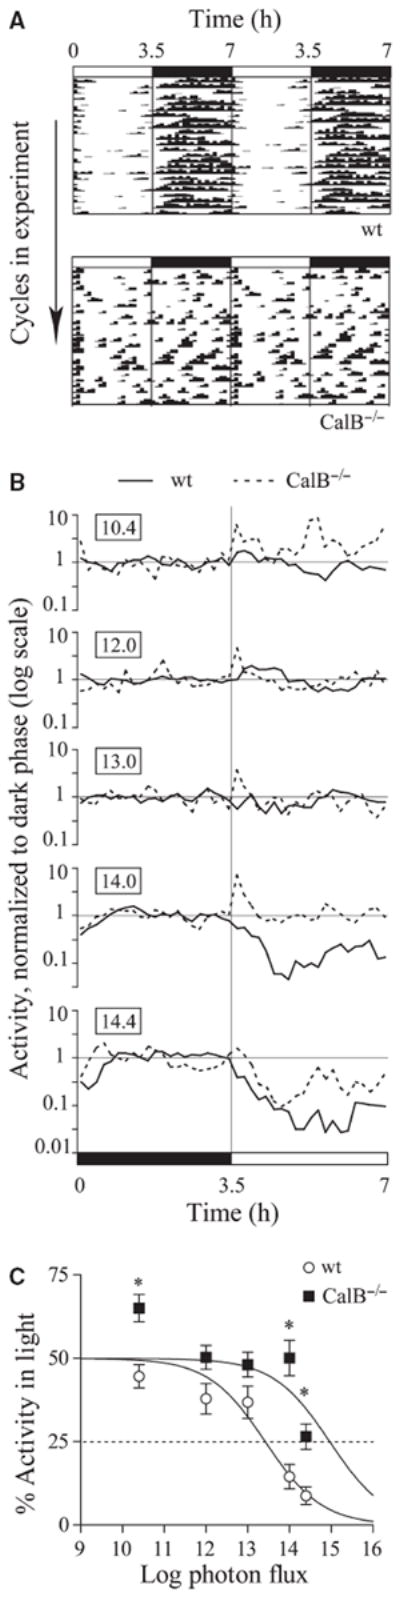
Masking behavior and threshold. (A) Actograms show wheel-running patterns for a representative wildtype (wt) and CalB−/− mouse at log photon flux 14. Wheel running is represented by hatch marks along each line; consecutive 3.5L : 3.5D cycles are double-plotted and proceed down the actogram. The light–dark cycle is shown by the white and black bars at the top. (B) Average activity profiles are normalized to dark-phase activity level and plotted on a log scale. Boxed numbers indicate light intensity in units of log photon flux. Note that CalB−/− mice displayed a transient increase in activity at lights-on, also observable in the actogram. (C) The degree of masking is plotted for each light intensity and fitted by logistic intensity–response curves. Note that CalB−/− mice showed significant positive masking in the dimmest light tested. *P < 0.05 between genotypes, Tukey test. Wildtype, n = 16; CalB−/−, n = 11.
Wheel-running measurements
Entrainment in a 12 : 12-h light: dark cycle was assessed as previously described (wildtype, n = 15; CalB−/−, n = 8; Butler & Silver, 2011). Briefly, wheel running activity was monitored remotely by Vitalview (Minimitter, Bend, OR, USA), with counts collected in 10-min bins and plotted in actograms. Daily onset of activity bouts were calculated by ClockLab (Actimetrics, Wilmette, IL, USA). When necessary, these were adjusted to the first bout in which mice were active for 40 of the 60 min following a stretch of 4 h with activity in < 20% of the bins; this algorithm was restricted to intervals 20–26 h after the previous onset. Every 2–4 weeks, the time of lights-off was advanced by 2 h and the intensity of the light phase dimmed. Entrainment thresholds were determined for each mouse and were defined as the dimmest light intensity to which the mouse was entrained with a stable phase angle relative to lights-off. Phase of entrainment was defined as the average onset time relative to lights-off over the last 7 days of a light intensity step. Precision of a mouse’s running was defined by the SD of the onset residuals compared to a best-fit regression line.
Mice previously used in the entrainment experiment or co-housed in the same conditions (wildtype, n = 16; CalB−/−, n = 11; these include one wildtype and three mutant mice for whom entrainment data could not be obtained due to equipment problems) were housed in a 3.5 : 3.5-h light : dark cycle to which they cannot entrain (Mrosovsky & Hattar, 2003). Mice were housed in these conditions for 1 week at each of five light intensities to determine the amount of masking and the pattern of activity across the light phase. Activity profiles over the 1 week were first normalized to mean activity level during the dark. Negative masking is defined as acute suppression of activity by light and positive masking is defined as acute induction of activity by light.
Pupil measurements
PLR was tested in dark-adapted unanesthetized mice in the mid-subjective day (wildtype, n = 10; CalB−/−, n = 9; Lucas et al., 2001). The mice were held by the scruff for video recording under infrared light (DCR-DVD610; Sony, San Diego, CA, USA) with a macro converter lens (DVS-WA45-30M; B&H, New York, NY, USA), and the eye was illuminated with a single LED ~10 cm distant (peak wavelength, half-maximal width and mean dominant wavelength, respectively: blue, 470, 22 and 470 nm; green, 520, 35 and 517 nm; red, 632, 20 and 626 nm; UniqueLEDs.com, Oklahoma City, OK, USA; Butler and Silver, 2011). Stills were extracted from the video files and pupil area measured in ImageJ. The direct pupil response was not adjusted for changes in retinal irradiance due to pupil constriction.
Pharmacology
To determine whether changes in PLR to light were due to defects in iris function, constriction and dilation were tested with carbachol and atropine, respectively. After dark adaptation for at least 1 h in the mid-day, pupil size was measured before and 5 min after topical application of carbachol [carbamylcholine chloride; Sigma C-4382, 1 m in 0.1 m phosphate-buffered 0.9% saline (PBS), pH 7.4, filtered through a 0.22-μm filter (Lucas et al., 2003)]. On a different day using the same protocol, dilation was measured in response to topical administration of 0.22-μm filtered 1% atropine sulfate in PBS (MP Biomedicals, 215100, Solon, OH, USA; Mure et al., 2007).
Histology
Mice were anesthetized with an overdose of pentobarbital (200 mg/kg, i.p.) and then perfused transcardially with 0.9% saline followed by fresh 4% paraformaldehyde in 0.1 m phosphate buffer (PB; pH 7.4) for adult mice and 4% paraformaldehyde and 15% picric acid in PB for mice at postnatal day (P)8. Brains and eye-cups with retinae were removed, post-fixed overnight, cryoprotected in 20% sucrose in PB and then sectioned on a cryostat. For brain, free-floating 40 μm (50 μm for P8) sections were washed in PB with 0.1% triton X (0.1PBT), blocked in 2% normal donkey serum in PB with 0.3% triton X (0.3PBT) and then incubated for 48 h at 4 °C in the same solution with primary antibodies. After the primary antibody step, sections were washed in 0.1PBT and then incubated with the appropriate secondary antibodies in 0.3PBT for 2 h at room temperature. Sections were then finally washed in 0.1PBT and PB, mounted on gelatin-subbed slides, dehydrated through alcohols, cleared in xylenes and cover-slipped with Krystalon (EMD Chemicals, Gibbstown, NJ, USA). Eyes and the surrounding musculature from perfused adults were embedded in 12% gelatin and post-fixed again overnight in 4% paraformaldehyde with 20% sucrose. Vertical sections (20 μm) were cut on a cryostat, thaw-mounted on Superfrost Plus slides and then treated immunohistochemically as above but with an overnight primary antibody incubation at room temperature.
To identify the olivary pretectal nucleus (OPN) and ciliary ganglion, mice were injected intra-ocularly in one eye with the tracer cholera toxin β (CTβ, 10 μg/μL in ddH2O, 0.22 μm filtered; List Biological Laboratories, Campbell, CA, USA) under isoflurane anesthesia, with buprenorphine injected s.c. for analgesia (0.5 mg/kg). The mice were perfused 72 h after injection. To identify the Edinger–Westphal nucleus (EW), sections were processes for cocaine- and amphetamine-regulated transcript (CART) immunoreactivity (Kozicz, 2003). To aid in structure identification, oculomotor and short ciliary nerves were stained on alternate sections with 0.5% silver nitrate overnight.
Antibodies
Immunohistochemistry was performed with the following primary antibodies: mouse monoclonal anti-CalB (1 : 20 000, 1 : 10 000 for retina, no. C-9848; Sigma), goat anti-choleragenoid (1: 3000; no. 703, List Biological Laboratories) and rabbit anti-CART (1 : 40 000; no. H-003-62, Phoenix Pharmaceuticals, Burlingame, CA, USA). There was no CalB immunoreactivity in CalB−/− mice. Secondary antibodies made in donkey and conjugated to the fluorescent dyes Cy2 or Cy3 were used at 1 : 200 (Jackson Laboratories, West Grove, PA, USA).
Image analysis
Images were captured with a Nikon Eclipse E800 epifluorescent microscope (Nikon, Tokyo, Japan) equipped with a cooled CCD camera (Retiga Exi; Q-Imaging, Surrey, Canada), using Q-capture Pro software (Q-Imaging). Sections were excited and emission filtered using filter cubes for FITC and for Cy3. Images were adjusted for brightness and contrast, and stacks pseudocolored in Photoshop (Adobe Systems, Mountain View, CA, USA).
Statistics
Differences between groups were assessed with t-tests or standard or repeated-measures anova followed by post hoc Tukey tests. Entrainment thresholds across the light intensity steps were analyzed by log-rank survival tests (Mantel–Cox, Statview; SAS Institute, Inc., Cary, NC, USA). Intensity response relationships were fitted by a four-parameter logistic function the form where x = log(irradiance), y = response, a = minimum response, b = maximum response, c = half-maximal intensity (I50) and d = Hill slope (Prism; GraphPad Software, La Jolla, CA, USA). Maximum values were constrained to 100% for entrainment and PLR and 50% for masking. Minimum values were constrained to 0% for entrainment and masking and 5% for PLR (minimum observed pupil size). Hill slope was constrained to be shared across genotype. The means and SDs for the PLR half-maximal intensities at each wavelength were used in a Monte Carlo simulation to determine the best fit Govardovskii Vitamin A-1 template, invariant over λmax/λ, to the relative spectral sensitivity data as described previously (Govardovskii et al., 2000; Butler & Silver, 2011). Briefly, the mean and SD were used to generate random sample sets with n according to our data (wildtype, n = 10; CalB−/−, n = 9). For each sample set, the best-fit Govardovskii template tested in 1-nm increments from 470 to 530 nm was determined by the method of least squares using Microsoft Excel (Redmond, WA, USA). These produced a histogram of template peak wavelengths from which mean, SD and confidence interval could be obtained. SEMs are plotted throughout. Significance is set at P < 0.05.
Results
A threshold of entrainment was determined for each mouse, defined as the lowest intensity to which the mouse entrained before subsequently free-running upon further dimming of the light. As measured by entrainment, CalB−/− mice were less sensitive to light, by 1.8 log units, than wildtype (Fig. 1A; t21 = 4.8, P < 0.001). CalB−/− began to free-run at significantly brighter intensities (Fig. 1B; survival analysis: log-rank (Mantel–Cox) test, χ2 = 14.7, df = 1, P < 0.001). As expected, reduced photosensitivity was associated with earlier phase angles of entrainment in entrained CalB−/− mice at each step (Fig. 1C and D; intensity effect, F4,82 = 5.7, P < 0.001; genotype effect, F1,82 = 5.9, P < 0.05; interaction, F4,82 = 0.6, P = 0.68). Individual CalB−/− mice were much less precise than wildtype counterparts (Fig. 1E; intensity effect, F4,82 = 2.3, P = 0.06; genotype effect, F1,82 = 17.8, P < 0.001; interaction, F4,82 = 0.8, P = 0.54). Nevertheless, the population variability in phase observed in Fig. 1D did not differ at any light intensity (F-test, P > 0.05).
Masking is defined as the acute suppression of locomotor activity (negative) by bright light, or induction of activity (positive) by dim light, relative to the amount of activity in darkness (Mrosovsky, 1999). Wildtype mice had a lower response threshold than CalB−/− mice as measured by masking (Fig. 2). At all light intensities that elicited masking, activity was consolidated within the dark periods in wildtype mice to a greater degree than that seen in CalB−/− mice (Fig. 2A). The activity profiles in Fig. 2B show that wildtype mice showed either little masking at the three lower intensities or substantial negative masking at the two highest. In contrast, CalB−/− mice showed positive masking at the dimmest intensity and only partial negative masking at the highest intensity. CalB−/− mice showed a notable acute spike in activity when the lights turned on at all intensities. Overall, the pattern of masking as a function of light intensity differed between genotypes (Fig. 2C; repeated-measures anova: genotype effect, F1,20 = 16.8; intensity effect, F4,80 = 25.0, interaction, F4,80 = 4.7, all P < 0.01). There were significant differences at the lowest and two highest light intensities (Tukey test, P < 0.05). Half-maximal intensities were derived from irradiance–response plots (Fig. 2C), and were significantly higher in CalB−/− than wildtype mice (wildtype, 13.4 ± 0.15; CalB−/−, 15.0 ± 0.29; F1,139 = 122.8, P < 0.001, logistic coefficients: a = 0, b = 50, d = −0.64).
Although CalB−/− mice were less sensitive to light as measured by entrainment and masking, they had significantly greater pupil constriction during a 1-min pulse of green light (Fig. 3A; genotype, F1,14 = 16.4, P = 0.001; time, F12,168 = 30.5, P < 0.001; genotype × time, F12,168 = 5.7, P < 0.001). After the initial transient over the first 200 ms, wildtype pupils began to dilate while CalB−/− pupils continued to constrict slowly. A stable constriction was achieved by 10 s, so this time point was used in subsequent irradiance–response tests. As measured by the intensity necessary to elicit half-maximal PLR (I50) CalB−/− mice were more sensitive to light than wildtype mice (Fig. 3B–D; blue, F1,130 = 132, P < 0.001; green, F1,164 = 138, P < 0.001; red, F1,125 = 206, P < 0.001). The CalB−/− I50 was always lower than in wildtype mice by 1.9–2.3 log units.
Fig. 3.
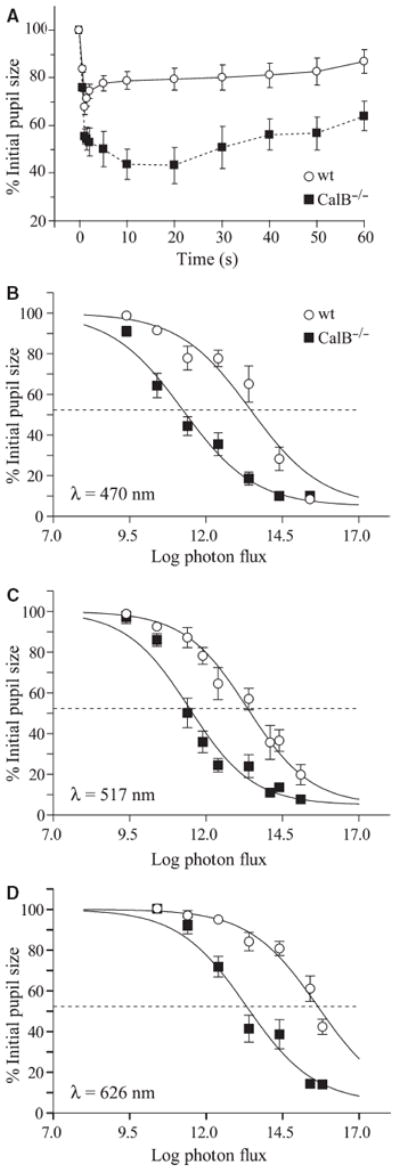
Pupil response to light. (A) Steady-state pupil area was achieved by 10 s in response to a 1-min pulse of 517-nm light (log photon flux = 12.4). Pupil size in CalB−/− mice was significantly smaller at all but the first two time points compared to wildtype (Tukey test, P < 0.05; wt, n = 8; CalB−/−, n = 7). (B–D) Intensity–response curves for wildtype and CalB−/− mice at the wavelengths indicated. The half-maximal pupil constriction is indicated by the dotted line (wildtype, n = 10; CalB−/−, n = 9; logistic coefficients: a = 5, b = 100, d = −0.40 to −0.42 for all wavelengths).
PLR photosensitivity differed between genotypes, but the relative spectral sensitivity indicates a cone-mediated process in both (Fig. 4). The means and SDs for the PLR I50 at each wavelength were used in Monte Carlo simulations to determine the best-fit Govardovskii Vitamin A1 template and its confidence interval. Wildtype PLR data were best fitted by a relative spectral sensitivity function with peak at 506 nm (95% confidence interval, 500–512 nm). CalB−/− PLR data were best fitted by a template with peak at 509 nm (95% confidence interval 502–517 nm). These spectral sensitivity functions did not differ between genotypes (t17 = 1.93, P = 0.07). The confidence intervals for both genotypes contain the peak sensitivity for the murine cone but not the rod (Fig. 4).
Fig. 4.
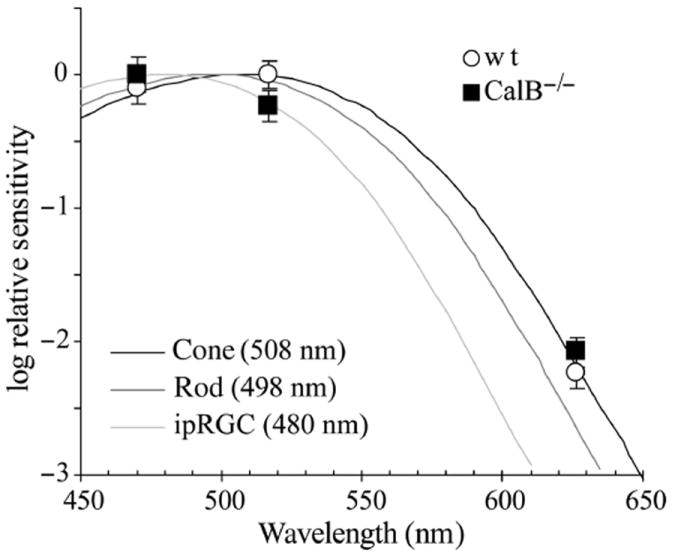
Relative spectral sensitivity. Relative half-maximal intensities (± SEM) for each wavelength from Fig. 3 are plotted for each genotype. Also plotted are Govardovskii vitamin A1 templates for the cone, rod and intrinsically photosensitive retinal ganglion cell (ipRGC; peak wavelengths for each shown in parentheses; Bowes et al., 1990; Sun et al., 1997; Govardovskii et al., 2000; Panda et al., 2005).
The greater constriction to light in CalB−/− mice is not attributable to iris hyperresponsiveness as they showed less pharmacologically induced constriction than wildtypes, albeit more than to light (0.5 vs. 0.7% of initial pupil size in wildtype and CalB−/− mice, respectively; t17 = 3.6, P < 0.01). Furthermore, atropine-induced dilation did not differ between genotypes (118 and 110% in wildtype and CalB−/−) mice, respectively; t16 = 1.5, P = 0.14).
Whether CalB increased or decreased sensitivity was not determined by the light intensity at which the responses were measured (Fig. 5). Both entrainment and masking were more sensitive in wildtype mice, and this occurred at both brighter and dimmer light intensities than for PLR.
Fig. 5.
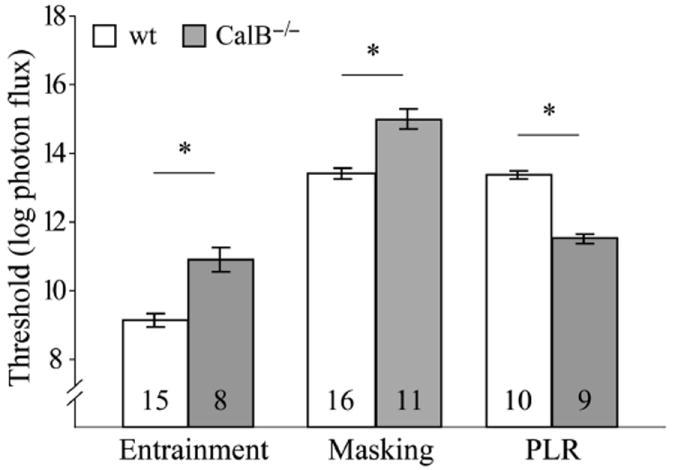
Behavioral thresholds (mean entrainment threshold or half-maximal intensities for masking and PLR; see Figs 1-3) differed between genotypes (*P < 0.05). Sample sizes are shown within bars.
To determine possible sites where CalB alters photosensitivity, CalB expression in the underlying circuits was examined in adult and P8 mice, a time of high CalB expression in the retinorecipient SCN (Kriegsfeld et al., 2008). The direction of the effect of CalB on photosensitivity depended on what was being measured despite a common CalB-expressing component in the retina. This suggested that differences in the sign of the response might rest in different CalB expression patterns in the underlying brain circuits. CalB expression in SCN and intergeniculate leaflet (IGL) is well documented (Silver et al., 1999; Grubb & Thompson, 2004). In contrast, there is no evidence for CalB expression in the PLR circuitry beyond the retina. There was no detectable CalB immunoreactivity in the OPN in adulthood or at P8 (Fig. 6A–E). Similarly, there was negligible CalB immunoreactivity in the EW (Fig. 6F–I and K–N). The cortex displayed robust neuronal staining and served as positive control (Fig. 6J and O). In gross silver-stained preparations, the ciliary ganglion was identified as an ovoid body from which the short ciliary nerves emanate (Kuder, 1986). There was no evidence for CalB expression in ganglion cell bodies, identified by their cytoplasmic concentration of CTβ injected into the ipsilateral eye (Fig. 6Q–S). CalB immunoreactivity was normal in the retina (Fig. 6T). A summary schematic shows the CalB expression patterns within the circuits mediating entrainment and PLR (Fig. 7).
Fig. 6.
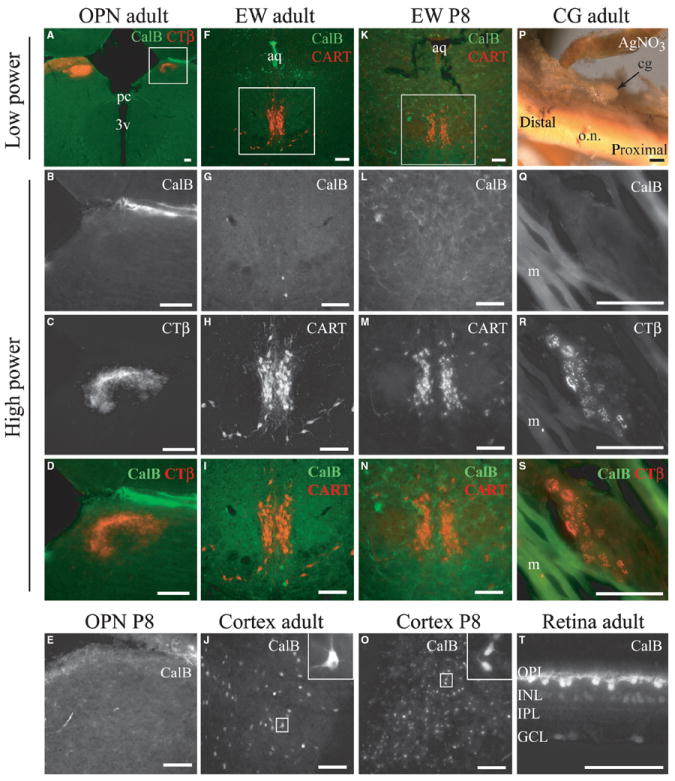
CalB expression in non-image-forming circuits. (A–D) OPN in adult mouse. (E) OPN in a P8 mouse. (F–I) EW in an adult mouse. (J) Immunoreactive CalB cells in cortex are a positive control for adult brain tissue (same tissue section as A–D). (K–N) EW in a P8 mouse. (O) Immunoreactive CalB cells in cortex from tissue section shown in K–N. (P) Gross preparation of the back of the eye showing optic nerve and ciliary ganglion. (Q–S) Sections through the ciliary ganglion show concentration of ocularly injected CTβ in cell bodies, but no CalB expression. Running beside the ciliary ganglion are muscle fibers. (T) Immunoreactive cells in retina verify normal staining in eye sections (e.g., Haverkamp & Wässle, 2000). In all columns, the fourth row is the overlay of the sequentially excited Cy2 and Cy3 signals shown in the second and third rows. Abbreviations: 3v, 3rd ventricle; aq, aqueduct; cg, ciliary ganglion; m, muscle fibers; o.n., optic nerve; pc, posterior commissure; OPL, outer plexiform layer; INL, inner nuclear layer; IPL, inner plexiform layer; GCL, ganglion cell layer. Scale bars, 100 μm.
Fig. 7.
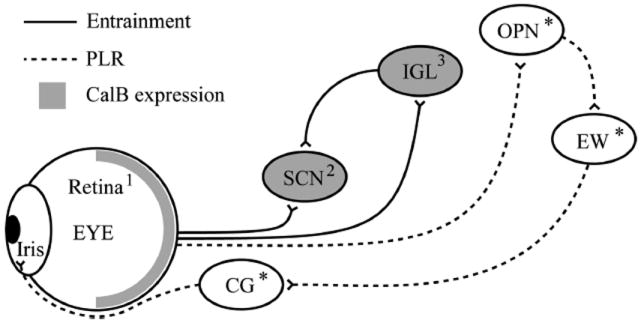
Schematic of non-image-forming circuits. The pathways for entrainment and PLR are shown together with areas expressing CalB (grey) or not (white). Circuits underlying masking are not known. The iris was not examined. *Areas examined in this work. Numbers refer to results in the literature: 1, Haverkamp & Wässle, 2000; 2, Ikeda & Allen, 2003; ; 3, Grubb & Thompson, 2004.
Discussion
The present findings show an important role for CalB in controlling photosensitivity in the non-image-forming visual system. At the level of behavior, loss of CalB reduced photoresponsiveness 60-fold as measured by entrainment and 40-fold as measured by masking, but increased photoresponsiveness > 80-fold as measured by PLR. Reduced circadian sensitivity in CalB−/− mice altered the pattern of entrainment and was associated with earlier activity onset. At the anatomical level, these findings are consistent with the observations that CalB is expressed in retina and SCN but not in components of the PLR pathway, in either adult or juvenile mice. The anatomical and behavioral data together suggest distinct effects of CalB on various non-image-forming visual functions (see schematic in Fig. 7).
The entrainment circuitry includes the retina, SCN and IGL (Morin & Allen, 2006), and CalB is expressed in all three compartments (Haverkamp & Wässle, 2000; Ikeda & Allen, 2003; Grubb & Thompson, 2004; Kriegsfeld et al., 2008). The SCN subregion containing CalB cells is particularly critical for rhythmicity in hamsters – partial SCN lesions abolish circadian rhythms only if they fully destroy this part of the nucleus, irrespective of whether substantial remaining parts of the nucleus have survived ablation. SCN transplants restore circadian rhythms only if they include CalB-immunoreactive cells (LeSauter & Silver, 1999; Kriegsfeld et al., 2004). The IGL may also play a role in determining circadian photosensitivity as shown by illuminance coding by IGL neurons (Harrington & Rusak, 1991) and changes in phase angle in mice that lack the major IGL-to-SCN signal, neuropeptide Y (Kim & Harrington, 2008).
Masking also requires photoreception by the retina, but the rest of the circuit sustaining this response is unknown as masking is preserved after lesions of multiple visual areas (Mrosovsky, 1999; Morin & Allen, 2006). The role, if any, of the SCN is unclear for reports of the consequences of SCN lesions are contradictory (Redlin et al., 1999; Li et al., 2005).
PLR is mediated by a loop comprised of the retina, OPN, EW and ciliary ganglion (Berson, 2003). CalB was not detected in any component downstream of the retina, so CalB appears to modulate the photosensitivity of PLR at the retina. Together, these findings from entrainment, masking and PLR reveal a dichotomous role of CalB in non-image-forming vision, with deletion of CalB increasing sensitivity at the retina and decreasing photoresponsiveness in downstream targets that mediate entrainment and masking.
PLR sensitivity was enhanced by the CalB mutation and the site of action is probably the inner retina, which expresses CalB. The spectral sensitivity indicated that cones play the primary role in driving PLR in both genotypes, and there was no detectable contribution from melanopsin. Nevertheless, the subset of retinal ganglion cells that express melanopsin remain a candidate site of action, independent of their intrinsic phototransduction, for these cells express CalB (Kriegsfeld et al., 2008) and ablation of these cells eliminates or reduces PLR (Güler et al., 2008; Hatori et al., 2008). There are multiple types of melanopsin-containing retinal ganglion cells and these differ in their melanopsin immunoreactivity, morphology and projection patterns to non-image-forming visual areas (Ecker et al., 2010). It will be important in future work to determine whether CalB is systematically expressed in particular types of intrinsically photosensitive retinal ganglion cells.
The enhanced positive masking in dim light seen in CalB−/− compared to wildtype mice may also point to retinal modulation of rod and cone signals. Masking is determined by a balance between negative masking mediated by melanopsin and positive masking mediated by rods and cones. Positive masking is abolished in rodless and coneless mice and enhanced in melanopsin-knockout mice (Mrosovsky et al., 1999; Mrosovsky & Hattar, 2003; Thompson et al., 2008). Therefore, greater positive masking in CalB−/− mice may indicate that they have increased relative photosensitivity of rods and cones compared to melanopsin-containing intrinsically photosensitive retinal ganglion cells.
The decreased circadian photosensitivity measured by entrainment may be due to either the chronic absence of CalB through development or to its acute absence in adulthood (Ciarleglio et al., 2011). CalB is observed in the SCN of many species, including humans, non-human primates, and Cricetid and Murid rodents, with species differences in the spatial pattern of expression (Mai et al., 1991; Silver et al., 1999; Mahoney et al., 2000; Cayetanot et al., 2007). In mouse SCN, CalB is highly expressed in the retinorecipient core region during the time of retinal innervation during development and in the shell region in the adult (Silver et al., 1999; Ikeda & Allen, 2003; Sekaran et al., 2005; Kriegsfeld et al., 2008). CalB expression is also found in the retina across a broad range of taxa (Pasteels et al., 1990). In contrast, we found no evidence of CalB expression in the OPN or EW circuitry regulating PLR, in either juveniles or adults. CalB is widely expressed in the CNS, so responses that we detected could be due to indirect or compensatory effects. We consider this unlikely given that in our mice, phase shifting, light-induced clock gene and protein expression and FOS are normal (Kriegsfeld et al., 2008), but confirmation will require tissue- and cell-specific knockout of CalB in the relevant circuits.
Timing of activity onset in a light–dark cycle is a second measure of entrainment photoresponsiveness. The dependence of phase angle on light intensity, with earlier activity onset in dimmer light, is well documented in mammals (Pohl, 1976; Wright et al., 2005; Doyle et al., 2008). We observed earlier activity onset in CalB−/− than in wildtype mice, indicating that the CalB−/− animals behave as though they perceive the light to be dimmer.
Quantum integration over time is a characteristic of all photoreceptive systems, but while retinal photoreceptors display integration times from 0.1 to 1 s (Baumgardt, 1972; Do et al., 2009), integration times for circadian responses are 100- to 1000-fold longer (Takahashi et al., 1984; Nelson & Takahashi, 1991; Dkhissi-Benyahya et al., 2000). FOS induction in the SCN by light is a particularly good example of long-term photic integration, with linear reciprocity from 3 to 47.5 min – that is, in this range, the magnitude of FOS induction is predictable solely from number of photons (Dkhissi-Benyahya et al., 2000). The circadian system also integrates photons across discrete light pulses (van den Pol et al., 1998; Nelson & Takahashi, 1999; Lall et al., 2010). Appropriate integration of photic information over long time courses may require CalB. CalB−/− mice are hyperresponsive to short-duration light pulses (as in PLR) but hyporesponsive to long-duration light pulses (as in entrainment and masking), possibly pointing to a deficit in photic integration. Indeed, the pattern of enhanced response to short or dim light pulses (small intensity × time values) and diminished response to long or bright light pulses (large intensity × time values) holds true across all of the studies that have examined CalB−/− mice and may resolve apparent discrepancies between them (Kriegsfeld et al., 2008; Stadler et al., 2010). Compared to wildtype, CalB−/− mice are more sensitive to 1 min of light (current study: PLR) and 15 min of 400 lux (Stadler et al., 2010: phase delay in early evening), equally sensitive to 30 min of 800 lux (Kriegsfeld et al., 2008: phase delay in early evening) and less sensitive to longer durations across a range of intensities (current study: masking and entrainment; Kriegsfeld et al., 2008: entrainment).
The present data show that CalB differentially modulates the photosensitivity of different components of the non-image-forming visual system. Appropriate processing of long-duration light input is critical for normal behavior in light-dark cycles, and the present results indicate that CalB in both retinal and CNS cells plays an important role in transducing photic intensity information in the non-image-forming visual system.
Acknowledgments
We thank Dr Linda Ruggiero and Zi Lin for technical assistance, and Drs Donald Hood, Lance Kriegsfeld and Paul Witkovsky for helpful discussions regarding the experiments. This work was supported by grants MH075045, NS37919 (to R.S.) and T32DK07328 (to M.P.B.).
Abbreviations
- CalB
calbindin D28k
- CART
cocaine- and amphetamine-regulated transcript
- CTβ
cholera toxin β
- DD
constant darkness
- EW
Edinger–Westphal nucleus
- I50
half-maximal intensity
- IGL
intergeniculate leaflet
- OPN
olivary pretectal nucleus
- P
postnatal day
- PB
phosphate buffer
- PBS
phosphate-buffered 0.9% saline
- PLR
pupillary light reflex
- SCN
suprachiasmatic nucleus
References
- Airaksinen MS, Eilers J, Garaschuk O, Thoenen H, Konnerth A, Meyer M. Ataxia and altered dendritic calcium signaling in mice carrying a targeted null mutation of the calbindin D28k gene. Proc Natl Acad Sci USA. 1997;94:1488–1493. doi: 10.1073/pnas.94.4.1488. [DOI] [PMC free article] [PubMed] [Google Scholar]
- Aschoff J. Exogenous and endogenous components in circadian rhythms. Cold Spring Harb Symp Quant Biol. 1960;25:11–28. doi: 10.1101/sqb.1960.025.01.004. [DOI] [PubMed] [Google Scholar]
- Baumgardt E. Threshold quantal problems. In: Jameson D, Hurvich LM, editors. Handbook of Sensory Physiology. Springer-Verlag; New York: 1972. pp. 29–55. [Google Scholar]
- Berson DM. Strange vision: ganglion cells as circadian photoreceptors. Trends Neurosci. 2003;26:314–320. doi: 10.1016/S0166-2236(03)00130-9. [DOI] [PubMed] [Google Scholar]
- Bowes C, Li T, Danciger M, Baxter LC, Applebury ML, Farber DB. Retinal degeneration in the rd mouse is caused by a defect in the β subunit of rod cGMP-phosphodiesterase. Nature. 1990;347:677–680. doi: 10.1038/347677a0. [DOI] [PubMed] [Google Scholar]
- Butler MP, Silver R. Divergent photic thresholds in the non-image-forming visual system: entrainment, masking and pupillary light reflex. Proc R Soc B. 2011;278:745–750. doi: 10.1098/rspb.2010.1509. [DOI] [PMC free article] [PubMed] [Google Scholar]
- Cayetanot F, Deprez J, Aujard F. Calbindin D28K protein cells in a primate suprachiasmatic nucleus: localization, daily rhythm and age-related changes. Eur J Neurosci. 2007;26:2025–2032. doi: 10.1111/j.1460-9568.2007.05826.x. [DOI] [PubMed] [Google Scholar]
- Ciarleglio CM, Axley JC, Strauss BR, Gamble KL, McMahon DG. Perinatal photoperiod imprints the circadian clock. Nat Neurosci. 2011;14:25–27. doi: 10.1038/nn.2699. [DOI] [PMC free article] [PubMed] [Google Scholar]
- Dkhissi-Benyahya O, Sicard B, Cooper HM. Effects of irradiance and stimulus duration on early gene expression (Fos) in the suprachiasmatic nucleus: temporal summation and reciprocity. J Neurosci. 2000;20:7790–7797. doi: 10.1523/JNEUROSCI.20-20-07790.2000. [DOI] [PMC free article] [PubMed] [Google Scholar]
- Do MT, Kang SH, Xue T, Zhong H, Liao HW, Bergles DE, Yau KW. Photon capture and signalling by melanopsin retinal ganglion cells. Nature. 2009;457:281–287. doi: 10.1038/nature07682. [DOI] [PMC free article] [PubMed] [Google Scholar]
- Doyle SE, Yoshikawa T, Hillson H, Menaker M. Retinal pathways influence temporal niche. Proc Natl Acad Sci USA. 2008;105:13133–13138. doi: 10.1073/pnas.0801728105. [DOI] [PMC free article] [PubMed] [Google Scholar]
- Drouyer E, LeSauter J, Hernandez AL, Silver R. Specializations of gastrin-releasing peptide cells of the mouse suprachiasmatic nucleus. J Comp Neurol. 2010;518:1249–1263. doi: 10.1002/cne.22272. [DOI] [PMC free article] [PubMed] [Google Scholar]
- Ecker JL, Dumitrescu ON, Wong KY, Alam NM, Chen SK, LeGates T, Renna JM, Prusky GT, Berson DM, Hattar S. Melanopsin-expressing retinal ganglion-cell photoreceptors: cellular diversity and role in pattern vision. Neuron. 2010;67:49–60. doi: 10.1016/j.neuron.2010.05.023. [DOI] [PMC free article] [PubMed] [Google Scholar]
- Govardovskii VI, Fyhrquist N, Reuter T, Kuzmin DG, Donner K. In search of the visual pigment template. Vis Neurosci. 2000;17:509–528. doi: 10.1017/s0952523800174036. [DOI] [PubMed] [Google Scholar]
- Grubb MS, Thompson ID. Biochemical and anatomical subdivision of the dorsal lateral geniculate nucleus in normal mice and in mice lacking the β2 subunit of the nicotinic acetylcholine receptor. Vision Res. 2004;44:3365–3376. doi: 10.1016/j.visres.2004.09.003. [DOI] [PubMed] [Google Scholar]
- Güler AD, Ecker JL, Lall GS, Haq S, Altimus CM, Liao HW, Barnard AR, Cahill H, Badea TC, Zhao H, Hankins MW, Berson DM, Lucas RJ, Yau KW, Hattar S. Melanopsin cells are the principal conduits for rod-cone input to non-image-forming vision. Nature. 2008;453:102–105. doi: 10.1038/nature06829. [DOI] [PMC free article] [PubMed] [Google Scholar]
- Hamada T, LeSauter J, Lokshin M, Romero MT, Yan L, Venuti JM, Silver R. Calbindin influences response to photic input in suprachiasmatic nucleus. J Neurosci. 2003;23:8820–8826. doi: 10.1523/JNEUROSCI.23-26-08820.2003. [DOI] [PMC free article] [PubMed] [Google Scholar]
- Harrington ME, Rusak B. Luminance coding properties of intergeniculate leaflet neurons in the golden hamster and the effects of chronic clorgyline. Brain Res. 1991;554:95–104. doi: 10.1016/0006-8993(91)90176-v. [DOI] [PubMed] [Google Scholar]
- Hatori M, Le H, Vollmers C, Keding SR, Tanaka N, Buch T, Waisman A, Schmedt C, Jegla T, Panda S. Inducible ablation of melanopsin-expressing retinal ganglion cells reveals their central role in non-image forming visual responses. PLoS ONE. 2008;3:e2451. doi: 10.1371/journal.pone.0002451. [DOI] [PMC free article] [PubMed] [Google Scholar]
- Hattar S, Lucas RJ, Mrosovsky N, Thompson S, Douglas RH, Hankins MW, Lem J, Biel M, Hofmann F, Foster RG, Yau KW. Melanopsin and rod-cone photoreceptive systems account for all major accessory visual functions in mice. Nature. 2003;424:76–81. doi: 10.1038/nature01761. [DOI] [PMC free article] [PubMed] [Google Scholar]
- Haverkamp S, Wässle H. Immunocytochemical analysis of the mouse retina. J Comp Neurol. 2000;424:1–23. [PubMed] [Google Scholar]
- Ikeda M, Allen CN. Developmental changes in calbindin-D28k and calretinin expression in the mouse suprachiasmatic nucleus. Eur J Neurosci. 2003;17:1111–1118. doi: 10.1046/j.1460-9568.2003.02515.x. [DOI] [PubMed] [Google Scholar]
- Kim HJ, Harrington ME. Neuropeptide Y-deficient mice show altered circadian response to simulated natural photoperiod. Brain Res. 2008;1246:96–100. doi: 10.1016/j.brainres.2008.09.040. [DOI] [PMC free article] [PubMed] [Google Scholar]
- Kozicz T. Neurons colocalizing urocortin and cocaine and amphetamine-regulated transcript immunoreactivities are induced by acute lipo-polysaccharide stress in the Edinger-Westphal nucleus in the rat. Neuroscience. 2003;116:315–320. doi: 10.1016/s0306-4522(02)00772-8. [DOI] [PubMed] [Google Scholar]
- Kriegsfeld LJ, LeSauter J, Silver R. Targeted microlesions reveal novel organization of the hamster suprachiasmatic nucleus. J Neurosci. 2004;24:2449–2457. doi: 10.1523/JNEUROSCI.5323-03.2004. [DOI] [PMC free article] [PubMed] [Google Scholar]
- Kriegsfeld LJ, Mei DF, Yan L, Witkovsky P, Lesauter J, Hamada T, Silver R. Targeted mutation of the calbindin D28K gene disrupts circadian rhythmicity and entrainment. Eur J Neurosci. 2008;27:2907–2921. doi: 10.1111/j.1460-9568.2008.06239.x. [DOI] [PMC free article] [PubMed] [Google Scholar]
- Kuder T. The ciliary ganglion in mouse. Folia Morphol (Warsz) 1986;45:80–85. [PubMed] [Google Scholar]
- Lall GS, Revell VL, Momiji H, Al Enezi J, Altimus CM, Guler AD, Aguilar C, Cameron MA, Allender S, Hankins MW, Lucas RJ. Distinct contributions of rod, cone, and melanopsin photoreceptors to encoding irradiance. Neuron. 2010;66:417–428. doi: 10.1016/j.neuron.2010.04.037. [DOI] [PMC free article] [PubMed] [Google Scholar]
- LeSauter J, Silver R. Localization of a suprachiasmatic nucleus subregion regulating locomotor rhythmicity. J Neurosci. 1999;19:5574–5585. doi: 10.1523/JNEUROSCI.19-13-05574.1999. [DOI] [PMC free article] [PubMed] [Google Scholar]
- Li X, Gilbert J, Davis FC. Disruption of masking by hypothalamic lesions in Syrian hamsters. J Comp Physiol [A] 2005;191:23–30. doi: 10.1007/s00359-004-0569-5. [DOI] [PubMed] [Google Scholar]
- Lucas RJ, Douglas RH, Foster RG. Characterization of an ocular photopigment capable of driving pupillary constriction in mice. Nat Neurosci. 2001;4:621–626. doi: 10.1038/88443. [DOI] [PubMed] [Google Scholar]
- Lucas RJ, Hattar S, Takao M, Berson DM, Foster RG, Yau KW. Diminished pupillary light reflex at high irradiances in melanopsin-knockout mice. Science. 2003;299:245–247. doi: 10.1126/science.1077293. [DOI] [PubMed] [Google Scholar]
- Mahoney MM, Nunez AA, Smale L. Calbindin and Fos within the suprachiasmatic nucleus and the adjacent hypothalamus of Arvicanthis niloticus and Rattus norvegicus. Neuroscience. 2000;99:565–575. doi: 10.1016/s0306-4522(00)00212-8. [DOI] [PubMed] [Google Scholar]
- Mai JK, Kedziora O, Teckhaus L, Sofroniew MV. Evidence for subdivisions in the human suprachiasmatic nucleus. J Comp Neurol. 1991;305:508–525. doi: 10.1002/cne.903050312. [DOI] [PubMed] [Google Scholar]
- Morin LP, Allen CN. The circadian visual system, 2005. Brain Res Rev. 2006;51:1–60. doi: 10.1016/j.brainresrev.2005.08.003. [DOI] [PubMed] [Google Scholar]
- Mrosovsky N. Masking: history, definitions, and measurement. Chronobiol Int. 1999;16:415–429. doi: 10.3109/07420529908998717. [DOI] [PubMed] [Google Scholar]
- Mrosovsky N, Hattar S. Impaired masking responses to light in melanopsin-knockout mice. Chronobiol Int. 2003;20:989–999. doi: 10.1081/cbi-120026043. [DOI] [PubMed] [Google Scholar]
- Mrosovsky N, Foster RG, Salmon PA. Thresholds for masking responses to light in three strains of retinally degenerate mice. J Comp Physiol A. 1999;184:423–428. doi: 10.1007/s003590050341. [DOI] [PubMed] [Google Scholar]
- Mure LS, Rieux C, Hattar S, Cooper HM. Melanopsin-dependent nonvisual responses: evidence for photopigment bistability in vivo. J Biol Rhythms. 2007;22:411–424. doi: 10.1177/0748730407306043. [DOI] [PMC free article] [PubMed] [Google Scholar]
- Nelson DE, Takahashi JS. Sensitivity and integration in a visual pathway for circadian entrainment in the hamster (Mesocricetus auratus) J Physiol. 1991;439:115–145. doi: 10.1113/jphysiol.1991.sp018660. [DOI] [PMC free article] [PubMed] [Google Scholar]
- Nelson DE, Takahashi JS. Integration and saturation within the circadian photic entrainment pathway of hamsters. Am J Physiol. 1999;277:R1351–R1361. doi: 10.1152/ajpregu.1999.277.5.R1351. [DOI] [PubMed] [Google Scholar]
- Panda S, Nayak SK, Campo B, Walker JR, Hogenesch JB, Jegla T. Illumination of the melanopsin signaling pathway. Science. 2005;307:600–604. doi: 10.1126/science.1105121. [DOI] [PubMed] [Google Scholar]
- Pasteels B, Rogers J, Blachier F, Pochet R. Calbindin and calretinin localization in retina from different species. Vis Neurosci. 1990;5:1–16. doi: 10.1017/s0952523800000031. [DOI] [PubMed] [Google Scholar]
- Pohl H. Proportional effect of light on entrained circadian-rhythms of birds and mammals. J Comp Physiol. 1976;112:103–108. [Google Scholar]
- van den Pol AN, Cao V, Heller HC. Circadian system of mice integrates brief light stimuli. Am J Physiol. 1998;275:R654–R657. doi: 10.1152/ajpregu.1998.275.2.R654. [DOI] [PubMed] [Google Scholar]
- Redlin U, Vrang N, Mrosovsky N. Enhanced masking response to light in hamsters with IGL lesions. J Comp Physiol [A] 1999;184:449–456. doi: 10.1007/s003590050344. [DOI] [PubMed] [Google Scholar]
- Rintoul GL, Raymond LA, Baimbridge KG. Calcium buffering and protection from excitotoxic cell death by exogenous calbindin-D28k in HEK 293 cells. Cell Calcium. 2001;29:277–287. doi: 10.1054/ceca.2000.0190. [DOI] [PubMed] [Google Scholar]
- Schmidt H, Stiefel KM, Racay P, Schwaller B, Eilers J. Mutational analysis of dendritic Ca2+ kinetics in rodent Purkinje cells: role of parvalbumin and calbindin D28k. J Physiol. 2003;551:13–32. doi: 10.1113/jphysiol.2002.035824. [DOI] [PMC free article] [PubMed] [Google Scholar]
- Sekaran S, Lupi D, Jones SL, Sheely CJ, Hattar S, Yau KW, Lucas RJ, Foster RG, Hankins MW. Melanopsin-dependent photo-reception provides earliest light detection in the mammalian retina. Curr Biol. 2005;15:1099–1107. doi: 10.1016/j.cub.2005.05.053. [DOI] [PMC free article] [PubMed] [Google Scholar]
- Silver R, LeSauter J, Tresco PA, Lehman MN. A diffusible coupling signal from the transplanted suprachiasmatic nucleus controlling circadian locomotor rhythms. Nature. 1996;382:810–813. doi: 10.1038/382810a0. [DOI] [PubMed] [Google Scholar]
- Silver R, Sookhoo AI, LeSauter J, Stevens P, Jansen HT, Lehman MN. Multiple regulatory elements result in regional specificity in circadian rhythms of neuropeptide expression in mouse SCN. Neuroreport. 1999;10:3165–3174. doi: 10.1097/00001756-199910190-00008. [DOI] [PubMed] [Google Scholar]
- Stadler F, Schmutz I, Schwaller B, Albrecht U. Lack of calbindin-D28k alters response of the murine circadian clock to light. Chronobiol Int. 2010;27:68–82. doi: 10.3109/07420521003648554. [DOI] [PubMed] [Google Scholar]
- Stephan FK, Zucker I. Circadian rhythms in drinking behavior and locomotor activity of rats are eliminated by hypothalamic lesions. Proc Natl Acad Sci USA. 1972;69:1583–1586. doi: 10.1073/pnas.69.6.1583. [DOI] [PMC free article] [PubMed] [Google Scholar]
- Sun H, Macke JP, Nathans J. Mechanisms of spectral tuning in the mouse green cone pigment. Proc Natl Acad Sci USA. 1997;94:8860–8865. doi: 10.1073/pnas.94.16.8860. [DOI] [PMC free article] [PubMed] [Google Scholar]
- Takahashi JS, DeCoursey PJ, Bauman L, Menaker M. Spectral sensitivity of a novel photoreceptive system mediating entrainment of mammalian circadian rhythms. Nature. 1984;308:186–188. doi: 10.1038/308186a0. [DOI] [PubMed] [Google Scholar]
- Thompson S, Foster RG, Stone EM, Sheffield VC, Mrosovsky N. Classical and melanopsin photoreception in irradiance detection: negative masking of locomotor activity by light. Eur J Neurosci. 2008;27:1973–1979. doi: 10.1111/j.1460-9568.2008.06168.x. [DOI] [PMC free article] [PubMed] [Google Scholar]
- Wright KP, Jr, Gronfier C, Duffy JF, Czeisler CA. Intrinsic period and light intensity determine the phase relationship between melatonin and sleep in humans. J Biol Rhythms. 2005;20:168–177. doi: 10.1177/0748730404274265. [DOI] [PMC free article] [PubMed] [Google Scholar]
- Yamazaki S, Alones V, Menaker M. Interaction of the retina with suprachiasmatic pacemakers in the control of circadian behavior. J Biol Rhythms. 2002;17:315–329. doi: 10.1177/074873040201700405. [DOI] [PubMed] [Google Scholar]
- Zhu Y, Tu DC, Denner D, Shane T, Fitzgerald CM, Van Gelder RN. Melanopsin-dependent persistence and photopotentiation of murine pupillary light responses. Invest Ophthalmol Vis Sci. 2007;48:1268–1275. doi: 10.1167/iovs.06-0925. [DOI] [PubMed] [Google Scholar]