Abstract
Analysis of year-long drifter trajectories and records of simulated surface Lagrangian Coherent Structures (LCSs) have suggested the presence of a resilient Cross-Shelf Transport Barrier (CSTB) on the West Florida Shelf (WFS). The CSTB was conjectured to provide a large degree of isolation, which is consequential for the fueling of red tides on the southern WFS by nutrients possibly released by rivers and canals directly on the region. Here this conjecture is thoroughly tested by identifying LCSs as well as performing tracer advection calculations based on seven-year-long records of surface and subsurface currents produced by a HYbrid-Coordinate Ocean Model (HYCOM) simulation of the Gulf of Mexico (GoM). The identified LCSs suggest that the CSTB extends downward in the water column. The tracer calculations suggest that, while the majority of the nutrients possibly released by rivers and canals directly on the southern WFS are retained within the region for long times, only a small fraction of the nutrients possibly released by rivers outside the WFS reach the southern WFS, mainly accompanying shoreward excursions of the CSTB. These results add importance to the role played by the CSTB in controlling red tide development on the WFS. Implications of the results for the dispersal of pollutants, such as oil, in the GoM are discussed.
1 Introduction
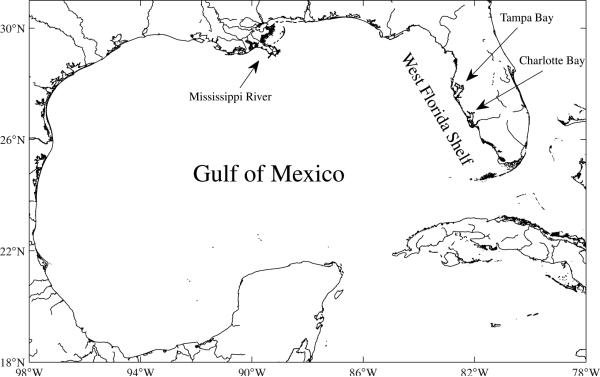
The toxic dinoflagellate Karenia brevis is present in low concentrations in large areas of the Gulf of Mexico (GoM; Fig. 1), and it sporadically forms blooms anywhere in the GoM (Wilson and Ray, 1956; Geesey and Tester, 1993; Tester and Steidinger, 1997; Dortch et al., 1998; Kusek et al., 1999; Magaña et al., 2003). But on the West Florida Shelf (WFS), especially the coastal region between Tampa Bay and Charlotte Bay, red tides constitute recurrent events (Brand and Compton, 2007). Associated with red tides usually is widespread death of sea life resulting from the brevetoxins produced by K. brevis (Bossart et al., 1998; Landsberg and Steidinger, 1998; Landsberg, 2002; Shumway et al., 2003; Flewelling et al., 2005). Brevetoxins are also known to produce injury to humans through ingestion of contaminated seafood, skin contact, or respiration of aerosolized brevetoxins in coastal areas (Backer et al., 2003; Kirkpatrick et al., 2004).
Fig. 1.
Map showing the region of study.
Several hypotheses about the origin of the nutrients needed for red tide development on the WFS have been proposed. Of particular relevance for the present work is the hypothesis of Stumpf et al. (2008), who argued that, upon reaching the WFS, subsurface nutrients of Mississippi River origin can be transported onshore via upwelling, and fuel red tides. This scenario does not seem to be consistent with the year-round presence of a Cross-Shelf Transport Barrier (CSTB) on the WFS (Yang et al., 1999; Olascoaga et al., 2006). The presence of the CSTB was suggested from the inspection of year-long satellite-tracked drifter trajectories (Yang et al., 1999). More specifically, Yang et al. (1999) found in the southern WFS a triangular-shaped region, referred to as “forbidden zone”, which was not visited by drifters released outside of the region. The “forbidden zone” is precisely the locus of the most frequent and abundant red tides in the GoM. The CSTB was subsequently characterized by Olascoaga et al. (2006) using the Lagrangian Coherent Structure (LCS) concept (Haller and Yuan, 2000) based on the analysis of surface currents produced by Hybrid-Coordinate Ocean Model (HYCOM) simulation of the GoM for year 2004. Concealed in the flow, LCSs are distinguished material fluid curves which act as skeletons for patterns emerged from passively advected tracers. In Olascoaga et al. (2006) it was conjectured that the CSTB behaves as a trap for nutrients and dinoflagellates initially positioned on its inshore side, thereby providing favorable conditions for the development of red tides. But the possibility exists that the CSTB is a surface-confined phenomenon and hence represents no obstacle for subsurface nutrients of Mississippi River origin, which requires to be investigated.
Here the conjectured isolation of the southern WFS provided by the CSTB is subjected to a thorough test. This test is carried out by identifying LCSs and performing passive tracer advection calculations based on surface and subsurface currents produced by a HYCOM simulation of the GoM over the period 2000–2007. The LCSs are identified to supply a global picture of the pathways that nutrients can take on the GoM's surface and subsurface. The passive tracer advection calculations are carried out to determine particular pathways taken by nutrients released from sources possibly located in- and outside the WFS. The results from these computations are found to provide a favorable test of isolation on the WFS.
The reminder of the paper has the following organization. In Sect. 2 the methodology employed is described. The exposition includes a brief introduction to the LCS notion and a description of the tool employed to diagnose LCSs. Additionally, the simulated velocity records considered are described along with details of the tracer evolution experiments. The results of the paper are presented in Sect. 3. A discussion on several topics is offered in Sect. 4. These include: the connection of the results of the paper with prior theories of red tide development on the WFS; the influence of the wind-induced Eulerian circulation on Lagrangian motion on the WFS in connection to Stumpf et al.'s hypothesis of red tide development; the relevance of the results to red tide development on regions in the GoM beyond the WFS; and the utility of the results for the study of the dispersal of pollutants such as oil, particularly in connection to the recent oil spill in the GoM, which is seen to provide support to the results of the paper. Finally, the conclusions of the paper are presented in Sect. 5.
2 Methods
Potential nutrient pathways are identified in this paper by unveiling attracting LCSs. As defined in Haller and Yuan (2000), attracting (repelling) LCSs are material fluid surfaces that attract (repel) neighboring fluid particles at the locally highest rate over a finite-time interval. So defined, attracting (repelling) LCSs are akin to unstable (stable) manifolds in the steady or time-periodic flow cases (e.g., Samelson and Wiggins, 2006). As such, the LCSs act as skeletons for patterns formed by fluid particle trajectories. Constituting the central structures along which neighboring fluid particles accumulate in forward time, attracting LCSs, in particular, delineate pathways for passive tracer evolution, and thus their identification is most insightful for the purpose of this study. Being inherently Lagrangian, the LCSs cannot be detected visually from the inspection of velocity field snapshots. One practical and robust LCS detection technique, which is employed here, is supplied by the computation of Finite-Time Lyapunov Exponents (FTLEs) (Haller, 2001a,b, 2002; Shadden et al., 2005); other diagnostic tools exist which also reveal LCSs (e.g., Haller, 2001b; Boffetta et al., 2001; Joseph and Legras, 2002; d'Ovidio et al., 2004). The forward (backward) time FTLE characterizes the amount of forward (backward) time stretching about fluid particle trajectories, and is given by
| (1) |
Here ∥ ∥ stands for spectral norm and where x(t) is fluid particle's position at time t. Ridges of backward (forward) time, i.e., τ < 0 (τ > 0), FTLE field both are almost Lagrangian (Shadden et al., 2005) and correspond, with some caveats (Haller, 2002; Branicki and Wiggins, 2010), to regions of maximal local forward-time attraction (repulsion). As such, they have been broadly identified as good attracting (repelling) LCS detectors in a large variety of applications (cf. Peacock and Dabiri, 2010, for a recent review).
The velocity fields that supply advection for fluid particles are produced by the 0.04°-resolution data-assimilative HYCOM nowcast of the GoM, itself nested within a 0.08°-resolution Atlantic Ocean simulation generated at the U.S. Naval Research Laboratory (NRL). HYCOM is an ocean general circulation model based on the primitive equations of motion where the vertical coordinate is hybrid, being isopycnal in the open, stratified ocean, but smoothly reverting to a terrain-following coordinate in shallow coastal regions, and to a z-level coordinate in the mixed layer and/or unstratified seas (Bleck, 2002). Realistic high-frequency forcing is used to drive the model which is obtained from the U.S. Navy Operational Global Atmospheric Prediction System (NOGAPS) operational atmospheric model. The topography used is derived from the U.S. NRL 2-min-resolution Digital Bathymetry Data Base (DBDB2), with the coastline following the 2-m isobath. Climatological runoff by rivers including the Mississippi River, Hillsborough River, Caloosahatchee River, and Peace River discussed in this paper is incorporated in the simulation. The model assimilates satellite-derived sea surface height anomaly and temperature data as well as available vertical profile data. Data assimilation into the model is based on the U.S. Navy Coupled Ocean Data Assimilation (NCODA) system (Cummings, 2005). Downward projection of surface information is carried out using the method described in Fox et al. (2002). The HYCOM simulation considered has proven ability to represent aspects of the Lagrangian evolution in the GoM revealed in patterns formed by satellite-track drifter trajectories and ocean color distributions (Olascoaga et al., 2006, 2008). Additional performance tests are described in, e.g., Chassignet et al. (2005).
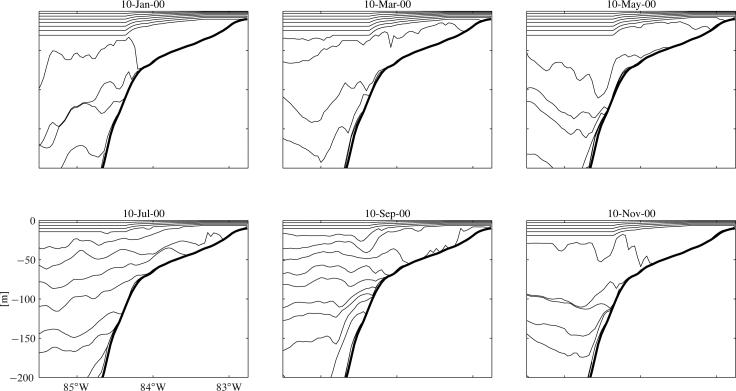
The LCS identification and the complementary passive tracer advection computations are based on seven-year (2000–2007) records of daily velocity fields defined on HYCOM's surface and various subsurface layers. Thus Lagrangian evolution is not studied in strictly three-space dimensions. However, it is studied in a quasi-three-dimensional fashion consistent with HYCOM's vertical coordinate formulation, which is isopycnic except within boundary layers. This way vertical motion of fluid particles is implicitly accounted for by the vertical motion of isopycnic layers. Figure 2 depicts a transect across the WFS at 27.5° N showing on selected dates along 2000 the vertical structure of HYCOM. Various of the layers depicted, which are labeled, from the top down, k = 1,2,..., are employed in the Lagrangian calculations. Motivated by the observation that nutrients of Mississippi River origin have been identified in water samples taken near the shelf break at around 40-m depth (Stumpf et al., 2008) and a desire to test Stumpf et al.'s hypothesis on the nature of nutrients fueling red tides on the southern WFS, particular attention is paid to Lagrangian motion along subsurface layer k = 6, which is isopycnic and can lie around 40-m depth near the shelfbreak.
Fig. 2.
Transect across the West Florida Shelf (WFS) at 27.5° N showing on selected dates along 2004 various layers of the Hybrid-Coordinate Ocean Model (HYCOM), which is employed in the Lagrangian calculations. The thin curves indicate the boundaries between contiguous layers, which are labeled k = 1,2,... from the top down throughout the paper. The thick curve indicates the bottom topography.
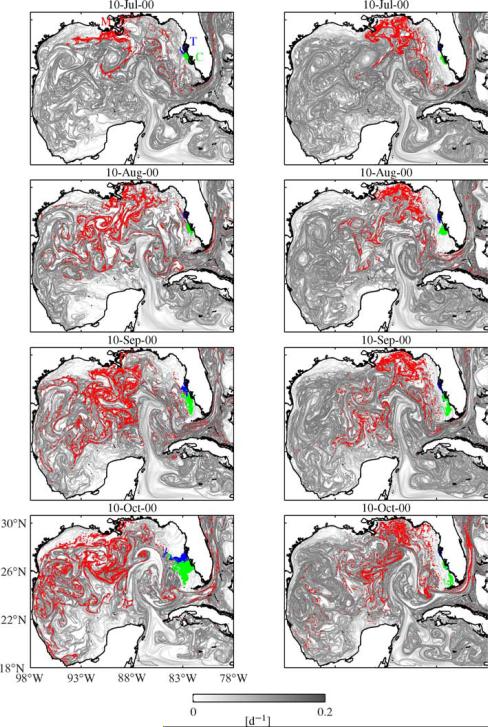
The passive tracer advection experiments carried out to complement the LCS identification consist in tracking neutrally buoyant particles deployed every other day in three regions that represent possible nutrient sources: the vicinity of the Mississippi River's mouth, which is located outside the WFS; and Tampa Bay and Charlotte Bay, which are located on the southern WFS and where various rivers (such as the Hillsborough River, Caloosahatchee River, and Peace River) and canals discharge. (Other rivers and canals, which are not considered here, discharge on the WFS; however, the total discharge rate of these rivers and canals is smaller than that of those considered here.) These three regions of particle deployment are labeled M, T, and C, respectively, in the top-left panel of Fig. 5.
Fig. 5.
As in Fig. 3, but using a gray scale and with dots overlaid indicating positions taken by passive particles deployed every other day in regions labeled M (red), T (blue), and C (green).
The FTLE (1) is computed by evaluating directly (x) using finite differentiation of trajectories of particles initially distributed over a regular 0.007°-resolution grid, which is about six times finer than that on which HYCOM velocities are defined. The trajectory integrations entailed in both FTLE and passive tracer advection computations are performed using a time-step-adapting fourth/fifth-order Runge-Kutta method. The required interpolations in space and time are done using a linear scheme. The backward integration time for the FTLE calculations is τ = –30 d, which is enough to reveal the most salient LCSs that comprise the Lagrangian skeletons of the GoM's surface and subsurface circulations. Similar settings have been employed in previous related studies (Olascoaga et al., 2006, 2008; Beron-Vera and Olascoaga, 2009).
3 Results
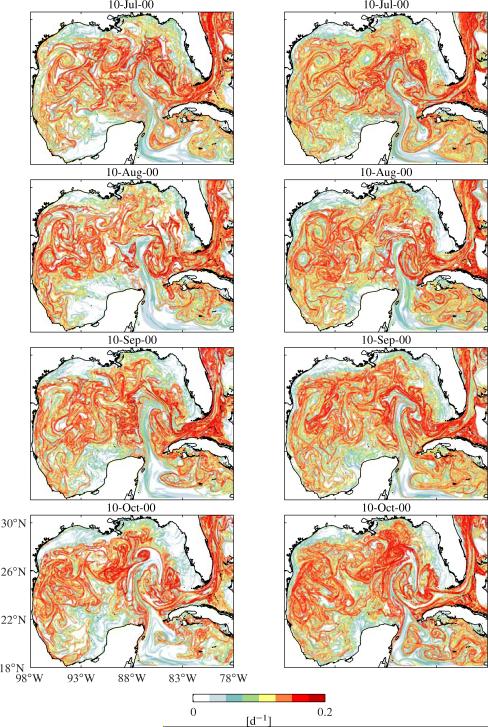
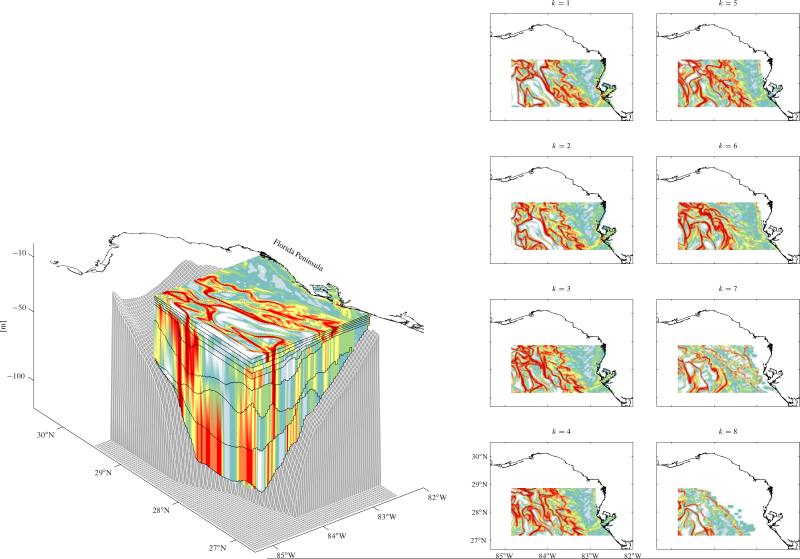
The left and right panels in Fig. 3 show a sequence of snapshots of backward-time FTLE field computed using, respectively, surface velocities and velocities defined on (isopycnic) subsurface layer k = 6 over the period 10 July 2000 through 10 October 2000. The convoluted bands of most intense red tones in each panel of the figure indicate attracting LCSs. Note the intricate LCS patterns composed of numerous eddy-like features and filaments, which suggests that vigorous mixing is ubiquitous in the GoM, both on its surface and the subsurface. Note also the presence on both the surface and subsurface of persistent isolated regions relatively free of such intricate LCS patterns, which suggests relatively low mixing within those regions. Such regions lie on the Texas-Louisiana Shelf, the Yucatan Shelf, and the WFS. The latter suggests, in particular, that the CSTB, which supplies isolation on the WFS, is not confined on the ocean's surface. Rather, it stands out as an LCS (or a set of LCSs) with a vertical signature that can be traced deeper in the water column.
Fig. 3.
Sequence of snapshots of Finite-Time Lyapunov Exponent (FTLE) field computed in backward time using simulated surface (left panels) and subsurface (right panels) velocities in the Gulf of Mexico. The subsurface velocities correspond to velocities defined on (isopycnic) subsurface layer k = 6 (cf. Fig. 2). The convoluted bands of most intense red tones indicate attracting Lagrangian Coherent Structures (LCSs).
Before discussing explicitly the behavior of passively advected tracers in the GoM, further support is provided for the idea conveyed above that the CSTB extends throughout the water column by analyzing FTLE fields on additional subsurface layers. This is offered in Fig. 4. The left panel of the figure provides a three-dimensional view of the FTLE field on 10 July 2000 within a region lying over the WFS and extending through part of the shelfbreak. The plot shown was constructed by patching together the two-dimensional FTLE fields computed using surface velocities and velocities defined on various subsurface layers including subsurface layer k = 6. The boundary between contiguous isopycnic layers is indicated in the plot by the black curve. The FTLE fields on the surface layer and within each of the subsurface layers are depicted in the panels on the right side of the figure. Note the FTLE ridge (which indicates an LCS) on the shelfbreak extending through most of the water column.
Fig. 4.
Left panel: asnapshot on 10 July 2010 showing backward-time FTLEs in three-space dimensions in a domain including a portion of the WFS and extending to the shelfbreak (the bottom topography is indicated in grey). Right panels: two-dimensional FTLE fields on the surface layer (k = 1) and several subsurface layers (k = 1,...,8) used to construct the three-dimensional plot in the left panel.
Attention can now be turned to the analysis of the evolution of passive tracers in the GoM. Overlaid red, blue, and green dots on each FTLE field shown in Fig. 5 indicate positions taken by passive particles after being deployed near the Mississippi River's mouth, Tampa Bay, and Charlotte Bay, respectively. Note that the particles closely follow the deformation over time of the LCSs (indicated by the FTLE ridges in the figure). This explicitly illustrates that, being material fluid curves, attracting LCSs constitute the central structures along which neighboring fluid particles accumulate, and thus demarcate pathways for passive tracer evolution. While the majority of the particles released near the Mississippi River mouth on the surface layer (Fig. 5, left panels) are seen to move mainly southwestward initially, some particles take a southeastward direction. The particles that initially move southwestward spread over the western GoM basin. Most of the particles that initially move southeastward tend to line up along an LCS that demarcates the boundary of the Loop Current. These particles eventually exit the GoM through the Florida Strait taking a northward trajectory along the Gulf Stream. Only a small number of particles, which mainly travel nearly along the coastline from their point of release, are seen to end up within the southern WFS, on the inshore side of the CSTB. Such particles take no less than 3 months to reach the southern WFS, which is long enough to be subjected to considerable dilution. The behavior just described finds support on observations. First, driven by southwesterly winds, the plume of the Mississippi River has been observed to move southeastward in summer without spreading over the WFS (Walker et al., 2005). Second, the Mississippi River plume was possible to be tracked as far as the Gulf Stream off the coast of Georgia (Ortner et al., 1995; Hu et al., 2005). Third, Ortner et al. (1995) estimated a dilution rate of 1:9 per month for freshwater of Mississippi River origin based on salinity observations in the Florida Strait.
Similar fate as for particles released in the vicinity of the Mississippi River's mouth on the surface layer is predicted for particles released within subsurface layer k = 6 (Fig. 5, right panels). The most important difference is that, rather than spreading over the western GoM basin, the particles tend to move predominantly southeastward. In marked contrast with particles released near the Mississippi River's mouth, but entirely consistent with the presence of the CSTB, the particles released in Tampa Bay and Charlotte Bay, both on the surface layer and subsurface layer k = 6, tend to remain trapped within the southern WFS without spreading over the GoM.
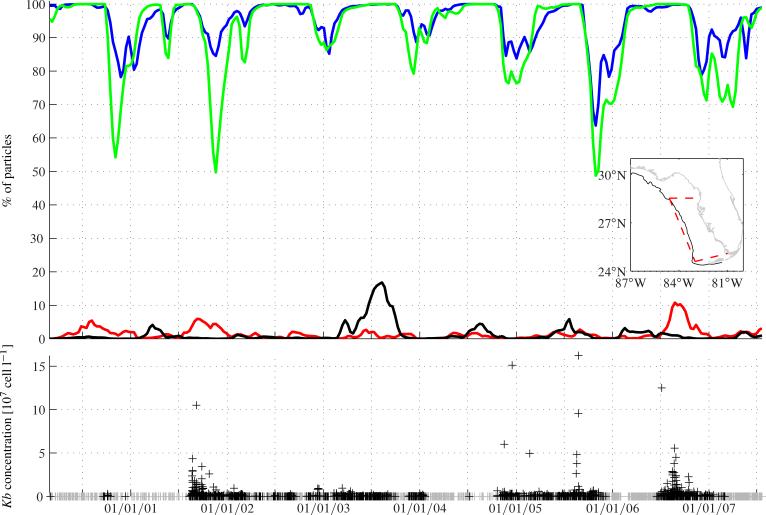
The top panel in Fig. 6 shows as a function of time over the period 2000–2007 the percentages of particles that are found on the southern WFS after being released every other day on the surface layer (black curve) and subsurface layer k = 6 (red curve) near the Mississippi River's mouth. These are compared with those of particles released on the surface layer in Tampa Bay (blue curve) and Charlotte Bay (green curve), whose behavior is very similar to that of particles released on subsurface layer k = 6 and thus are not discussed. Each time series is computed by counting the number of particles lying within the region delimited by the dashedred line depicted in the inserted map, and dividing by the total number of particles lying within the GoM. This control region goes from 28.5° N down to roughly the Florida Keys, and from the coast out to roughly the 60-m isobath (black curve in the inserted map). Consistent with the presence of the CSTB, the smallest percentages are attained by particles released near the Mississippi River's mouth, while the largest by those released in Tampa Bay and Charlotte Bay. The percentages for particles released on the surface layer (subsurface layer k = 6) near the Mississippi River's mouth oscillate between 0% and no more than 20% (1%). (Note that percentages of subsurface particles are multiplied by ten in the figure.) The percentage of particles released in Tampa (Charlotte) Bay oscillate between 100% and no less than 70% (60%). These oscillations conceal a signal with a period of approximately 12 months, and mainly reflect shoreward excursions of the CSTB (note that the oscillations in the time series for particles released near the Mississippi River's mouth are nearly in counterphase with those of particles released on Tampa Bay and Charlotte Bay). The shoreward excursions of the CSTB are largely anticorrelated with the northward excursions of the Loop Current, in agreement with analysis of altimetry-derived currents and satellite-tracked drifter trajectories (Hetland et al., 1999). Analysis of altimetric data (Sturges and Leben, 2000) as well as altimetric data and numerical simulations (Romanou and Chassignet, 2004; Zavala-Hidalgo et al., 2006) suggest that Loop Current's northward excursions include a signal with a period of 11 months or so, which is roughly consistent with that of CSTB's shoreward excursions estimated here.
Fig. 6.
Top panel: percentages as a function of time of passive particles that reach the region on the WFS delimited by the dashed-red line indicated in the inserted map after being released every other day on the surface layer (black curve) and subsurface layer k = 6 (red curve) in region M, and on the surface in region T (blue curve) and C (green curve), as indicated in the top-left panel of Fig. 5. Subsurface particle percentages are multiplied by ten. The black curve in the inserted map indicates the 60-m isobath. Bottom panel: time series of Karenia brevis cell concentration within the control region on the WFS. Highlighted in black is cell concentration higher than 104 cell l−1, which is a threshold concentration used as a red tide indicator.
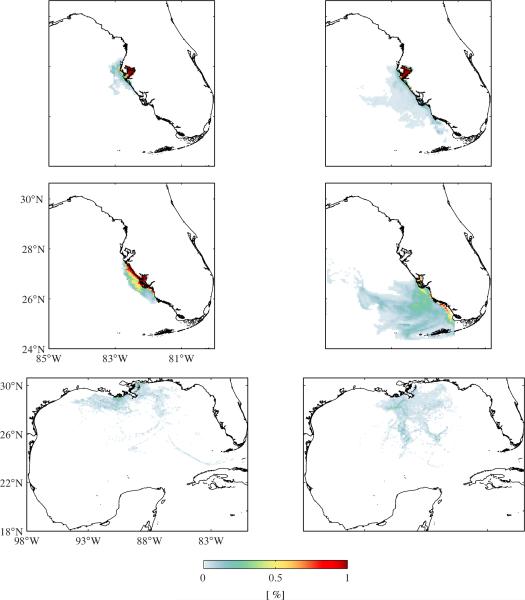
The behavior described above is further investigated by comparing horizontal distributions attained by passive particles during conditions of maximal on- and offshore excursions of the CSTB. The (left) right panels of Fig. 7 show particle concentration maps during maximal onshore (offshore) CSTB excursion conditions. These maps were constructed using particles released every other day over the course of 30 d during periods representative of each of the aforementioned conditions along the seven (2000–2007) years of analysis on the surface in Tampa Bay (top panels), Charlotte Bay (middle panels), and the vicinity of the Mississippi River's mouth (bottom panels). The concentration, expressed as a percentage, was computed by counting the number of particles falling within each of the many 0.05° × 0.05° bins covering the GoM and dividing by the total number of particles released. When the onshore excursion of the CSTB is maximal particles released in Tampa Bay and Charlotte Bay conglomerate (particle concentrations are high) near the shoreline. More specifically, the particles tend to accumulate near the coastline between Tampa Bay and Charlotte Bay. Interestingly, historical data reveal that K. brevis concentrations are precisely highest there (Brand and Compton, 2007). In marked contrast with the behavior of the particles during maximal onshore excursion of the CSTB, when the offshore excursion of the CSTB is maximal the particles, particularly those released in Charlotte Bay, tend to spread over the southern WFS. Relatively lower concentrations over the GoM are found for particles released near the Mississippi River's mouth quite independently of the motion of the CSTB. The only difference is that particle concentrations are somewhat higher near the WFS when the onshore excursion of the CSTB is maximal than when the offshore excursion is maximal.
Fig. 7.
Particle concentration (expressed as percentage of total particles) maps during conditions of maximal onshore (left panels) and offshore (right panels) of the CSTB on the WFS. These maps were constructed using particles released every other day over the course of 30 d in each of the aforementioned conditions over the whole period 2000–2007 on the surface layer in Tampa Bay (top panels), Charlotte Bay (middle panels), and the vicinity of the Mississippi River's mouth (bottom panels).
4 Discussion
The discussion is started by considering the possibility of connecting the presence of the CSTB with observed occurrence of WFS red tides. The bottom panel in Fig. 6 shows a time series over the period 2000–2007 of K. brevis cell concentration within the control region on the southern WFS defined above. Highlighted in black is cell concentration higher than 104 cell l−1, which is a threshold cell concentration employed (e.g., Brand and Compton, 2007) as a red tide indicator. Note that the strongest red tides, i.e., with cell concentrations much higher than the threshold cell concentration, tend to be attained when most particles released near Tampa Bay and Charlotte Bay are retained within the control area. The latter corresponds to a situation in which the CSTB lies close to shoreline. This suggests a connection between red tide development and the motion of the CSTB consistent with the conjecture proposed in Olascoaga et al. (2006). The present analysis suggests in addition that the distance of the CSTB relative to the shore may play an important role in supplying such conditions. Optimal conditions may be expected to be attained when the CSTB minimizes the dispersion of K. brevis cells and nutrients possibly released by rivers and canals on its inshore side. When the CSTB lies close to the shore, fluid particles are compressed against the shoreline, and dispersion is minimized. On the other hand, when the CSTB retracts from the shore, fluid particles are flushed away from the shore following the motion of the CSTB, thereby enhancing dispersion. If the nutrient supply is sufficiently large, in the first case blooming of K. brevis, which has slow growth rates (Brand and Guillard, 1981), is favored while in the second case is not. The mechanism just described is not seen to be well suited to explain the development of the less intense red tides. Other mechanisms may be at work as well, which requires further research to be unveiled.
Previous studies (Gunter et al., 1947; Rounsefell and Nelson, 1966; Dixon and Steidinger, 2004) have associated the development of red tides on the southern WFS with river runoff, pollution, and other nutrient enriching phenomena produced by human activities. Consistent with these previous studies and the increase in the frequency of red tides, Brand and Compton (2007) have shown that K. brevis concentrations are indeed higher near the shoreline than offshore, and that nutrient-rich freshwater runoff from land is likely to be a major source of nutrients for the development of red tides. Other researchers (Hu et al., 2006) have argued that, in addition to river runoff, submarine groundwater discharge, particularly when enhanced by an active hurricane season, should play a role in stimulating WFS red tides. It has been also suggested (Tester and Steidinger, 1997) that some red tides initiate a few tens of kilometers offshore within the southern WFS, near frontal regions, and that upwelling events provide a mechanism for supplying the required nutrients for their stimulation. Another, more sophisticated, theory has been proposed (Lenes et al., 2001; Walsh and Steidinger, 2001; Walsh et al., 2003; Walsh et al., 2006) which explains red tide development as a sequence of events preceded by iron-rich Saharan dust deposition. In brief, the theory assumes that the Saharan dust stimulates Trichodesmium blooms, which fix nitrogen. The blooms decompose on sinking and release dissolved organic nitrogen, which stimulates a hypothetical K. brevis seed population near the bottom. Coastal upwelling is then required to help this population reaching the sea surface, where light inhibition is alleviated and a red tide finally develops. Except for Stumpf et al.'s (2008) theory, which postulates that the Mississippi River is an important nutrient source for the fueling of WFS red tides, all the other proposed red tide development theories not only are consistent with, but also crucially depend on, the presence of a CSTB on the WFS. Indeed, as noted above, the CSTB supplies the necessary isolation on the southern WFS for nutrients injected into this region by the aforementioned processes (river runoff, groundwater discharge, upwelling within the WFS, and wind deposition), individually or combined, to most effectively fuel red tides.
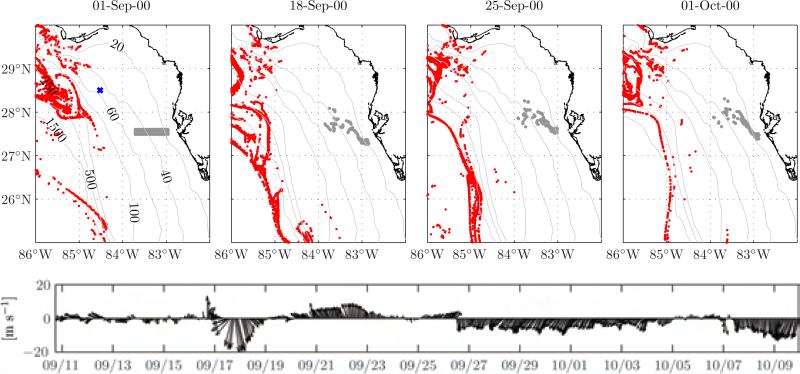
The present investigation has been largely motivated by the results of Stumpf et al. (2008), who conjectured that subsurface nutrients of Mississippi River origin can be brought onshore by coastal upwelling once they reach the WFS to fuel red tides. To support their conjecture Stumpf et al. presented results from subsurface passive particle tracking experiments. Such experiments consisted in tracking particles released off Tampa Bay near the bottom on the WFS between the 20- and 50-m isobaths (roughly located 30 to 100 km away from the shore). As reported by Stumpf et al., analysis of water samples has indicated the presence of nutrients of Mississippi River origin around those depths, but further away from the coast (near the 100-m isobath) and, according to the Lagrangian calculations of this paper, in the offshore side of the CSTB on the WFS. The deployment area considered by Stumpf et al., however, lied well in the inshore of the CSTB, which explains why the particles were seen to be brought onshore. A similar experiment has been conducted here which shows that releasing the particles in the inshore side of the CSTB is necessary for them to be brought onshore. This experiment, which extends that one carried out by Stumpf et al. for September 2000 by including lateral dispersion effects, also illustrates the effect of the wind-induced Eulerian circulation on Lagrangian motion on the WFS. Specifically, the grey dots in the upper panels of Fig. 8 indicate the positions taken by particles released on 1 September 2000 on the WFS between 30 and 100 km offshore Tampa Bay within subsurface layer k = 6. By 18 September 2000 the particles are transported toward the coast under upwelling favorable wind conditions, which is revealed in the wind vector time series depicted in the bottom panel. After that date the wind takes a more northward direction until 26 September 2000. Accordingly, the particle transport during those days is seen to be offshore. The wind vector time series reveals a second upwelling event which starts on 26 September 2000 and lasts until 5 October 2000. During this event the particles experience an approximately 30-km excursion coastward. The red dots in the upper panels corresponds to positions taken by particles released in an almost continuous manner near the Mississippi River's mouth within subsurface layer k = 6. Note that these particles do not cross the 100 m isobath consistent with the presence of the CSTB. Thus while Lagrangian motion on the WFS is influenced by the wind-induced Eulerian circulation, the latter is not seen to be strong enough to bring onshore particles initially lying in the offshore side of the CSTB, thereby providing no support for Stumpf et al.'s scenario.
Fig. 8.
Top panels: a sequence of snapshots of positions of passive particles released within subsurface layer k = 6. Gray dots correspond to particles released on 1 September 2000 in the inshore side of the CSTB. Red dots correspond to particles released every other day near the Mississippi River mouth. Bathymetry contours shown are in meters. Bottom panel: wind vector time series in the period 11 September 2000 through 10 October 2000 from NOAA meteorological station 42036. The location of this station is indicated with a cross in the upper-left panel.
The reported low mixing activity on the Louisiana-Texas Shelf and the Yucatan Shelf deserves some comment. In a similar fashion as the southern WFS, these regions are subjected to a good degree of isolation, which may be consequential for red tides. Indeed, albeit less frequently, intensely, and exclusively produced by K. brevis as on the southern WFS, red tides also tend to develop on the Louisiana-Texas Shelf (Magaña et al., 2003; Hetland and Campbell, 2007) and the Yucatan Shelf (Ochoa, 2003; Enriquez et al., 2010). On the other hand, the Louisiana-Texas Shelf has been long recognized to be the locus of benthic hypoxia, a phenomenon where the concentration of dissolved oxygen in the deepest part of the water column decreases to a level that can no longer support aerobic aquatic organisms (Harper et al., 1981; Turner and Rabalais, 1994; Scavia et al., 2003). Stagnation is one mechanism that favors the development of hypoxia (Diaz and Rosenberg, 1995). Thus the reported low mixing activity on the Louisiana-Texas Shelf may also be consequential for the development of benthic hypoxia in that region.
The results of the present Lagrangian analysis may be useful to understand aspects of tracer dispersal in the GoM which go beyond those of nutrient dispersal. For example, they may anticipate be characteristics useful to of the evolution of pollutants such as oil. Note that nonconservative behavior (unlike that of a passive tracer) of oil has not been accounted for here. Thus, in principle, the comments that follow should be considered valid to a first approximation only. With this clarification in mind, the results of this study contain information that may be used to plan offshore oil exploration in such a way as to minimize environmental impact in the event of a spill. For instance, if an oil spill occurred within the southern WFS, then coastal and benthic habitats in that region would be exposed to considerable damage as a consequence of the long residence time imposed on the oil by the CSTB. Similar behavior may be anticipated for the Louisiana-Texas Shelf and the Yucatan Shelf consistent with the reported low mixing activity in those regions. It would then be most recommendable that these three regions in the GoM be avoided by offshore oil exploration.
The fate of the oil recently spilled in the GoM provides strong support to the idea articulated here that the CSTB supplies great isolation to the southern WFS. On 20 April 2010, while drilling near the Mississippi River's mouth, a blowout caused an explosion on the Deepwater Horizon rig. The resulting fire could not be extinguished and, on 22 April 2010, the Deepwater Horizon sank, leaving the well gushing at the sea floor and causing the largest accidental marine oil spill in the history of the petroleum industry. The leak was stopped on 15 July 2010 by capping the gushing wellhead. It has been estimated that over 4 million barrels (6.36 × 10⁵ m3) of oil escaped from the well before it was capped (http://www.deepwaterhorizonresponse.com/go/doc/2931/840475). The vigorous action of the ocean currents and also the use of chemical agents have contributed to disperse a great deal of the spilled oil, but large underwater plumes of dissolved oil not visible at the sea surface are still being reported at the time of writing (Camilli et al., 2010). However, consistent with the notion that the CSTB greatly isolates the southern WFS, neither surface nor submerged oil has been found to reach this region.
5 Conclusions
A Lagrangian analysis has been carried out using surface and subsurface velocities produced by a Hybrid-Coordinate Ocean Model (HYCOM) simulation of the Gulf of Mexico (GoM) over the period 2000–2007. The analysis was based on detection of Lagrangian Coherent Structures (LCSs) and execution of passive tracer advection experiments. The LCSs are material fluid surfaces (i.e., transport barriers) which form the center cores of patterns acquired by passive tracers.
The main result of the Lagrangian analysis is the presence of a two-dimensional – rather than surface-confined and hence one-dimensional – Cross-Shelf Transport Barrier (CSTB) that supplies isolation for the southern West Florida Shelf (WFS). This result, along with the analysis of Karenia brevis cell concentration data, is consistent with the conjecture put forward earlier based on the inspection of year-long satellite-tracked drifter trajectories and analysis of LCSs sustained by a year-long record of HYCOM surface currents. This conjecture asserts that the CSTB provides favorable conditions for nutrients released on its inshore side by various rivers and canals to most effectively fuel K. brevis red tides, which tend to develop most frequently and abundantly there. The two-dimensional nature of the CSTB gives good reason to question a recent theory of red tide development on the WFS. The theory asserts that WFS red tides are fueled by nutrients of Mississippi River origin. This requires the nutrients to make their way into the southern WFS, which is largely prevented by the presence of the CSTB.
A secondary result from the Lagrangian analysis is the identification of low mixing activity on the Louisiana-Texas Shelf and the Yucatan Shelf. This result deserves further investigation as it may also be consequential for red tides, which also tend to develop there. Additionally, the Louisiana-Texas Shelf is known to be the locus of benthic hypoxia. The connection between the development of hypoxia and the reported low mixing conditions in this region is thus worth investigating too. Finally, the reported low mixing on the WFS, the Louisiana-Texas Shelf, and the Yucatan Shelf is relevant for the offshore oil exploration in the GoM. Because knowledge of the existence of persistent low mixing regions can be used to plan oil exploration in such a way as to minimize environmental damage in the event of a spill, it is also worth investigating if such regions exist when behavior of oil which is unlike that of a passive tracer is taken into account.
Acknowledgements
This work has benefited from comments on the manuscript by F. Beron-Vera, L. Brand, M. Brown, L. Flemming, J. Sheinbaum, S. Smith, and two anonymous reviewers. The HYCOM model output was supplied by O. Smedstad. The FTLEs were computed using MANGEN, a software toolkit designed by F. Lekien. The Karenia brevis concentration data source is Florida Fish and Wildlife Research Institute. Support for this work was provided by NSF grants CMG0417425 and CMG0825547, NSF grant OCE0432368, NIEHS grant P50ES12736, and a University of Miami General Research Support Award.
References
- Backer LC, Fleming LE, Rowan A, Cheng Y-S, Benson J, Pierce RH, Zaias J, Bean J, Bossart GD, Johnson D, Quimbo R, Baden DG. Recreational exposure to aerosolized brevetoxins during Florida red tide events. Harmful Algae. 2003;2:19–28. [Google Scholar]
- Beron-Vera FJ, Olascoaga MJ. An assessment of the importance of chaotic stirring and turbulent mixing on the West Florida Shelf. J. Phys. Oceanogr. 2009;9:1743–1755. doi: 10.1175/2009jpo4046.1. doi:0.1175/2009JPO4046.1. [DOI] [PMC free article] [PubMed] [Google Scholar]
- Bleck R. An Oceanic General Circulation Model Framed in Hybrid Isopycnic-Cartesian Coordinates. Ocean Model. 2002;37:55–88. [Google Scholar]
- Boffetta G, Lacorata G, Redaelli G, Vulpiani A. Detecting barriers to transport: a review of different techniques. Physica D. 2001;159:58–70. doi:10.1016/S0167-2789(01)00330-X. [Google Scholar]
- Bossart GD, Baden DG, Ewing RY, Roberts B, Wright SD. Brevetoxicosis in manatees (Trichechus manatus Latirostris) from the 1996 epizoodic: gross, histopathologic and immunocytochemical features. Toxicol. Pathol. 1998;26:276–282. doi: 10.1177/019262339802600214. [DOI] [PubMed] [Google Scholar]
- Brand LE, Compton A. Long-term increase of Karenia brevis abundance along the Southwest Florida Coast. Harmful Algae. 2007;6:232–252. doi: 10.1016/j.hal.2006.08.005. [DOI] [PMC free article] [PubMed] [Google Scholar]
- Brand LE, Guillard RRL. The effects of continuous light and light intensity on the reproduction rates of twenty-two species of marine phytoplankton. J. Exp. Mar. Biol. Ecol. 1981;50:119–132. [Google Scholar]
- Branicki M, Wiggins S. Finite-time Lagrangian transport analysis: stable and unstable manifolds of hyperbolic trajectories and finite-time Lyapunov exponents. Nonlin. Processes Geophys. 2010;17:1–36. doi:10.5194/npg-17-1-2010. [Google Scholar]
- Camilli R, Reddy CM, Yoerger DR, van Mooy BAS, Jakuba MV, Kinsey JC, McIntyre CP, Sylva SP, Maloney JV. Tracking hydrocarbon plume transport and biodegradation at Deepwater Horizon. Sience. 2010;330(6001):201–204. doi: 10.1126/science.1195223. doi:10.1126/science.1195223. [DOI] [PubMed] [Google Scholar]
- Chassignet EP, Hulburt HE, Smedstad OM, N.Barron C, Ko DS, Rhodes RC, Shriver JF, Wallcraft AJ, Arnone RA. Sturges W, Lugo-Fernadez A, editors. Assessment of data assimilative ocean models in the Gulf of Mexico using ocean color. Circulation in the Gulf of Mexico: Observations and Models. 2005. pp. 87–100. AGU Monograph.
- Cummings JA. Operational Multivariate Ocean Data Assimilation. Q. J. Roy. Meteor. Soc. 2005;131:3583–3604. [Google Scholar]
- Diaz RJ, Rosenberg R. Marine benthic hypoxia: A review of its ecological effects and the behavioural responses of benthic macrofauna. Oceanogr. Mar. Biol. 1995;33:245–303. [Google Scholar]
- Dixon LK, Steidinger KA. Correlation of Karenia brevis presence in the eastern Gulf of Mexico and with rainfall and riverine flow. In: Steidinger KA, Landberg JH, Tomas CR, Vargo GA, editors. Harmful Algae 2002. UNESCO; 2004. pp. 29–31. [Google Scholar]
- Dortch Q, Moncreiff C, Mendenhall W, Parsons M, Franks J, Hemphill K. Spread of Gymnodinium breve into the Northern Gulf of Mexico. In: Reguera B, Blanco J, Fernandez ML, Wyatt T, editors. Harmful Algae. Xunta de Galicia and Intergovernmental Oceanographic Commission of UNESCO; Santiago de Compostela, Spain: 1998. pp. 143–144. [Google Scholar]
- d'Ovidio F, Fernández V, Hernández-Gracía E, López C. Mixing structures in the Mediterranean Sea from finite-size Lyapunov exponents. Geophys. Res. Lett. 2004;31:L17203. doi: 10.1029/2004GL020328. [Google Scholar]
- Enriquez C, Mariño-Tapia IJ, Herrera-Silveira JA. Dispersion in the Yucatan coastal zonal: Implications for red tide events. Cont. Shelf Res. 2010;30:127–137. [Google Scholar]
- Flewelling LJ, Naar JP, Abbott JP, Baden DG, Barros NB, Bossart GD, Bottein M-YD, Hammond DG, Haubold EM, Heil CA, Henry MS, Jacocks HM, Leighfield TA, Pierce RH, Pitchford TD, Rommel SA, Scott PS, Steidinger KA, Truby EW, Dolah FMV, Landsberg JH. Brevetoxicosis: Red tides and marine mammal mortalities. Nature. 2005;435:755–756. doi: 10.1038/nature435755a. [DOI] [PMC free article] [PubMed] [Google Scholar]
- Fox DN, Teague WJ, Barron CN, Carnes MR, Lee CM. The Modular Ocean Data Assimilation System (MODAS) J. Atmos. Ocean. Technol. 2002;19:240–252. [Google Scholar]
- Geesey M, Tester PA. Smayda TJ, Shimizu Y, editors. Gymnodinium breve: ubiquitous in Gulf of Mexico waters? Toxic Phytoplankton Blooms in the Sea. 1993. pp. 251–255.
- Gunter G, Smith FGW, Williams RH. Mass Mortality of Marine Animals on the Lower West Coast of Florida, November 1946–January 1947. Science. 1947;105:256–257. doi: 10.1126/science.105.2723.256-a. [DOI] [PubMed] [Google Scholar]
- Haller G. Distinguished material surfaces and coherent structures in 3D fluid flows. Physica D. 2001a;149:248–277. doi:10.1016/S0167-2789(00)00199-8. [Google Scholar]
- Haller G. Lagrangian Structures and the Rate of Starin in a Partition of Two-Dimensional Turbulence. Phys. Fluids. 2001b;13:3365–3385. [Google Scholar]
- Haller G. Lagrangian Coherent Structures from Approximate Velocity Data. Phys. Fluids. 2002;14:1851–1861. doi:10.1063/1.1477449. [Google Scholar]
- Haller G, Yuan G. Lagrangian Coherent Structures and Mixing in Two-Dimensional Turbulence. Physica D. 2000;147:352–370. [Google Scholar]
- Harper DE,J, McKinney LD, Salzer RR, Case RJ. The occurrence of hypoxic bottom water off the upper Texas coast and its effect on the benthic biota. Contrib. Mar. Sci. 1981;24:53–79. [Google Scholar]
- Hetland RD, Campbell L. Convergent blooms of Karenia brevis along the Texas coast. Geophys. Res. Lett. 2007;34:L19604. doi:10.1029/2007GL030474. [Google Scholar]
- Hetland RD, Ya Hsueh RRL, Niiler P. A loop current-induced jet along the edge of the West Florida Shelf. Geophys. Res. Lett. 1999;26:2239–2242. doi:10.1029/1999GL900463. [Google Scholar]
- Hu C, Muller-Karger FE, Taylor C, Carder KL, Kelbe C, Johns E, Heil CA. Red tide detection and tracing using MODIS fluorescence data: A regional example in SW Florida coastal waters. Remote Sens. Environ. 2005;97:311–321. doi: 10.1016/j.res.2005.05.013. [Google Scholar]
- Hu C, Muller-Karger FE, Swarzenski PW. Hurricane, submarine groundwater discharge, and Florida's red tides. Geophys. Res. Lett. 2006;33:L11601. doi:2005GL025449. [Google Scholar]
- Joseph B, Legras B. Relation Between Kinematic Boundaries, Stirring, and Barriers for the Antartic Polar Vortex. J. Atmos. Sci. 2002;59:1198–1212. [Google Scholar]
- Kirkpatrick B, Fleming LE, Squicciarini D, Backer LC, Clark R, Abraham W, Benson J, Cheng YS, Johnson D, Pierce R, Zaias J, Bossart GD, Baden DG. Literature Review of Florida Red Tide: Implications for Human Health Effects. Harmful Algae. 2004;3:99–115. doi: 10.1016/j.hal.2003.08.005. [DOI] [PMC free article] [PubMed] [Google Scholar]
- Kusek KM, Vargo G, Steidinger K. Gymnodinimum breve in the field, in the lab, and in the newspaper – A scientific and journalistic analysis of Florida red tides. Contri. Mar. Sci. 1999;34:1–229. [Google Scholar]
- Landsberg JH. The effects of harmful algal blooms on aquatic organisms. Rev. Fish. Sci. 2002;10:113–390. [Google Scholar]
- Landsberg JH, Steidinger KA. A historical review of Gymnodinium breve red tides implicated in mass mortalities of the manatee (Trichechus manatus Latirostris) in Florida, USA. In: Reguera B, Fernandez ML, Wyatt T, editors. Harmful Algae. Xunta de Galicia and Intergovernmental Oceanographic Commission of UNESCO; 1998. pp. 97–100. [Google Scholar]
- Lenes JM, Darrow BP,C, Cattrall CAH, Callahan M, Vargo GA, Byrne RH, Prospero JM, Bates DE, Fanning KA, Walsh JJ. Iron fertilization and the Trichodesmium response on the West Florida Shelf. Limnol. Oceanogr. 2001;46:1261–1277. [Google Scholar]
- Magaña HA, Contreras C, Villareal TA. A historical assessment of Karenia brevis in the western Gulf of Mexico. Harmful Algae. 2003;2:163–171. [Google Scholar]
- Ochoa JL. ENSO phenomenon and toxic red tides in Mexico. Geofis. Int. 2003;42:505–515. [Google Scholar]
- Olascoaga MJ, Rypina II, Brown MG, Beron-Vera FJ, Koçak H, Brand LE, Halliwell GR, Shay LK. Persistent transport barrier on the West Florida Shelf. Geophys. Res. Lett. 2006;33:L22603. doi: 10.1029/2006GL027800. doi:10.1029/2006GL027800. [DOI] [PMC free article] [PubMed] [Google Scholar]
- Olascoaga MJ, Beron-Vera FJ, Brand LE, Koçak H. Tracing the early development of harmful algal blooms on the West Florida Shelf with the aid of Lagrangian coherent structures. J. Geophys. Res. 2008;113:C12014. doi: 10.1029/2007JC004533. doi:10.1029/2007JC004533. [DOI] [PMC free article] [PubMed] [Google Scholar]
- Ortner PB, Lee TN, P. J. Milne RGZ, Clarke E,G, Podesta PKS, Tester PA, Atkinson LP, Johnson WR. Mississippi River flood waters that reached the Gulf Stream. J. Geophys. Res. 1995;100:13595–13601. [Google Scholar]
- Peacock T, Dabiri J. Introduction to Focus Issue: Lagrangian Coherent Structures. Chaos. 2010;20:017501. doi: 10.1063/1.3278173. doi:10.1063/1.3278173. [DOI] [PubMed] [Google Scholar]
- Romanou A, Chassignet EP. Gulf of Mexico circulation within a high-resolution numerical simulation of the North Atlantic Ocean. J. Geophys. Res. 2004;109:C01003. doi:10.1029/2003JC001770. [Google Scholar]
- Rounsefell GA, Nelson WR. Red Tide Research Summarized to 1964 Including an Annoted Bibliography. U.S. Fish Will. Serv. Spec. Sci. Rep. Fish. 535:85. [Google Scholar]
- Samelson RM, Wiggins S. Lagrangian Transport in Geophysical Jets and Waves. 2006. Springer.
- Scavia D, Rabalais NN, Turner RE, Justic D, Wiseman WJ., Jr. Predicting the response of Gulf of Mexico hypoxia to variations in Mississippi River nitrogen load. Limnol. Oceanogr. 2003;48:951–956. [Google Scholar]
- Shadden SC, Lekien F, Marsden JE. Definition and Properties of Lagrangian Coherent Structures from Finite-Time Lyapunov Exponents in Two-Dimensional Aperiodic Flows. Physica D. 2005;212:271–304. [Google Scholar]
- Shumway SE, Allen SM, Boersma PD. Marine birds and harmful algal blooms: sporadic victims or under-reported events? Harmful Algae. 2003;2:1–17. [Google Scholar]
- Stumpf RP, Litaker RW, Lanerolle L, Tester PA. Hydrodynamic accumulation of Karenia off the west coast of Florida. Cont. Shelf Res. 2008;28:189–213. [Google Scholar]
- Sturges W, Leben R. Frequency of ring separation from the Lopp Current in the Gulf of Mexico: A revised estimate. J. Phys. Oceanogr. 2000;30:1814–1819. [Google Scholar]
- Tester PA, Steidinger KA. Gymnodinium breve red tide blooms: Initiation, transport, and consequences of surface circulation. Limnol. Oceanogr. 1997;42:1039–1051. [Google Scholar]
- Turner RE, Rabalais NN. Coastal eutrophication near the Mississippi river delta. Nature. 1994;368:619–621. [Google Scholar]
- Walker ND, Wiseman WJ, Rouse LJ, Babin A. Effects of River Discharge, Wind Stress, and Slope Eddies on Circulation and the Satellite-Observed Structure of the Mississippi River Plume. J. Coastal Res. 2005;21:1228–1244. [Google Scholar]
- Walsh JJ, Steidinger KA. Saharan dust and Florida red tides: The cyanophyte connection. J. Geophys. Res. 2001;106:11597–11612. [Google Scholar]
- Walsh JJ, Weisberg RH, Dieterle DA, He R, Darrow BP, Jolliff JK, Lester KM, Vargo GA, Kirkpatrick GJ, Fanning KA, Sutton TT, Jochens AE, Biggs DC, Nababan B, Hu C, Muller-Karger FE. Phytoplankton response to intrusions of slope water on the West Florida Shelf: Models and observations. J. Geophys. Res. 2003;108:3190. doi:10.1029/2002JC001406. [Google Scholar]
- Walsh JJ, Jolliff JK, Darrow BP, Lenes JM, Milroy SP, Remsen A, Dieterle DA, Carder KL, Chen FR, Vargo GA, Weisberg RH, Fanning KA, Muller-Karger FE, Shinn E, Steidinger KA, Heil CA, Tomas CR, Prospero JS, Lee TN, Kirkpatrick GJ, Whitledge TE, Stockwell DA, Villareal TA, Jochens AE, Bontempi PS. Red tides in the Gulf of Mexico: Where, when, and why? J. Geophys. Res. 2006;111:C11003. doi: 10.1029/2004JC002813. doi:10.1029/2004JC002813. [DOI] [PMC free article] [PubMed] [Google Scholar]
- Wilson WB, Ray SM. The occurrence of Gymnodinium breve in the western Gulf of Mexico. Ecology. 1956;37:388. [Google Scholar]
- Yang H, Weisberg RH, Niiler PP, Sturges W, Johnson W. Lagrangian Circulation and Forbidden Zone on the West Florida Shelf. Cont. Shelf. Res. 1999;19:1221–1245. [Google Scholar]
- Zavala-Hidalgo J, Morey SL, O'Brien JJ, Zamudio L. On the Loop Current eddy shedding variability. Atmósfera. 2006;19:41–48. [Google Scholar]


