

Abstract
Purpose
To measure accuracy and speed for detection of vascular progression in retinopathy of prematurity (ROP) from serial images. Two strategies are compared: static side-by-side presentation vs. dynamic flickering of superimposed image pairs.
Design
Prospective comparative study.
Methods
Fifteen de-identified, wide-angle retinal image pairs were taken from infants who eventually developed plus disease. Image pairs representing vascular disease progression were taken ≥1 week apart, and control images without progression were taken on same day. Dynamic flickering pairs were created by digital image registration. Ten experts independently reviewed each image pair on a secure website using both strategies, and were asked to identify progression or state that images were identical. Accuracy and speed were measured, using examination date and ophthalmoscopic findings as a reference standard.
Results
Using static images, experts were accurate in a mean (%) ± standard deviation (SD) of 11.4/15 (76%) ± 1.7 image pairs. Using dynamic flickering images, experts were accurate in a mean (%) ± SD of 11.3/15 (75%) ± 1.7 image pairs. There was no significant difference in accuracy between these strategies (p=0.420). Diagnostic speed was faster using dynamic flickering (24.7±8.3 seconds) versus static side-by-side images (40.3±18.3 seconds) (p=0.002). Experts reported higher confidence when interpreting dynamic flickering images (p=0.001).
Conclusions
Retinal imaging provides objective documentation of vascular appearance, with potentially improved ability to recognize ROP progression compared to standard ophthalmoscopy. Speed of identifying vascular progression was faster by review of dynamic flickering image pairs than by static side-by-side images, although there was no difference in accuracy.
Keywords: retinopathy of prematurity, retina, pediatric ophthalmology, image analysis, medical informatics
INTRODUCTION
Retinopathy of prematurity (ROP) is a leading cause of childhood blindness throughout the world.1,2 In the United States, the incidence of ROP is over 65% in infants with birth weight <1,251 grams, resulting in an estimated 600 cases of infancy-acquired blindness annually.3–6 Meanwhile, the number of infants at risk for ROP continues to rise as neonatal survival rates improve. Standard ROP management includes dilated ophthalmoscopic examination at the neonatal intensive care unit bedside, with hand-drawn sketches to document retinal findings.7
An international classification system has standardized the clinical diagnosis of ROP. One component of this classification system is plus disease, which is defined as arteriolar tortuosity and venous dilation within the posterior pole.8,9 The multi-center Cryotherapy for ROP (CRYO-ROP) and Early Treatment for ROP (ETROP) studies have established that presence of plus disease warrants treatment with cryotherapy or laser photocoagulation.9,10 Accurate assessment of plus disease is therefore essential for ROP management. Moreover, the 2005 revised international classification of ROP defined an intermediate “pre-plus” condition.11 These facts underscore that ROP represents a spectrum of retinal vascular abnormalities, and that identification of vascular progression toward plus disease is critical for management.
However, vascular disease progression in ROP is often difficult to recognize with precision during serial ophthalmoscopic examinations. In particular, standard methods of documentation using retinal drawings are qualitative and imprecise regarding the appearance of retinal vessels, as well as the nature and location of peripheral disease. This essentially forces examiners to rely on memory to recognize changes in appearance, and creates problems when serial examinations are performed by different ophthalmologists. In addition, studies have shown that plus disease diagnosis may in itself be subjective, even by experts.12–15
Digital retinal photography has potential to improve ROP management by objective documentation of retinal findings, by identification of disease progression toward plus disease through comparison with images from previous examinations, and by creating opportunities for remote telemedicine diagnosis and second opinions from experts throughout the world.16–25 The ability to recognize vascular changes accurately and quickly would provide important advantages over traditional methods using serial ophthalmoscopy. The purpose of this study is to investigate the accuracy and speed of identifying progression in severity of retinal vascular changes from serial images of infants who eventually developed plus disease. Specifically, two strategies for comparing serial images are compared: (1) side-by-side static image pairs; and (2) dynamic flickering image pairs generated by digital image registration, in which the images are aligned to overlay one another under the premise that this may improve recognition of subtle retinal vascular changes.26
METHODS
Image Selection and Processing
Images were captured during routine ROP ophthalmoscopic examinations from 2005–2010 at Columbia University and Weill Cornell Medical Center. Retinal images were obtained using a commercially-available camera (RetCam; Clarity Medical Systems, Pleasanton, CA) by a trained neonatal nurse, vitreoretinal fellow, or attending ophthalmologist on the same days that ophthalmoscopic examinations were performed. A set of 15 de-identified wide-angle retinal image pairs from infants who eventually developed plus disease as diagnosed by an expert ROP examiner (RVPC, MFC) were selected for the study. Image pairs representing plus disease progression were taken at least 1 week apart. Vascular disease progression did not require a change from “pre-plus” to “plus” (or “neither pre-plus nor plus” to “pre-plus”) by clinical diagnosis to be included in the study. In other words, “vascular disease progression” was defined for study purposes as any interval change in infants who were eventually diagnosed with plus disease during routine clinical ophthalmoscopic examination. Image pairs representing “controls” with no vascular disease progression were taken on the same day.
The same 15 image pairs were presented as two side-by-side static images and dynamic flickering images (Figure 1 and Supplemental Video 1 available at AJO.com). Dynamic flickering image pairs were created using digital registration software, which aligned serial photographs to the sub-pixel level using an algorithm to identify features such as the intersections of vessels and other corresponding peripheral retinal features (MatchedFlicker V1.2; EyeIC, Narberth, PA).26,27 Dynamic images were displayed at a flicker rate of 2 Hertz.
Figure 1. Examples of identifying retinopathy of prematurity vascular disease progression from static side-by-side image pairs.
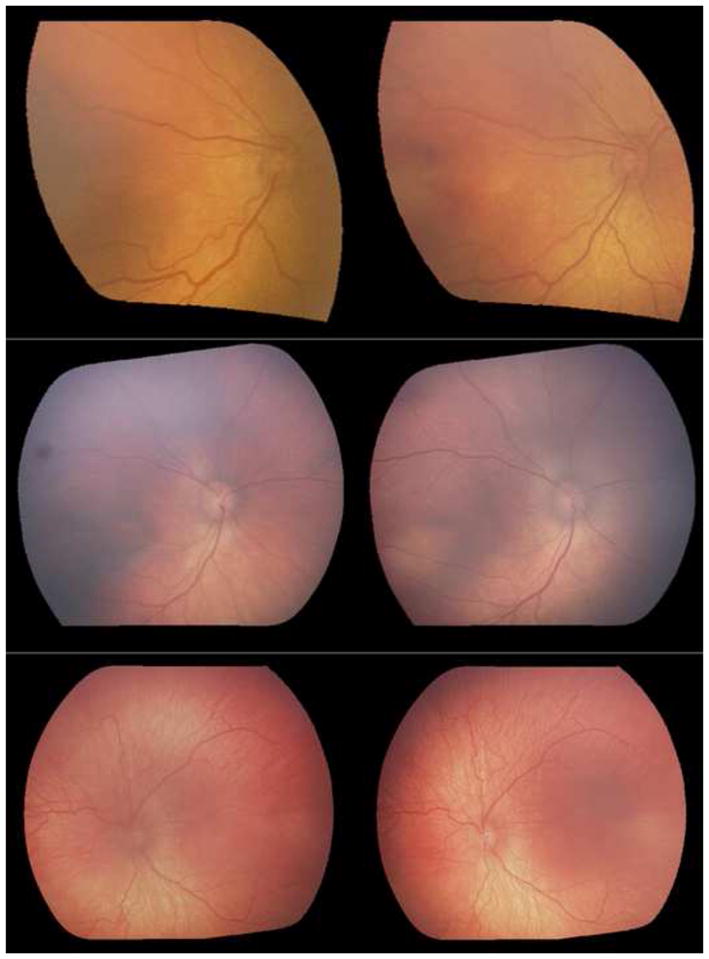
Serial image pairs were taken from infants who eventually developed plus disease, and the reference standard was based on defining the more severe image as the one taken on the later date. (Top left and top right) 10/10 (100%) experts responded correctly that top left was more severe. (Middle left and middle right) 5/10 (50%) experts responded correctly that middle right was more severe. (Bottom left and bottom right) 9/10 (90%) experts responded correctly that images showed no disease progression.
Image Interpretation by Study Participants
Eligible expert study participants were defined as practicing pediatric ophthalmologists or retina specialists who met at least one of three criteria: having been a study center principal investigator for the CRYO-ROP or ETROP studies, having been a certified investigator for either study, or having coauthored five or more peer-reviewed ROP manuscripts.
All images were uploaded to a secure web server. A web interface developed by the authors was used to display retinal images and collect responses, which were recorded to a secure database system (SQL Server 2005; Microsoft, Redmond, WA). Each participant who agreed to provide informed consent was given an electronic link to the study website, along with an individual secure login and password.
Participants were oriented to the study website with a 1-page instruction guide developed by the authors. ROP experts independently reviewed each image pair on the study website. The 15 image pairs were initially presented sequentially as side-by-side static images, and subsequently as dynamic flickering image pairs in the same sequence. After each image pair was displayed, participants were asked to provide one of three mutually exclusive responses with regard to ROP vascular progression toward plus disease (i.e., severity of vascular dilation and tortuosity): “image 1 is more severe,” “image 2 is more severe,” or “images 1 and 2 are from the same day and show exactly the same severity.” The reference standard for vascular disease progression was based on defining the more “severe” image as the one taken on the later date by both expert ROP examiners (RVPC, MFC), since all eyes included in the study were eventually diagnosed with plus disease during routine clinical ophthalmoscopic examination by one of two ROP examiners (RVPC, MFC).
To analyze speed, the participant response times for each static or dynamic image pair were recorded using a computer timestamp that was incorporated into the study website. Time measurement began when each new website page was loaded to display an image pair, and ended when the expert participant clicked “submit” to finalize his or her response. Finally, experts were asked to report their confidence (“confident,” “somewhat confident,” or “not confident”) for identifying the more severe image in each static or dynamic pair.
Data Analysis
Accuracy of detecting vascular progression of ROP disease severity, or recognizing that there was no progression because images were identical, was measured by comparing responses to the examination date sequence. The numbers of correctly graded image pairs for progression of ROP disease severity were compared between the static side-by-side image pairs and the dynamic flickering image pairs for each expert participant. Grading times and confidence scores for detecting vascular disease progression were compared for static side-by-side image pairs versus dynamic flickering image pairs.
Statistical software was used for data analysis (Excel 2008, Microsoft, Redmond, WA; SPSS 15.0, SPSS Inc, Chicago, IL). Comparisons between static side-by-side image pairs and dynamic flickering image pairs in evaluating ROP vascular progression were analyzed using the paired sample t-test, and confidence scores were analyzed using the Pearson chi-square test. Statistical significance was considered to be a two-sided P value <0.05.
RESULTS
Expert Participants and Overview of Responses
A total of 10 expert participants completed the web-based study. Seven (70%) out of the 10 experts were study center principal investigators for the CRYO-ROP or ETROP studies, 3/10 (30%) were certified investigators for either study, and 6/10 (60%) coauthored five or more peer-reviewed ROP papers. Examples of expert responses to interpreting vascular disease progression in static side-by-side and dynamic flickering image pairs are shown in Figure 1 and Supplemental Video 1 (available at AJO.com).
Accuracy
Table 1 summarizes the accuracy of determining ROP progression, or recognizing that there was no change in the images, among the 10 expert participants. For static side-by-side image pairs, experts made an accurate response in a mean (%) ± standard deviation (SD) of 11.4 (76%) ± 1.7 out of 15 image pairs. For dynamic flickering image pairs, experts made an accurate response in a mean (%) ± SD of 11.3 (75%) ± 1.7 out of 15 image pairs. There was no statistically significant difference in the accuracy of identifying progression of ROP disease severity between these two strategies (p=0.420, paired t-test).
Table 1.
Accuracy of responses by 10 expert participants for detecting retinopathy of prematurity (ROP) vascular disease progression using static side-by-side versus dynamic flickering image pairs.*
| Participant | Accuracy of Responses (%)
|
|
|---|---|---|
| Static side-by-side | Dynamic flickering | |
| 1 | 10/15 (67%) | 11/15 (73%) |
| 2 | 12/15 (80%) | 13/15 (87%) |
| 3 | 13/15 (87%) | 13/15 (87%) |
| 4 | 13/15 (87%) | 13/15 (87%) |
| 5 | 12/15 (80%) | 10/15 (67%) |
| 6 | 11/15 (73%) | 9/15 (60%) |
| 7 | 10/15 (67%) | 9/15 (60%) |
| 8 | 14/15 (93%) | 13/15 (87%) |
| 9 | 10/15 (67%) | 10/15 (67%) |
| 10 | 9/15 (60%) | 12/15 (80%) |
|
| ||
| Mean (%) ± SD | 11.4 (76%) ± 1.7 | 11.3 (75%) ± 1.7 |
Serial image pairs were taken from infants who eventually developed plus disease, and the reference standard was based on a diagnosis of more severity in retinal vascular changes in the image taken on the later date by both expert ROP examiners (MFC, RVPC). There was no statistically significant difference between static and dynamic image presentation strategies (p=0.420, paired t-test).
Examined another way, there were 150 corresponding pairs of 15 images that were interpreted by 10 expert participants. Among these corresponding image pair interpretations, 96/150 (64%) were accurately graded for progression of ROP disease severity by both the static side-by-side and dynamic flickering strategies, whereas 19/150 (13%) were not graded accurately by either strategy. Approximately equal numbers of image pairs were graded correctly by one strategy but incorrectly by the other strategy: only the static strategy was correct in 18/150 (12%), and only the dynamic strategy was correct in 17/150 (11%).
Speed and Confidence
Table 2 summarizes the speed of determining ROP progression, or recognizing that there was no change in the images, among the 10 expert participants. For static side-by-side image pairs, the mean ± SD (range) response time was 40.3 ± 18.3 (16–86) seconds. For dynamic flickering image pairs, the mean ± SD (range) response time was 24.7 ± 8.3 (15–44) seconds. Overall, diagnostic speed was significantly faster by interpretation of dynamic flickering image pairs than by interpretation of static side-by-side image pairs (p=0.002, paired t-test).
Table 2.
Speed of responses by 10 expert participants for detection retinopathy of prematurity vascular disease progression using static side-by-side versus dynamic flickering image pairs.*
| Participant | Mean response time (seconds)
|
|
|---|---|---|
| Static side-by-side | Dynamic flickering | |
| 1 | 52 | 28 |
| 2 | 43 | 24 |
| 3 | 26 | 19 |
| 4 | 46 | 22 |
| 5 | 36 | 21 |
| 6 | 36 | 28 |
| 7 | 16 | 15 |
| 8 | 39 | 28 |
| 9 | 86 | 44 |
| 10 | 26 | 18 |
|
| ||
| Mean (SD) | 40.3 (18.3) | 24.7 (8.3) |
Response times were measured by computer timestamps in a web-based image review system. Diagnostic speed was significantly faster by interpretation of dynamic flickering image pairs than by interpretation of static side-by-side image pairs (p=0.002, paired t-test).
With regard to confidence in determining ROP progression by static side-by-side compared to dynamic flickering images, there were 150 corresponding image pairs interpreted by the 10 expert participants. By interpretation of static side-by-side images, 87/150 (58%) experts were confident, 52/150 (35%) were somewhat confident, and 11/150 (7%) were not confident in recognizing disease progression. By interpretation of dynamic flickering image pairs, 116/150 (77%) experts were confident, 31/150 (21%) were somewhat confident, and 3/150 (2%) were not confident in recognizing disease progression. The difference in these confidence level distributions was statistically significant (p=0.001, chi-square test).
DISCUSSION
Retinal imaging allows objective documentation of examination findings, as well as comparison with old images to identify changes in ways that are not feasible using standard retinal drawings. Limited published research has systematically analyzed the identification of vascular disease progression using image interpretation. In this study, we examine the ability of experts to identify vascular disease progression toward plus disease, or to recognize absence of any vascular change, using static side-by-side image pairs compared to dynamic flickering image pairs created by image registration software. The key findings from this study are that: (1) The speed and confidence in identifying vascular disease progression were significantly better using dynamic flickering image pairs than using static side-by-side image pairs, and (2) There were no significant differences in accuracy of identifying disease progression using either strategy.
Recognizing the presence or absence of progression of vascular abnormality toward plus disease is critical for clinical ROP management. Based on the CRYO-ROP and ETROP studies, plus disease is sufficient to define severe ROP with high likelihood of retinal detachment and blindness without prompt treatment.9,10 Furthermore, there is growing recognition that retinal vascular changes in ROP occur over a spectrum of abnormality, and that vascular changes insufficient for plus disease have utility in identifying infants at highest risk for progression to sight-threatening disease.28–35 Faster rates of change in retinal vascular tortuosity and dilation have also been found to be prognostic indicators for progression to clinically-significant ROP.28,30,33,35 Therefore, the ability to recognize earlier vascular changes (e.g. along the spectrum of pre-plus disease)35 accurately and quickly using static or dynamic comparison of retinal images may provide advantages in clinical management compared to traditional care using serial indirect ophthalmoscopy with retinal drawings.
In this study, expert participants correctly identified vascular disease progression toward plus disease in 64% of image pair interpretations using both static side-by-side and dynamic flickering presentation of image pairs. In the remaining 36% of cases, experts incorrectly interpreted vascular disease progression in either or both static and dynamic presentations. Although this rate appears somewhat high, we suspect the ability of experts to identify progression of vascular changes using standard serial ophthalmoscopy would be even poorer because examiners would be forced to rely on retinal drawings and recollection of details from previous vascular appearance. This latter issue has never been systematically studied to our knowledge, and may warrant future research. Finally, we note that photographic documentation of ROP findings provides opportunities not only for comparison of serial images by experts, but also for objective quantification of retinal vascular parameters such as tortuosity and dilation using computer-based image analysis methods. Previous studies have suggested that semi-automated image analysis may identify plus disease with comparable or better accuracy than experts.36–40 These quantitative techniques may provide a future method for reproducibly and precisely identifying disease progression from retinal photographs.
Interpretation of dynamic flickering images created by registration of superimposed serial images might be expected to improve recognition of vascular change by highlighting areas of disease progression. For example, it has been shown that humans fail or are delayed in detecting change between two similar images when the images are separated by blank screens, blinks, or saccades, a phenomenon known as “change blindness.” The ability to detect changes increases when the images are flickered back and forth without these disturbances.41–45 However, the current study found no benefit in accuracy of dynamic flickering images over interpretation of side-by-side static images (Table 1). Previous studies have compared static side-by-side images and dynamic flickering images for detection of glaucomatous optic disc damage. In those previous studies, detection of disc hemorrhages and peripapillary atrophy showed increased sensitivity with flickering images, while detection of change in glaucomatous optic nerve head progression showed similar inter-grader agreement between techniques.26,27,46–49 However, with dynamic flickering images, assessments were driven more by blood vessel movements, while assessments of static side-by-side stereophotography were driven more by the appearance of disc hemorrhages.26 It is possible that in the current study, experts may have been assessing different features depending on which image strategy was used. Future studies to investigate which features are being assessed between the two methods may help to improve accuracy for detection of change in ROP severity.
Response times with dynamic flickering image pairs in this study were significantly faster than with static side-by-side image pairs. Presumably this was due to the increased efficiency of assessing even subtle vascular changes with aligned serial images, although it is unclear whether this increased response time would have any practical significance. Additionally, experts were more confident about their responses for evaluating progression of ROP disease severity when viewing dynamic flickering images (confident on 77% of dynamic flickering image pairs vs. 58% of static side-by-side image pairs). There was no clear relationship among improved speed, confidence, and accuracy in this study, and the underlying factors relating these outcome measures may warrant further research. From a practical standpoint, a 2006 survey commissioned by the American Academy of Ophthalmology found that only half of pediatric ophthalmologists and retinal specialists are currently willing to manage ROP and over 20% of them plan to stop in the near future.50 Many cited time, logistical difficulties and medicolegal liability as concerns. Image-based ROP diagnosis using telemedicine has been shown to be significantly faster than standard ophthalmoscopic bedside diagnosis.51 Digital registration with dynamic image flickering may provide a practical mechanism for improving the speed and efficiency of ROP management, while maintaining the accuracy and quality of diagnosis.18,19,52
Several study limitations should be noted: (1) Several of the image pairs demonstrated very subtle vascular progression that may have been difficult to distinguish from control images showing no change (Figure 1 and Supplemental Video 1 available at AJO.com). This may have contributed toward lower accuracy of expert responses. All image pairs selected for this study to represent retinal vascular disease progression were diagnosed as eventually progressing to plus disease during serial clinical ophthalmoscopic examinations by the authors (RVPC, MFC). The amount of vascular disease progression between serial study images did not necessarily correspond to distinctions between “pre-plus” and “plus” (or “neither pre-plus nor plus” and “pre-plus). However, this decision to include subtle and potentially difficult comparisons was made in order to better distinguish between the discriminative abilities of static vs. dynamic image presentation strategies, and we do not believe that this would have systematically biased against either strategy. (2) This study examined only pairs of images. This decision was made to simplify the display and interpretation of both static and dynamic images. As a result, the findings may not be generalizable to real-world situations that might involve interpretation of multiple serial images to identify vascular disease progression. Future research examining disease progression of larger numbers of images over longer periods of time may be informative. (3) Study images displayed only the optic disc and posterior retinal vessels, without including any peripheral ROP features. This decision was made to focus the study on identification of change in vascular dilation and tortuosity, and to avoid confounding factors from recognition of peripheral ROP progression. Future studies examining progression of peripheral ROP using similar methods may highlight other benefits of static and dynamic image interpretation. (4) Study images were not paired with corroborative clinical diagnoses (e.g. “pre-plus”); instead vascular disease progression was defined based on the image taken later in infants who were eventually diagnosed with plus disease during clinical ophthalmoscopic examination. This decision was made because we believe that there is no standard method to define, quantify, and compare the amount of vascular abnormality in an image, and because incorporating clinical diagnoses such as “pre-plus” disease would complicate data analysis because of inter-observer variability. However, this raises the possibility that other features of digital retinal images could cause them to appear different in the absence of true “progression.” For example, image registration artifacts or differences in camera angle may influence interpretation of changes in vessel appearance.26 Although these serial images may still be aligned using digital registration algorithms, dynamic viewing might enhance visualization of parallax vessel changes. These effects may have created difficulty in distinguishing between image pairs with subtle vascular changes and control images with no vascular changes. With more experience at evaluating progression of ROP disease with digital image registration, this problem may improve. (5) Capture of retinal images requires additional time and cost, which were not factored into the study analysis. Although studies have demonstrated that wide-angle retinal imaging for purposes of telemedicine management is faster and more cost-effective than standard ophthalmoscopic examination,51,53 additional work in these areas may be warranted.
In summary, the ability to recognize vascular progression toward plus disease in ROP is important for clinical disease management, and may guide follow-up and management decisions. Retinal photography provides a mechanism for documentation of examination findings with greater objectivity and precision than with traditional retinal drawings. This study demonstrates that comparison of current images with previous ones can be an accurate way to identify vascular progression, and that interpretation of side-by-side vs. dynamic flickering image pairs had comparable accuracy. Expert study participants made faster diagnoses with greater confidence while reviewing dynamic flickering images, suggesting that future research involving digital image registration has potential to improve clinical ROP diagnosis and management.
Supplementary Material
Serial image pairs were taken from infants who eventually developed plus disease, and the reference standard was based on defining the more severe image as the one taken on the later date. (Top) 8/10 (80%) experts identified the more severe image (frame “A”) correctly. (Middle) 7/10 (70%) experts identified the more severe image (frame “A”) correctly. (Bottom) 10/10 (100%) experts responded correctly that images showed no disease progression.
Acknowledgments
Funding and Support: Supported by Career Development Award from Research to Prevent Blindness (MFC), by grant EY19474 from the National Institutes of Health, Bethesda, MD (MFC); by the St. Giles Foundation (RVPC); by departmental grants from Research to Prevent Blindness (RVPC, NMR, JSM, GDA, MFC); and by a grant from the Friends of Doernbecher foundation (MFC).
Other acknowledgements: We would like to acknowledge each of the expert participants for their contribution to this study.
Biographies
Jane S. Myung graduated from her vitreoretinal fellowship in June 2011 from Weill-Cornell Medical Center. She completed her residency training at New York University in June 2009, and her medical school training at the University of Iowa in May 2005. She is currently in private practice in New York City. She enjoys clinical teaching, and will continue to be involved in resident and fellow training.

Michael F. Chiang is Knowles Professor of Ophthalmology & Medical Informatics and Clinical Epidemiology at Oregon Health & Science University. His research involves telemedicine, image analysis, and electronic health record systems. Dr. Chiang received a B.S. in Electrical Engineering and Biology from Stanford University, an M.D. from Harvard Medical School and Harvard-MIT Division of Health Sciences and Technology, and an M.A. in Biomedical Informatics from Columbia University. He completed residency and pediatric ophthalmology fellowship training at the Johns Hopkins Wilmer Eye Institute.

Footnotes
Supplemental Material available at AJO.com
DISCLOSURE
Financial Disclosures: MFC is an unpaid member of the Scientific Advisory Board for Clarity Medical Systems (Pleasanton, CA). The authors have no commercial, proprietary, or financial interest in any of the products or companies described in this article.
Statement about Conformity with Author Information: This research was approved by the Institutional Review Board from Columbia University Medical Center and Weill Cornell Medical Center, and included a waiver of consent for use of de-identified retinal images. Informed consent was obtained from all expert study participants. All research was performed in compliance with the Health Insurance Portability and Accountability Act of 1996, and adhered to the tenets of the Declaration of Helsinki.
Contributions of Authors: Conception and design (MFC, RVPC, NMR, JSM, GDA); Analysis and interpretation (MFC, RVPC, NMR, JSM, RG, GDA); Writing the article (MFC, JSM); Critical revision of the article (MFC, RVPC, NMR, JSM, RG, GDA); Final approval of the article (MFC, RVPC, NMR, JSM, RG, GDA); Data Collection (MFC, JSM, RG, GDA); Provision of materials, patients, or resources (MFC, RVPC, NMR, RG); Statistical expertise (MFC, RVPC, RG, JSM); Obtaining funding (MFC, RVPC); Literature search (MFC, RVPC, JSM); Administrative, technical, or logistic support (MFC, RVPC, NMR, RG).
Publisher's Disclaimer: This is a PDF file of an unedited manuscript that has been accepted for publication. As a service to our customers we are providing this early version of the manuscript. The manuscript will undergo copyediting, typesetting, and review of the resulting proof before it is published in its final citable form. Please note that during the production process errors may be discovered which could affect the content, and all legal disclaimers that apply to the journal pertain.
References
- 1.Munoz B, West SK. Blindness and visual impairment in the Americas and the Carribean. Br J Ophthalmol. 2002;86(5):498–504. doi: 10.1136/bjo.86.5.498. [DOI] [PMC free article] [PubMed] [Google Scholar]
- 2.Gilbert C, Foster A. Childhood blindness in the context of VISION 2020: the right to sight. Bull World Health Organ. 2001;79(3):227–232. [PMC free article] [PubMed] [Google Scholar]
- 3.Palmer EA, Flynn JT, Hardy RJ, et al. Incidence and early course of retinopathy of prematurity: The Cryotherapy for Retinopathy of Prematurity Cooperative Group. Ophthalmology. 1991;98(11):1628–1640. doi: 10.1016/s0161-6420(91)32074-8. [DOI] [PubMed] [Google Scholar]
- 4.Good WV, Hardy RJ, Dobson V, et al. The incidence and course of retinopathy of prematurity: Findings from the early treatment for retinopathy of prematurity study. Pediatrics. 2005;116(1):15–23. doi: 10.1542/peds.2004-1413. [DOI] [PubMed] [Google Scholar]
- 5.Lad EM, Hernandez-Boussard T, Morton JM, Moshfeghi DM. Incidence of retinopathy of prematurity in the United States: 1997 through 2005. Am J Ophthalmol. 2009;148(3):451–458. doi: 10.1016/j.ajo.2009.04.018. [DOI] [PubMed] [Google Scholar]
- 6.National Eye Institute. [Accessed May 6, 2011];Facts about retinopathy of prematurity. Available at http://www.nei.nih.gov/health/rop.
- 7.Section on Ophthalmology, American Academy of Pediatrics, American Academy of Pediatric Ophthalmology and American Association for Pediatric Ophthalmology and Strabismus. Screening examination of premature infants for retinopathy of prematurity. Pediatrics. 2006;117(2):572–576. doi: 10.1542/peds.2005-2749. [DOI] [PubMed] [Google Scholar]
- 8.The Committee for the Classification of Retinopathy of Prematurity. An International classification of retinopathy of prematurity. Arch Ophthalmol. 1984;102(8):1130–1134. doi: 10.1001/archopht.1984.01040030908011. [DOI] [PubMed] [Google Scholar]
- 9.Cryotherapy for Retinopathy of Prematurity Cooperative Group. Multicenter trial of cryotherapy for retinopathy of prematurity: preliminary results. Arch Ophthalmol. 1988;106(4):471–479. doi: 10.1001/archopht.1988.01060130517027. [DOI] [PubMed] [Google Scholar]
- 10.Early Treatment for Retinopathy of Prematurity Cooperative Group. Revised indications for the treatment of retinopathy of prematurity: results of the early treatment for retinopathy of prematurity randomized trial. Arch Ophthalmol. 2003;121(12):1684–1694. doi: 10.1001/archopht.121.12.1684. [DOI] [PubMed] [Google Scholar]
- 11.International Committee for the Classification of Retinopathy of Prematurity. The International Classification of Retinopathy of Prematurity revisited. Arch Ophthalmol. 2005;123(7):991–999. doi: 10.1001/archopht.123.7.991. [DOI] [PubMed] [Google Scholar]
- 12.Chiang MF, Jiang L, Gelman R, et al. Interexpert agreement of plus diagnosis in retinopathy of prematurity. Arch Ophthalmol. 2007;125(7):875–880. doi: 10.1001/archopht.125.7.875. [DOI] [PubMed] [Google Scholar]
- 13.Gelman R, Jiang L, Du YE, Martinez-Perez ME, Flynn JT, Chiang MF. Plus disease in retinopathy of prematurity: Pilot study of computer-based and expert diagnosis. J AAPOS. 2007;11(6):532–540. doi: 10.1016/j.jaapos.2007.09.005. [DOI] [PMC free article] [PubMed] [Google Scholar]
- 14.Reynolds JD, Dobson V, Quinn GE, et al. Evidence-based screening criteria for retinopathy of prematurity: natural history data from the CRYO-ROP and LIGHT-ROP studies. Arch Ophthalmol. 2002;120:1470–6. doi: 10.1001/archopht.120.11.1470. [DOI] [PubMed] [Google Scholar]
- 15.Wallace DK, Quinn GE, Freedman SF, Chiang MF. Agreement among pediatric ophthalmologists in diagnosing plus and pre-plus disease in retinopathy of prematurity. J AAPOS. 2008;12(4):352–356. doi: 10.1016/j.jaapos.2007.11.022. [DOI] [PMC free article] [PubMed] [Google Scholar]
- 16.Ells AL, Holmes JM, Astle WF, et al. Telemedicine approach to screening for severe retinopathy of prematurity: a pilot study. Ophthalmology. 2003;110(11):2113–7. doi: 10.1016/S0161-6420(03)00831-5. [DOI] [PubMed] [Google Scholar]
- 17.Wu C, Petersen RA, Vanderveen DK. RetCam imaging for retinopathy of prematurity screening. J AAPOS. 2006;10:107–11. doi: 10.1016/j.jaapos.2005.11.019. [DOI] [PubMed] [Google Scholar]
- 18.Chiang MF, Wang L, Busuioc M, et al. Telemedical retinopathy of prematurity diagnosis: accuracy, reliability, and image quality. Arch Ophthalmol. 2007;125(11):1531–8. doi: 10.1001/archopht.125.11.1531. [DOI] [PubMed] [Google Scholar]
- 19.Scott KE, Kim DY, Wang L, et al. Telemedical diagnosis of retinopathy of prematurity intraphysician agreement between ophthalmoscopic examination and image-based interpretation. Ophthalmology. 2008;115(7):1222–8. doi: 10.1016/j.ophtha.2007.09.006. [DOI] [PubMed] [Google Scholar]
- 20.Balasubramanian M, Capone A, Hartnett ME, et al. The photographic screening for retinopathy of prematurity study (Photo-ROP): Primary Outcomes. Retina. 2008;28(3):S47–S54. doi: 10.1097/IAE.0b013e31815e987f. [DOI] [PubMed] [Google Scholar]
- 21.Lorenz B, Spasovska K, Elfein H, Schneider N. Wide-field digital imaging based telemedicine for screening for acute retinopathy of prematurity (ROP). Six-year results of a multicentre field study. Graefes Arch Clin Exp Ophthalmol. 2009;247:1251–62. doi: 10.1007/s00417-009-1077-7. [DOI] [PMC free article] [PubMed] [Google Scholar]
- 22.Silva RA, Murakami Y, Lad EM, Moshfeghi DM. Stanford University Network for Diagnosis of Retinopathy of Prematurity (SUNDROP): 36-month experience with telemedicine screening. Ophthalmic Surg Lasers Imaging. 2011;42:12–9. doi: 10.3928/15428877-20100929-08. [DOI] [PubMed] [Google Scholar]
- 23.Dai S, Chow K, Vincent A. Efficacy of wide-field digital retinal imaging for retinopathy of prematurity screening. Clin Experiment Ophthalmol. 2011;39:23–9. doi: 10.1111/j.1442-9071.2010.02399.x. [DOI] [PubMed] [Google Scholar]
- 24.Freedman SF, Klystra JA, Capowski JJ, Realini TD, Rich C, Hunt D. Observer sensitivity to retinal vessel diameter and tortuosity in retinopathy of prematurity: a model system. J Pediatr Ophthalmol Strabismus. 1996;33(4):248–254. doi: 10.3928/0191-3913-19960701-10. [DOI] [PubMed] [Google Scholar]
- 25.Wallace DK, Freedman SF, Zhao Z. Evolution of plus disease in retinopathy of prematurity: Quantification by ROPtool. Trans Am Ophthalmol Soc. 2009;107:47–54. [PMC free article] [PubMed] [Google Scholar]
- 26.Radcliffe NM, Sehi M, Wallace IB, Greenfield DS, Krupin T, Ritch R. Comparison of stereo disc photographs and alternation flicker using a novel matching technology for detecting glaucoma progression. Ophthalmic Surg Lasers Imaging. 2010;41(6):629–634. doi: 10.3928/15428877-20100830-02. [DOI] [PubMed] [Google Scholar]
- 27.Syed ZA, Radcliffe NM, Gustavo De Moraes C, Liebmann JM, Ritch R. Detection of progressive glaucomatous optic neuropathy using automated alternation flicker with stereophotography. Arch Ophthalmol. 2011;129(4):521–522. doi: 10.1001/archophthalmol.2010.310. [DOI] [PubMed] [Google Scholar]
- 28.Grunwald L, Mills MD, Johnson KS, Karp KA, Quinn GE, Ying G, Grunwald JE. The rate of retinal vessel dilation in severe retinopathy of prematurity requiring treatment. Am J Ophthalmol. 2009;147(6):1086–1091. doi: 10.1016/j.ajo.2008.12.038. [DOI] [PubMed] [Google Scholar]
- 29.Heneghan C, Flynn J, O’Keefe M, Cahill M. Characterization of change in blood vessel width and tortuosity in retinopathy of prematurity using image analysis. Med Image Anal. 2002;6(4):407–429. doi: 10.1016/s1361-8415(02)00058-0. [DOI] [PubMed] [Google Scholar]
- 30.Wallace DK, Klystra JA, Chesnutt DA. Prognostic significant of vascular dilation and tortuosity insufficient for plus disease in retinopathy of prematurity. J AAPOS. 2000;4(4):224–229. doi: 10.1067/mpa.2000.105273. [DOI] [PubMed] [Google Scholar]
- 31.Wallace DK. Computer-assisted quantification of vascular tortuosity in retinopathy of prematurity (an American Ophthalmological Society thesis) Trans Am Ophthalmol Soc. 2007;105:594–615. [PMC free article] [PubMed] [Google Scholar]
- 32.Schaffer DB, Palmer EA, Plotsky DF, et al. Prognostic factors in the natural course of retinopathy of prematurity. The Cryotherapy for Retinopathy of Prematurity Cooperative Group. Ophthalmology. 1993;100(2):230–237. doi: 10.1016/s0161-6420(93)31665-9. [DOI] [PubMed] [Google Scholar]
- 33.Thyparampil PJ, Park Y, Matinez-Perez ME, et al. Plus disease in retinopathy of prematurity: Quantitative analysis of vascular change. Am J Ophthalmol. 2010;150(4):468–475. doi: 10.1016/j.ajo.2010.04.027. [DOI] [PMC free article] [PubMed] [Google Scholar]
- 34.Rabinowitz MP, Grunwald JE, Karp KA, et al. Progression to severe retinopathy of prematurity predicted by retinal vessel diameter between 31 and less than 34 weeks of postconception age. Arch Ophthalmol. 2007;125(11):1495–1500. doi: 10.1001/archopht.125.11.1495. [DOI] [PubMed] [Google Scholar]
- 35.Wallace DK, Freedman SF, Hartnett ME, Quinn GE. Predictive value of pre-plus disease in retinopathy of prematurity. Arch Ophthalmol. 2011;129(5):591–596. doi: 10.1001/archophthalmol.2011.63. [DOI] [PMC free article] [PubMed] [Google Scholar]
- 36.Swanson C, Cocker KD, Parker KH, et al. Semiautomated computer analysis of vessel growth in preterm infants without and with ROP. Br J Ophthalmol. 2003;87(12):1474–1477. doi: 10.1136/bjo.87.12.1474. [DOI] [PMC free article] [PubMed] [Google Scholar]
- 37.Gelman R, Jiang L, Du YE, Martinez-Perez ME, Flynn JT, Chiang MF. Plus disease in retinopathy of prematurity: pilot study of computer-based and expert diagnosis. J AAPOS. 2007;11:532–40. doi: 10.1016/j.jaapos.2007.09.005. [DOI] [PMC free article] [PubMed] [Google Scholar]
- 38.Wallace DK, Zhao Z, Freedman SF. A pilot study using “ROPtool” to quantify plus disease in retinopathy of prematurity. J AAPOS. 2007;11(4):381–387. doi: 10.1016/j.jaapos.2007.04.008. [DOI] [PubMed] [Google Scholar]
- 39.Wallace DK, Freedman SF, Zhao Z, Jung SH. Accuracy of “ROPtool” versus individual examiners in assessing retinal vascular tortuosity. Arch Ophthalmol. 2007;125:1523–30. doi: 10.1001/archopht.125.11.1523. [DOI] [PubMed] [Google Scholar]
- 40.Koreen S, Gelman R, Martinez-Perez ME, et al. Evaluation of a computer-based system for plus disease diagnosis in retinopathy of prematurity. Ophthalmology. 2007;114(12):e59–67. doi: 10.1016/j.ophtha.2007.10.006. [DOI] [PubMed] [Google Scholar]
- 41.Rensink RA, O’Regan JK, Clark JJ. To see or not to see: The need for attention to perceive changes in scenes. Psychological Science. 1997;8:368–373. [Google Scholar]
- 42.Simons DJ. Current approaches to change blindness. Visual Cognition. 2000;7:1–15. [Google Scholar]
- 43.Henderson JM, Hollingworth A. The role of fixation position in detecting scene changes across saccades. Psychological Science. 1999;10:438–443. [Google Scholar]
- 44.O’Regan JK, Deubel H, Clark JJ, Rensink RA. Picture changes during blinks: Looking without seeing and seeing without looking. Visual Cognition. 2000;7:191–211. [Google Scholar]
- 45.Rensink RA. Change detection. Annu Rev Psychol. 2002;53:245–77. doi: 10.1146/annurev.psych.53.100901.135125. [DOI] [PubMed] [Google Scholar]
- 46.Syed ZA, Radcliffe NM, De Moraes CG, Smith SD, Liebmann JM, Ritch R. Acta Ophthalmol. Automated alternation flicker for the detection of optic disc haemorrhages. 2011 Feb 2; doi: 10.1111/j.1755-3768.2010.02094.x. [Epub ahead of print] [DOI] [PubMed] [Google Scholar]
- 47.VanderBeek BL, Smith SD, Radcliffe NM. Comparing the detection and agreement of parapapillary atrophy progression using digital optic disk photographs and alternation flicker. Graefes Arch Clin Exp Ophthalmol. 2010 Sep;248(9):1313–7. doi: 10.1007/s00417-010-1376-z. [DOI] [PubMed] [Google Scholar]
- 48.Heijl A, Bengtsson B. Diagnosis of early glaucoma with flicker comparisons of serial disc photographs. Invest Ophthalmol Vis Sci. 1989;30(11):2376–2384. [PubMed] [Google Scholar]
- 49.Berger JW, Patel TR, Shin DS, Piltz JR, Stone RA. Computerized stereochronoscopy and alternation flicker to detect optic nerve head contour change. Ophthalmology. 2000;107:1316–20. doi: 10.1016/s0161-6420(00)00157-3. [DOI] [PubMed] [Google Scholar]
- 50.Ocular Surgery News. [Accessed May 20, 2011];Survey: Physicians being driven away from ROP treatment. Available at http://www.osnsupersite.com/view/asp?rID=18018.
- 51.Richter GM, Sun G, Lee TC, et al. Speed of telemedicine vs. ophthalmoscopy for retinopathy of prematurity diagnosis. Am J Ophthalmol. 2009;148:136–42.e2. doi: 10.1016/j.ajo.2009.02.002. [DOI] [PMC free article] [PubMed] [Google Scholar]
- 52.Capone A, Trese MT. Take good care of my baby: evolving standards of care for retinopathy of prematurity. Ophthalmology. 2002;109:831–3. doi: 10.1016/s0161-6420(02)00957-0. [DOI] [PubMed] [Google Scholar]
- 53.Jackson KM, Scott KE, Graff Zivin J, et al. Cost-utility analysis of telemedicine and ophthalmoscopy for retinopathy of prematurity management. Arch Ophthalmol. 2008;126:493–6. doi: 10.1001/archopht.126.4.493. [DOI] [PMC free article] [PubMed] [Google Scholar]
Associated Data
This section collects any data citations, data availability statements, or supplementary materials included in this article.
Supplementary Materials
Serial image pairs were taken from infants who eventually developed plus disease, and the reference standard was based on defining the more severe image as the one taken on the later date. (Top) 8/10 (80%) experts identified the more severe image (frame “A”) correctly. (Middle) 7/10 (70%) experts identified the more severe image (frame “A”) correctly. (Bottom) 10/10 (100%) experts responded correctly that images showed no disease progression.