Abstract
BACKGROUND
Neuronal calcium sensor (NCS) proteins, a sub-branch of the calmodulin superfamily, are expressed in the brain and retina where they transduce calcium signals and are genetically linked to degenerative diseases. The amino acid sequences of NCS proteins are highly conserved but their physiological functions are quite distinct. Retinal recoverin and guanylate cyclase activating proteins (GCAPs) both serve as calcium sensors in retinal rod cells, neuronal frequenin (NCS1) modulate synaptic activity and neuronal secretion, K+ channel interacting proteins (KChIPs) regulate ion channels to control neuronal excitability, and DREAM (KChIP3) is a transcriptional repressor that regulates neuronal gene expression.
SCOPE OF REVIEW
Here we review the molecular structures of myristoylated forms of NCS1, recoverin, and GCAP1 that all look very different, suggesting that the sequestered myristoyl group helps to refold these highly homologous proteins into very different structures. The molecular structure of NCS target complexes have been solved for recoverin bound to rhodopsin kinase, NCS-1 bound to phosphatidylinositol 4-kinase, and KChIP1 bound to A-type K+ channels.
MAJOR CONCLUSIONS
We propose the idea that N-terminal myristoylation is critical for shaping each NCS family member into a unique structure, which upon Ca2+-induced extrusion of the myristoyl group exposes a unique set of previously masked residues, thereby exposing a distinctive ensemble of hydrophobic residues to associate specifically with a particular physiological target.
Keywords: Calcium, EF-hand, Ca2+-myristoyl switch, NCS-1, recoverin, GCAP1
INTRODUCTION
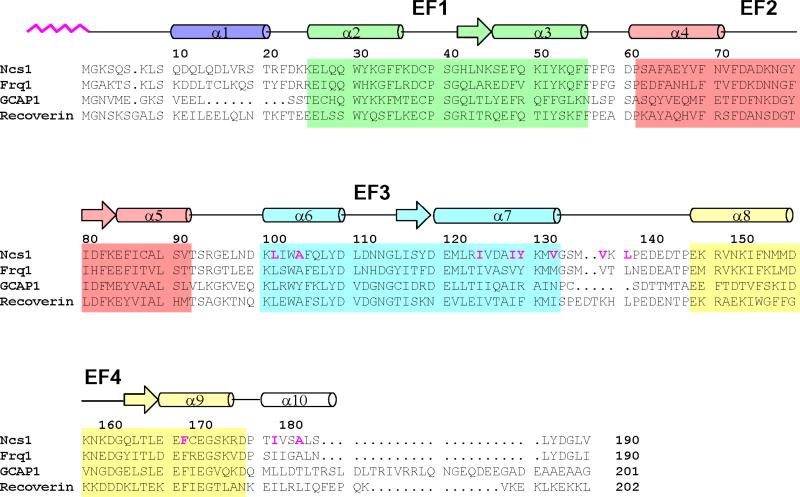
Intracellular calcium (Ca2+) regulates a variety of neuronal signal transduction processes in the brain and retina [1, 2]. The effects of changes in neuronal Ca2+ are mediated primarily by an emerging class of neuronal calcium sensor (NCS) proteins [3-7] that belong to the EF-hand superfamily [8-10]. The human genome encodes 14 members of the NCS family [11]. The amino acid sequences of NCS proteins are highly conserved from yeast to humans (Fig. 1). Recoverin, the first NCS protein to be discovered, and the guanylate cyclase activating proteins (GCAPs) are expressed exclusively in the retina where they serve as Ca2+ sensors in vision [12-16]. Other NCS proteins are expressed in the brain and spinal cord such as neurocalcin [17], frequenin (NCS1) [18, 19], visinin-like proteins [20, 21], K+ channel interacting proteins (KChIPs) [22], DREAM/calsenilin [23, 24] and hippocalcin [25-27]. Frequenin is also expressed outside of the central nervous system [28] as well as in invertebrates including flies [18], worms [29] and yeast (Frq1) [30-32]. The common features of these proteins are an approximately 200-residue chain containing four EF-hand motifs, the sequence CPXG in the first EF-hand that markedly impairs its capacity to bind Ca2+, and an amino-terminal myristoylation consensus sequence.
FIGURE 1.
Amino acid sequence alignment of selected NCS proteins (sequence numbering is for S. pombe NCS1). Secondary structure elements (helices and strands), EF-hand motifs (EF1 green, EF2 red, EF3 cyan and EF4 yellow), and residues that interact with the myristoyl group (highlighted magenta) are indicated. Swiss Protein Database accession numbers are Q09711 (S. pombe Ncs1), Q06389 (S. cerevisiae Frq1), P21457 (bovine recoverin), and P43080 (human GCAP1).
The structurally similar NCS proteins have remarkably different physiologic functions (Table 1). Perhaps the best characterized NCS protein is recoverin that serves as a calcium sensor in retinal rod cells. Recoverin prolongs the lifetime of light-excited rhodopsin [33-35] by inhibiting rhodopsin kinase (RK) only at high Ca2+ levels [36-39]. Hence, recoverin makes receptor desensitization Ca2+-dependent, and the resulting shortened lifetime of rhodopsin at low Ca2+ levels may promote visual recovery and contribute to the adaptation to background light. Recoverin may also function in the rod inner segment [40] and was identified as the antigen in cancer-associated retinopathy, an autoimmune disease of the retina caused by a primary tumor in another tissue [41, 42]. Other NCS proteins in retinal rods include the guanylate cyclase activating proteins (GCAP1 and GCAP2) that activate retinal guanylate cyclase only at low Ca2+ levels and inhibit the cyclase at high Ca2+ [13, 14, 43]. GCAPs are important for regulating the recovery phase of visual excitation and particular mutants are linked to various forms of retinal degeneration [44-48]. Yeast and mammalian frequenins bind and activate a particular PtdIns 4-OH kinase isoform (Pik1 gene in yeast) [28, 30, 49, 50] required for vesicular trafficking in the late secretory pathway [51, 52]. Mammalian frequenin (NCS1) also regulates voltage-gated Ca2+ and K+ channels [53, 54]. The KChIPs regulate the gating kinetics of voltage-gated, A-type K+ channels [22]. The DREAM/calsenilin/KChIP3 protein binds to specific DNA sequences in the prodynorphin and c-fos genes [23, 55] and serves as a calcium sensor and transcriptional repressor for pain modulation [56, 57]. Hence, the functions of the NCS proteins appear to be quite diverse and non-overlapping.
Table 1.
Function of NCS Proteins.
| NCS protein | Function | Reference |
|---|---|---|
| Recoverin | Inhibit rhodopsin kinase in retinal rods. | [33, 35, 37] |
| GCAP1 | Activate guanylate cyclase in retinal cones. | [14, 43] |
| GCAP2 | Activate guanylate cyclase in retinal rods. | [13] |
| GCIP | Inhibit guanylate cyclase in frog photreceptors. | [101] |
| KChIP1 | Regulate K+ channel gating kinetics in brain. | [22, 102] |
| KChIP2 | Regulate K+ channel gating kinetics in cardiac cells. | [22, 103] |
| Calsenilin/DREAM | Repress transcription of prodynorphin and c-fos genes. | [22-24] |
| NCS1 | Activate PI(4) kinase; regulate Ca2+ and K+ channels. | [18, 30, 53, 54] |
| Neurocalcin δ | Activate membrane guanylate cyclase | [17, 104] |
| Hippocalcin | Activate phospholipase D; MAP kinase signaling. | [25, 105, 106] |
| VILIP-1 | Activate guanylate cyclase; traffic nicotinic receptors. | [92, 107] |
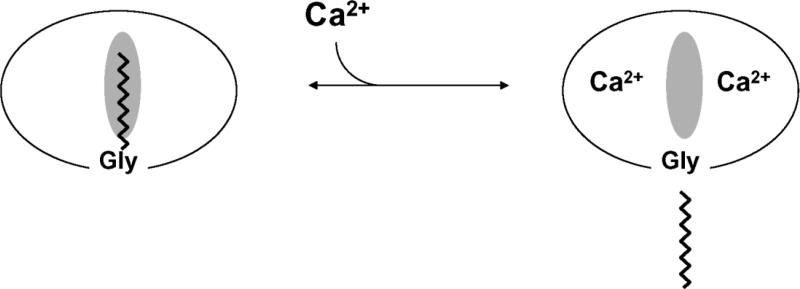
Mass spectrometric analysis of retinal recoverin and some of the other NCS proteins revealed that they are myristoylated at the amino terminus [26, 58, 59]. Recoverin contains an N-terminal myristoyl (14:0) or related fatty acyl group (12:0, 14:1, 14:2). Retinal recoverin and myristoylated recombinant recoverin, but not unmyristoylated recoverin, bind to membranes in a Ca2+-dependent manner [60, 61]. Likewise, bovine neurocalcin and hippocalcin contain an N-terminal myristoyl group and both exhibit Ca2+-induced membrane binding [59]. These findings led to the proposal that NCS proteins possess a Ca2+-myristoyl switch (Figure 2). The covalently attached fatty acid is highly sequestered in recoverin in the calcium-free state. The binding of calcium to recoverin leads to the extrusion of the fatty acid, making it available to interact with lipid bilayer membranes or other hydrophobic sites. The Ca2+-myristoyl switch function by recoverin also enables its light-dependent protein translocation in retinal rods [40].
FIGURE 2.
Schematic diagram of calcium-myristoyl switch in recoverin. The binding of two Ca2+ ions promotes the extrusion of the myristoyl group and exposure of other hydrophobic residues (marked by the shaded oval). This figure was adapted from and originally published by [61].
In this review, the atomic-level structures of various NCS proteins and their target complexes will be discussed and compared with that of calmodulin. We begin by examining the large effect of N-terminal myristoylation on the structures of recoverin, GCAP1 and NCS1. Ca2+-induced extrusion of the myristoyl group exposes unique hydrophobic binding sites in each protein that in turn interact with various target proteins. An emerging theme is that N-terminal myristoylation is critical for shaping each NCS family member into a unique structure, which upon Ca2+-induced extrusion of the myristoyl group exposes a unique set of previously masked residues, thereby exposing a distinctive ensemble of hydrophobic residues to associate specifically with a particular physiological target.
STRUCTURE OF RECOVERIN'S CALCIUM-MYRISTOYL SWITCH
The x-ray crystal structure of recombinant unmyristoylated recoverin [62, 63] showed it to contain a compact array of EF-hand motifs, in contrast to the dumbbell shape of calmodulin [64] and troponin C [65]. The four EF-hands are organized into two domains: The first EF-hand, EF-1 (residues 27-56, colored green in Figs. 1 and 3), interacts with EF-2 (residues 63-92, red) to form the N-terminal domain, and EF-3 (residues 101-130, cyan) and EF-4 (residues 148-177, yellow) form the C-terminal domain. The linker between the two domains is U-shaped rather than α-helical. Ca2+ is bound to EF-3 and Sm3+ (used to derive phases) is bound to EF-2. The other two EF hands possess novel features that prevented ion binding. EF-1 is disabled by a Cys-Pro sequence in the binding loop. EF-4 contains an internal salt bridge in the binding loop that competes with Ca2+ binding. Myristoylated recoverin, the physiologically active form, has thus far eluded crystallization.
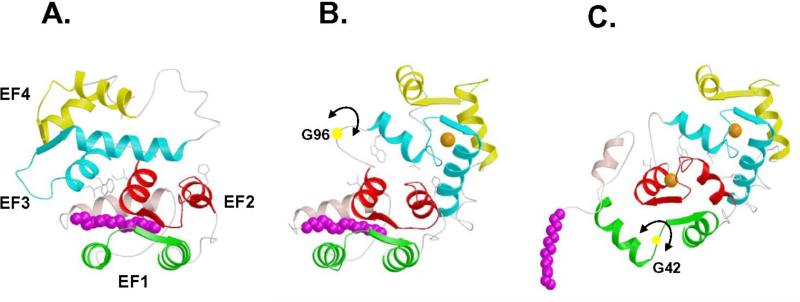
FIGURE 3.
Three-dimensional structures of myristoylated recoverin with 0 Ca2+ bound (A), 1 Ca2+ bound (B) and 2 Ca2+ bound (C). The first step of the mechanism involves the binding of Ca2+ to EF-3 that causes minor structural changes within the EF-hand that sterically promote a 45° swiveling of the two domains, resulting in a partial unclamping of the myristoyl group and a dramatic rearrangement at the domain interface. The resulting altered interaction between EF-2 and EF-3 facilitates the binding of a second Ca2+ to the protein at EF-2 in the second step, which causes structural changes within the N-terminal domain that directly lead to the ejection of the fatty acyl group.
The structures of myristoylated recoverin in solution with 0, 1 and 2 Ca2+ bound have been determined by nuclear magnetic resonance (NMR) spectroscopy [66-68] (Figure 3). In the Ca2+-free state, the myristoyl group is sequestered in a deep hydrophobic cavity in the N-terminal domain. The cavity is formed by five α-helices. The two helices of EF-1 (residues 26-36 and 46-56), the exiting helix of EF-2 (residues 83-93), and entering helix of EF-3 (residues 100-109) lie perpendicular to the fatty acyl chain and form a box-like arrangement that surrounds the myristoyl group laterally. A long, amphipathic α-helix near the N-terminus (residues 4-16) packs closely against and runs antiparallel to the fatty acyl group, and serves as a lid on top of the four-helix box. The N-terminal residues Gly 2 and Asn 3 form a tight hairpin turn that connects the myristoyl group to the N-terminal helix. This turn positions the myristoyl group inside the hydrophobic cavity and gives the impression of a cocked trigger. The bond angle strain stored in the tight hairpin turn may help eject the myristoyl group from the pocket once Ca2+ binds to the protein.
The structure of myristoylated recoverin with one Ca2+ bound at EF-3 (half saturated recoverin, Fig. 3B) [67] represents a hybrid structure of the Ca2+-free and Ca2+-saturated states. The structure of the N-terminal domain (residues 2-92, green and red in Fig. 3) of half saturated recoverin (Fig. 3B) resembles that of Ca2+-free state (Fig. 3A) and is very different from that of the Ca2+-saturated form (Fig. 3C). Conversely, the structure of the C-terminal domain (residues 102-202, cyan and yellow in Fig. 3) of half saturated recoverin more closely resembles that of the Ca2+-saturated state. Most striking in the structure of half saturated recoverin is that the myristoyl group is flanked by a long N-terminal helix (residues 5-17) and is sequestered in a hydrophobic cavity containing many aromatic residues from EF-1 and EF-2 (F23, W31, Y53, F56, F83, and Y86). An important structural change induced by Ca2+ binding at EF-3 is that the carbonyl end of the fatty acyl group in the half saturated species is displaced far away from hydrophobic residues of EF-3 (W104 and L108, Figs. 3A-B) and becomes somewhat solvent exposed. By contrast, the myristoyl group of Ca2+-free recoverin is highly sequestered by residues of EF-3 [66].
The structure of myristoylated recoverin with two Ca2+ bound shows the amino-terminal myristoyl group to be extruded [68] (Figure 3C). The N-terminal eight residues are solvent exposed and highly flexible and thus serve as a mobile arm to position the myristoyl group outside the protein when Ca2+ is bound. The flexible arm is followed by a short α-helix (residues 9-17) that precedes the four EF-hand motifs, arranged in a tandem array as was seen in the x-ray structure. Calcium ions are bound to EF-2 and EF-3. EF-3 has the classic “open conformation” similar to the Ca2+ occupied EF-hands in calmodulin and troponin C. EF-2 is somewhat unusual and the helix-packing angle of Ca2+-bound EF-2 (120°) in recoverin more closely resembles that of the Ca2+-free EF-hands (in the “closed conformation”) found in calmodulin and troponin C. The overall topology of Ca2+-bound myristoylated recoverin is similar to the x-ray structure of unmyristoylated recoverin described above. The RMS deviation of the main chain atoms in the EF-hand motifs is 1.5 Å in comparing Ca2+-bound myristoylated recoverin to unmyristoylated recoverin. Hence, in Ca2+-saturated recoverin, the N-terminal myristoyl group is solvent exposed and does not influence the interior protein structure.
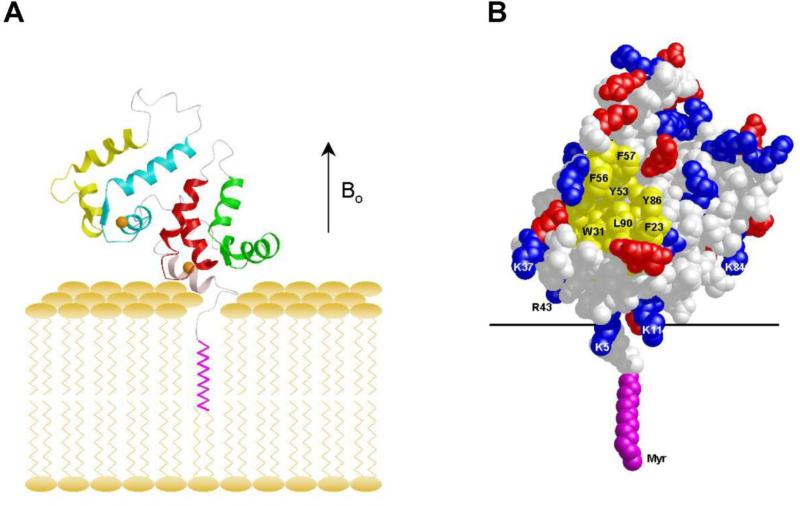
The Ca2+-induced exposure of the myristoyl group (Figs. 2 and 3) enables recoverin to bind to membranes only at high Ca2+ [61, 69]. Recent solid-state NMR studies have determined the structure of Ca2+-bound myristoylated recoverin bound to oriented lipid bilayer membranes (Fig. 4) [70]. Membrane-bound recoverin appears to retain approximately the same overall structure as it has in solution [71]. The protein is positioned on the membrane surface such that its long molecular axis is oriented 45° with respect to the membrane normal. The N-terminal region of recoverin points toward the membrane surface, with close contacts formed by basic residues K5, K11, K22, K37, R43, and K84. This orientation of membrane-bound recoverin allows an exposed hydrophobic crevice (lined primarily by residues F23, W31, F35, I52, Y53, F56, Y86 and L90), near the membrane surface that may serve as a potential binding site for the target protein, rhodopsin kinase (Fig. 4B).
FIGURE 4.
Main chain structure (A) and space-filling representation (B) of myristoylated recoverin bound to oriented lipid bilayers determined by solid-state NMR [70]. Hydrophobic residues are yellow, bound Ca2+ ions are orange, and charged residues are red and blue.
STRUCTURAL DIVERSITY OF NCS PROTEINS
Myristoylation Reshapes Structure of NCS Proteins
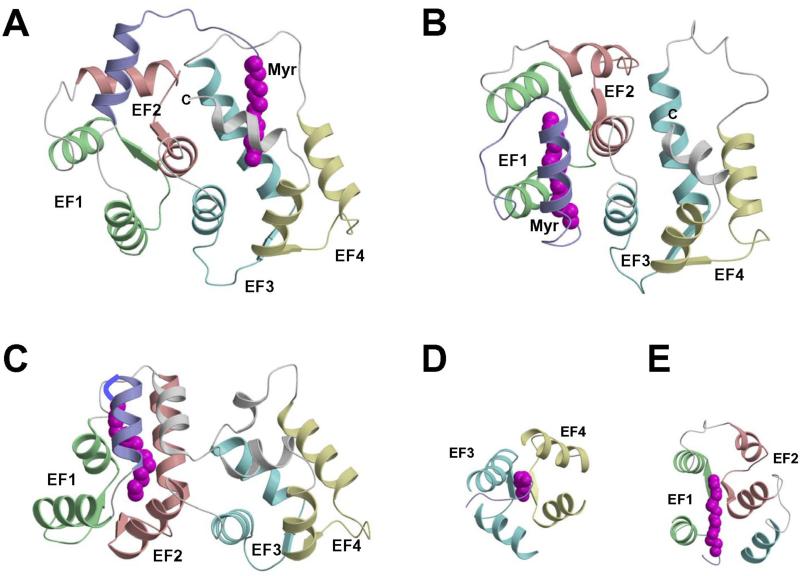
Three-dimensional structures have been determined for myristoylated NCS proteins: recoverin [68], GCAP1 [72] and NCS1 [73] that each contain a sequestered myristoyl group (Fig. 5). Surprisingly, the myristoylated forms of GCAP1, NCS1 and recoverin all have very distinct three-dimensional folds (Fig. 5). The overall root-mean-squared deviations are 2.8 and 3.4 Å when comparing the main chain structures of Ca2+-free NCS1 with recoverin and GCAP1, respectively. These very different structures reveal that the N-terminal myristoyl group is sequestered inside different protein cavities at different locations in each case. In NCS1, the N-terminal myristoyl group is sequestered inside a cavity near the C-terminus formed between the helices of EF3 and EF4 (Fig. 5A). The fatty acyl chain in NCS1 is nearly parallel to the helices of EF3 and EF4 that form walls that surround the myristoyl moiety (Fig. 5D). This arrangement in NCS1 is in stark contrast to recoverin where the myristoyl group is sequestered inside a protein cavity near the N-terminus (Fig. 5B). The myristate in recoverin is wedged perpendicularly between the helices of EF1 and EF2 (Fig. 5E) that contrasts with the parallel arrangement in NCS1 (Fig. 5D). For GCAP1 (Fig. 5C), the myristoyl group is located in between the N-terminal and C-terminal domains. In essence, the myristate bridges both domains of GCAP1 by interacting with helices at each end of the protein. The structural location and environment around the myristoyl group is very different in the various NCS proteins (Fig. 5). We suggest that each Ca2+-myristoyl switch protein may adopt a distinct structure because its N-terminal myristoyl group associates with patches of hydrophobic residues that are unique to that protein. We point out, however, that myristoylation is not required for the function of GCAP2 [74], suggesting that additional factors besides myristoylation must also play a role.
FIGURE 5.
Main chain structures of Ca2+-free myrisoylated NCS1 (PDB ID: 212e) (A), recoverin (PDB ID: 1iku) (B), and GCAP1 (PDB ID: 2r2i) (C). Close-up views of the myristate binding pocket in NCS1 (D) and recoverin (E). EF-hands and myristoyl group (magenta) are colored as defined in Fig. 1. Adapted from and originally published by [73].
Non-conserved residues of NCS proteins interact closely with the N-terminal myristoyl group and help stabilize the novel protein structure in each case. NCS1, recoverin and GCAP1 all have non-conserved residues near the N-terminus (called an N-terminal arm highlighted purple in Fig. 5) that make specific contacts with the myristoyl moiety. GCAP1 also contains an extra helix at the C-terminus that contacts the N-terminal arm and myristoyl group (Fig. 5C). Thus, non-conserved residues at the N-terminus, C-terminus and loop between EF3 and EF4 all play a role in creating a unique environment around the myristoyl group. In NCS1, the long N-terminal arm and particular hydrophobic residues in the C-terminal helix are crucial for placing the C14 fatty acyl chain in a cavity between EF3 and EF4 (Fig. 5D). By contrast, the much shorter N-terminal arm in both recoverin and GCAP1 prevents the myristoyl group from reaching the C-terminal cavity and instead places the fatty acyl chain between EF1 and EF2 (Fig. 5E). We propose that non-conserved residues at the N-terminus, C-terminus, and/or loop between EF3 and EF4 may play a role in forming unique myristoyl binding environments in other NCS proteins, such as VILIPs, neurocalcins, and hippocalcins that may help explain their capacity to associate with functionally diverse target proteins.
Structures of Ca2+-bound NCS Proteins
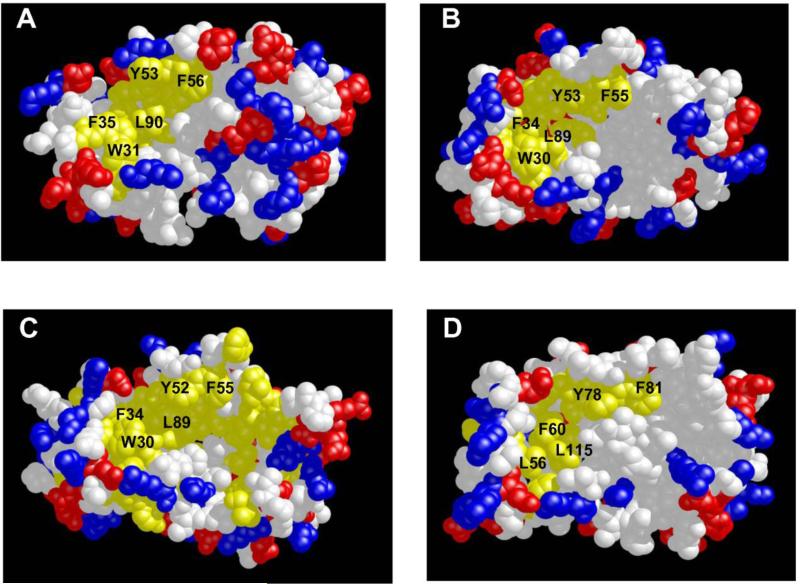
Three-dimensional structures have been determined for unmyristoylated forms of Ca2+-bound neurocalcin [75], frequenin [76], KChIP1 [77, 78], Frq1 [79] and GCAP2 [80]. The first eight residues from the N-terminus are unstructured and solvent exposed in each case, consistent with an extruded myristoyl group that causes Ca2+-induced membrane localization of NCS proteins [61, 76, 81]. The overall main chain structures of the Ca2+-bound NCS proteins are very similar in each case, which is not too surprising given their sequence relatedness. However, if the main chain structures are so similar, then how can one explain their ability to bind unique target proteins? One distinguishing structural property is the number and location of bound Ca2+. Recoverin has Ca2+ bound at EF-2 and EF-3; KChIP1 has Ca2+ bound at EF-3 and EF-4; and frequenin, neurocalcin and GCAP2 have Ca2+ bound at EF-2, EF-3 and EF-4. Another important structural property is the distribution of charged and hydrophobic residues on the protein surface. Surface representations of hydrophobicity and charge density of the various NCS structures are shown in Fig. 6. All NCS structures exhibit a similar exposed hydrophobic surface located on the N-terminal half of the protein, formed primarily by residues in EF-1 and EF-2 (F35, W31, F56, F57, Y86 and L90 for recoverin in Fig. 6A). The exposed hydrophobic residues in this region are highly conserved (labeled and colored yellow in Fig. 6) and correspond to residues of recoverin that interact with the myristoyl group in the Ca2+-free state (Fig. 3A). A similar hydrophobic patch is also seen in membrane-bound recoverin (Fig. 4B). These exposed residues in the hydrophobic patch have been implicated in target recognition from mutagenesis studies [82-85], and these residues very likely form intermolecular contacts with target proteins as has been demonstrated in the recent crystal structure of KChIP1 (see below).
FIGURE 6.
Space-filling representations of the Ca2+-bound structures of recoverin (A), frequenin (B), neurocalcin (C) and KChIP1 (D). Exposed hydrophobic residues are yellow, neutral residues are white and charge residues are red and blue.
The distribution of charged (red and blue) and hydrophobic (yellow) residues on the surface of the C-terminal half of the NCS proteins is highly variable (Fig. 6). Frequenin exhibits exposed hydrophobic residues in the C-terminal domain that fuse together with the exposed hydrophobic crevice in the N-terminal domain, forming one continuous and elongated patch (Fig. 6B). By contrast, recoverin (Fig. 6A) has mostly charged residues on the surface of the C-terminal half, whereas neurocalcin (Fig. 6C) and KChIP1 (Fig. 6D) have mostly neutral residues shown in white. The different patterns of charge distribution on the C-terminal surface of NCS proteins might be important for conferring target specificity.
Ca2+ sensitive dimerization of NCS proteins is another structural characteristic that could influence target recognition. Neurocalcin [75], recoverin [62], VILIP-1 [86], and KChIP1 [77] exist as dimers in their x-ray crystal structures. Hydrodynamic studies have confirmed that neurocalcin and DREAM form dimers in solution at high Ca2+ and are monomeric in the Ca2+-free state [87, 88]. Indeed, the NMR structure of Ca2+-bound DREAM forms a dimer in solution with intermolecular contacts involving Leu residues near the C-terminus [89]. By contrast, GCAP2 forms a dimer only in the Ca2+-free state and is monomeric at high Ca2+ [88]. Ca2+ sensitive dimerization of GCAP-2 has been demonstrated to control its ability to activate retinal guanylate cyclase. Ca2+-sensitive protein oligomerization is also important physiologically for DREAM: the Ca2+-free DREAM protein serves as a transcriptional repressor by binding to DNA response elements as a protein tetramer [23]. Ca2+-induced dimerization of DREAM appears to disrupt DNA binding and may activate transcription of prodynorphin and c-fos genes [23]. In a related fashion, Ca2+-bound KChIP1 forms a dimer in solution and in complex with an N-terminal fragment of the Kv4.2 K+ channel [77]. By contrast, the full-length Kv4.2 channel tetramer binds to KChIP1 with a 4:4 stoichiometry [90], suggesting that KChIP1 dimers may assemble as a protein tetramer to recognize the channel. Such a protein tetramerization of KChIP1 may be Ca2+ sensitive like it is for DREAM. The dimerization of VILIP-1 has been implicated in the trafficking of the dimeric α–subunit of the α4β2 nicotinic acetylcholine receptor (nAChR) [86, 91, 92]. In short, the oligomerization properties of some NCS proteins appear to be Ca2+ sensitive and may play a role in target recognition.
TARGET RECOGNITION BY NCS PROTEINS
Recoverin bound to rhodopsin kinase fragment (RK25)
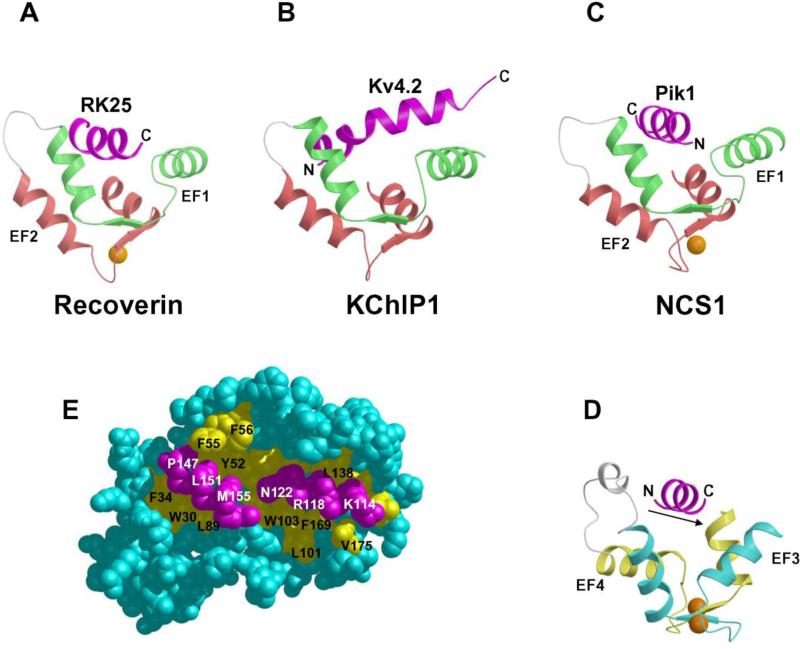
The structure of Ca2+-bound recoverin bound to a functional fragment of rhodopsin kinase (residues 1-25, hereafter referred to as RK25) was the first atomic-resolution structure of a Ca2+-myristoyl switch protein bound to a functional target protein [93] (Fig. 7A). The structure of this complex revealed that RK25 forms a long amphipathic α-helix, whose hydrophobic surface interacts with the N-terminal hydrophobic groove of recoverin described above (Fig. 6). The structure of recoverin in the complex is quite similar to that of Ca2+-bound recoverin alone in solution (root mean squared deviation = 1.8 Å). The structure of RK25 in the complex consists of an amphipathic α-helix (residues 4 - 16). The hydrophobic surface of the RK25 helix (L6, V9, V10, A11, F15) interacts with the exposed hydrophobic groove on recoverin (W31, F35, F49, I52, Y53, F56, F57, Y86, and L90). Previous mutagenesis studies on recoverin [84] and RK [39, 94] have shown that many of the hydrophobic residues at the binding interface are essential for the high affinity interaction. These hydrophobic contacts are supplemented by a π-cation interaction involving F3 (RK25) and K192 from recoverin [95]. Dipolar residues on the opposite face of the RK25 helix (S5, T8, N12, I16) are solvent exposed. The helical structure of RK25 in the complex is stabilized mostly by hydrophobic intermolecular interactions with recoverin, as free RK25 in solution is completely unstructured.
FIGURE 7.
Ribbon diagrams illustrating intermolecular interactions for Recoverin bound to RK25 (A), KChIP1 bound to Kv4.32 (B), NCS1 (N-domain) bound to Pik1(111-151) (C), NCS1 (C-domain) bound to Pik1(111-151) (D), and space-filling view of NCS1 bound to Pik1(111-151) (E). In each case, a target helix (magenta) is inserted in groove formed by the helices of the EF-hands. The intermolecular interactions are mostly hydrophobic as described in the text.
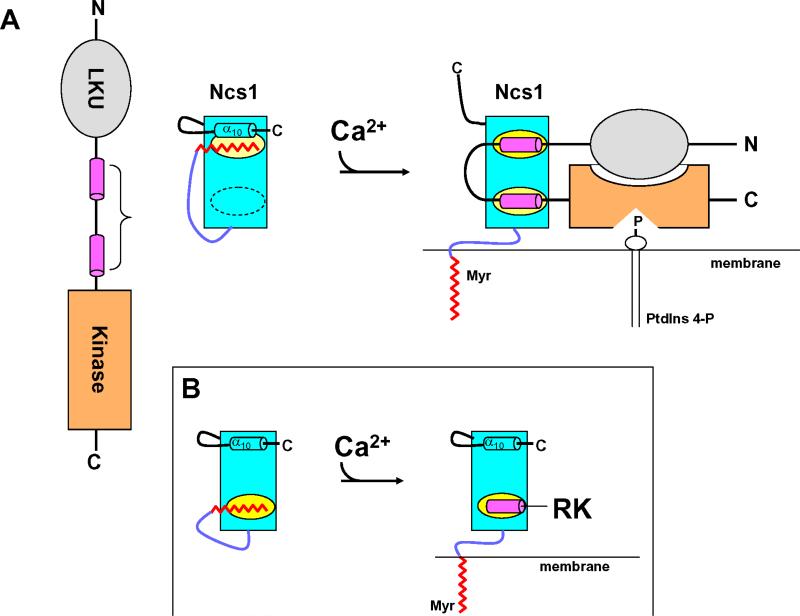
The Ca2+-myristoyl switch mechanism of recoverin (i.e. Ca2+-induced extrusion of the N-terminal myristoyl group, Fig. 2) is structurally coupled to Ca2+-induced inhibition of RK [36-38]. The exposed hydrophobic residues of recoverin that interact with rhodopsin kinase correspond to the same residues that contact the N-terminal myristoyl group in the structure of Ca2+-free recoverin [68]. The size of the myristoyl group is similar to the length and width of the RK25 helix in the complex, which explains why both effectively compete for binding to the exposed hydrophobic groove (Fig. 4B). The Ca2+-induced exposure of the N-terminal hydrophobic groove therefore explains why recoverin binds to rhodopsin kinase only at high Ca2+ levels. In the Ca2+-free state, the covalently attached myristoyl group sequesters the N-terminal hydrophobic groove and covers up the target-binding site. Ca2+-induced extrusion of the myristoyl group of recoverin causes exposure of residues that bind and inhibit RK (Fig. 8). This mechanism elegantly explains how recoverin controls both the localization and activity of RK in response to light. In the dark (high Ca2+), Ca2+-bound recoverin binds to RK (thereby inhibiting it [36-39]) and delivers RK to the membrane via a Ca2+-myristoyl switch that pre-positions RK near rhodopsin. Upon light activation (low Ca2+), recoverin rapidly dissociates from both RK and the membrane, allowing RK to bind efficiently to its nearby substrate, rhodopsin, and cause rapid desensitization.
FIGURE 8.
Schematic diagram of calcium-myristoyl switch coupled to target regulation illustrated for NCS1 (A) and recoverin (B). Adapted from and originally published by [73].
NCS1 bound to phosphatidylinositol 4-kinase fragment (Pik1)
The structure of Ca2+-bound NCS1 (or yeast Frq1 [50]) bound to a functional fragment of Pik1 (residues 111-159, hereafter referred to as Pik1(111-159)) was determined by NMR [73] (Fig. 7C-D). The structure of NCS1 in the complex is very similar to the crystal structure in the absence of target [76] with a concave solvent-exposed groove lined by two separate hydrophobic patches (highlighted yellow in Fig. 6). These two hydrophobic surfaces represent bipartite binding sites on NCS1 that interact with two helical segments in Pik1(111-159) (Fig. 7E). The structure of Pik1(111-159) in the complex adopts a conformation that contains two α-helices (residues 114-127 and 143-156) connected by a disordered loop. The N-terminal helix contains hydrophobic residues (I115, C116, L119, and I123) that contact C-terminal residues of NCS1 (L101, W103, V125, V128, L138, I152, L155 and F169). Interestingly, these same hydrophobic residues in Ca2+-free NCS1 make close contacts with the myristoyl group. Therefore, Ca2+-induced extrusion of the myristoyl group causes exposure of hydrophobic residues in NCS1 that forms part of the Pik1 binding site (Figs. 8E and 9). The C-terminal helix of Pik1(111-159) contains many hydrophobic residues (V145, A148, I150, and I154) that contact the exposed N-terminal hydrophobic groove of NCS1 (W30, F34, F48, I51, Y52, F55, F85, and L89), very similar to the exposed hydrophobic groove seen in all NCS proteins (Fig. 6). The two helices of Pik1(111-159) do not interact with one another or with the unstructured connecting loop and are highly stabilized by interactions with NCS1.
Non-conserved residues in NCS1 at the C-terminus and immediately following EF3 may be structurally important for explaining target specificity. The non-conserved C-terminal region of NCS1 (residues, 180 – 190) is structurally disordered in the target complex, in contrast to a well-defined C-terminal helix seen in Ca2+-free NCS1 in the absence of target [73]. The C-terminal helix in Ca2+-free NCS1 (target free state) makes contact with the myristoyl group and residues in EF3 and EF4 (L101, A104, M121, I152, F169 and S173). These same residues in Ca2+-bound NCS1 make contact with Pik1 in the complex (Fig. 7E). Therefore, the N-terminal Pik1 helix appears to substitute for and perhaps displace the C-terminal helix of Frq1, likely leading to the observed C-terminal destabilization in the complex (Fig. 8). The corresponding C-terminal helix of KChIP1 is similarly displaced upon its binding to the Kv4.3 channel [96, 97] but not upon its binding to Kv4.2 [77]. The C-terminal helix in recoverin forms a stable interaction with EF3 and EF4, enabling the C-terminal helix to perhaps serve as a built-in competitive inhibitor that would presumably block its ability to bind to targets like Pik1 and Kv4.3. This role for the C-terminus may explain why the C-terminal sequences of NCS proteins are not well conserved (Fig. 1). Another non-conserved region of NCS1 implicated in target specificity is the stretch between EF3 and EF4 (residues 134-146). This region of NCS1 adopts a short α-helix in the complex that contacts the N-terminal helix of Pik1. By contrast, the region between EF3 and EF4 is unstructured in many other NCS proteins [76-78, 80, 89].
The structure of the NCS1-Pik1 complex (Figs. 5A and 8C-D) suggest how a Ca2+-myristoyl switch might promote activation of PtdIns 4-kinase (Fig. 8). Under resting basal conditions, NCS1 exists in its Ca2+-free state with a sequestered myristoyl group buried in the C-domain that covers part of its binding site for PtdIns 4-kinase (highlighted yellow in Figs. 8E and 9) and prevents binding of NCS1 to Pik1. The fatty acyl chain has the same molecular dimensions (length and width) as the N-terminal helix of Pik1(111-159), which explains why the myristoyl group and Pik1 helix can effectively compete for the same binding site in NCS1. A rise in cytosolic Ca2+ will cause Ca2+-induced conformational changes in NCS1, resulting in extrusion of the N-terminal myristoyl group. Ca2+-induced extrusion of the myristoyl group exposes a hydrophobic crevice in the C-terminal domain of NCS1 and, concomitantly, Ca2+-induced structural changes in its N-domain result in formation of a second exposed hydrophobic crevice, also seen in all other Ca2+-bound NCS proteins examined to date [5, 6, 98, 99]. These two separate hydrophobic sites on the surface of Ca2+-bound NCS1 are different from Ca2+-bound recoverin that contains only one exposed hydrophobic patch (Fig. 8, inset) that interacts with a single target helix in rhodopsin kinase [93]. The two exposed hydrophobic sites on NCS1 bind to the hydrophobic faces of the two antiparallel amphipathic α-helices in Pik1(111-159) (colored magenta in 9). The Ca2+-induced binding of NCS1 to PtdIns 4-kinase may promote a structural changes that cause increased lipid kinase activity. Simultaneously, NCS1 binding to PtdIns 4-kinase will also promote membrane localization of the lipid kinase, because Ca2+-bound NCS1 contains an extruded myristoyl group that serves as a membrane anchor. Thus, NCS1 controls both delivery of PtdIns 4-kinase to the membrane where its substrates are located and formation of the optimally active state of the enzyme.
Mechanisms of Target Recognition
NCS proteins bind to helical target proteins analogous to the target binding seen for CaM [100] (Fig. 7). Helical segments of target proteins bind to an exposed hydrophobic crevice formed by the two EF-hands in either the N-terminal or C-terminal domain in NCS proteins. In recoverin, the two N-terminal EF-hands form an exposed hydrophobic groove that interacts with a hydrophobic target helix from rhodopsin kinase (RK25) [93] (Fig. 7A). The N-terminal EF-hands of KChIP1 interact with a target–helix derived from the T1 domain of Kv4.2 channels (Fig. 6B) [77] and Kv4.3 channels [97]. The orientation of the target helices bound to recoverin and KChIP1 are somewhat similar: the C-terminal end of the target helix is spatially close to the N-terminal helix of EF-1. By contrast, the Pik1 target helix binds to NCS1 in almost the exact opposite orientation (Fig. 6C). The N-terminal end of the Pik1 helix is closest to EF1 (green) in NCS1, whereas the C-terminal end of the RK25 target helix is closest to the corresponding region of recoverin. Non-conserved residues in NCS1 (G33 and D37) make important contacts with the Pik1 target helix and presumably assist in imposing the observed orientation of the helix. Thus, the requirement that the helix (in this case, from Pik1) must bind to NCS1 with a polarity opposite to that observed for the helices in other target-NCS family member complexes could clearly contribute to dictating the substrate specificity of frequenins, as compared to other NCS sub-types. Another important structural feature seen in the NCS1-Pik1 interaction is that two helical segments of the target are captured in the complex, whereas in the target complexes characterized for recoverin and KChIP1, only one helix is bound. Therefore, selective substrate recognition by NCS proteins may be explained by both by the orientation of the bound target helix; and, the number of target helices bound.
CONCLUSIONS
We reviewed the molecular structures of NCS proteins and examined structural determinants important for target recognition. N-terminal myristoylation has a profound effect on the structures of Ca2+-free recoverin, GCAP1 and NCS1. Surprisingly, the sequestered myristoyl group interacts with quite different protein residues in each case and therefore is able to reshape these homologous NCS proteins into very different structures. The structures of the Ca2+-bound NCS proteins all contain an extruded N-terminus with an exposed hydrophobic crevice implicated in target binding. We propose that N-terminal myristoylation is critical for shaping each NCS family member into a unique structure, which upon Ca2+-induced extrusion of the myristoyl group exposes a unique set of previously masked residues, thereby exposing a distinctive ensemble of hydrophobic residues to associate specifically with a particular physiological target. Differences in their surface charge density and protein dimerization properties may also help to explain NCS target specificity and functional diversity. In the future, atomic resolution structures of additional NCS proteins both with a sequestered myristoyl group and in their extruded forms bound to their respective target proteins are needed to improve our understanding of how this structurally conserved family of proteins can uniquely recognize their diverse biological targets.
Highlights.
>Structure and target recognition of NCS proteins. >Ca2+-binding causes extrusion of N-terminal myristoyl group. >Myristoylation is critical for shaping each NCS protein into a unique structure.
ACKNOWLEDGEMENTS
This work was supported by grants to J.B.A from the NIH (EY012347).
Footnotes
Publisher's Disclaimer: This is a PDF file of an unedited manuscript that has been accepted for publication. As a service to our customers we are providing this early version of the manuscript. The manuscript will undergo copyediting, typesetting, and review of the resulting proof before it is published in its final citable form. Please note that during the production process errors may be discovered which could affect the content, and all legal disclaimers that apply to the journal pertain.
REFERENCES
- 1.Augustine GJ, Santamaria F, Tanaka K. Neuron. 2003;40:331–346. doi: 10.1016/s0896-6273(03)00639-1. [DOI] [PubMed] [Google Scholar]
- 2.Berridge MJ, Lipp P, Bootman MD. Nat. Rev. Mol. Cell Biol. 2000;1:11–21. doi: 10.1038/35036035. [DOI] [PubMed] [Google Scholar]
- 3.Burgoyne RD, O'Callaghan DW, Hasdemir B, Haynes LP, Tepikin AV. Trends Neurosci. 2004;27:203–209. doi: 10.1016/j.tins.2004.01.010. [DOI] [PubMed] [Google Scholar]
- 4.Ames JB, Tanaka T, Stryer L, Ikura M. Curr. Opin. Struct. Biol. 1996;6:432–8. doi: 10.1016/s0959-440x(96)80106-0. [DOI] [PubMed] [Google Scholar]
- 5.Braunewell KH, Gundelfinger ED. Cell Tissue Res. 1999;295:1–12. doi: 10.1007/s004410051207. [DOI] [PubMed] [Google Scholar]
- 6.Burgoyne RD, Weiss JL. Biochem. J. 2001;353:1–12. [PMC free article] [PubMed] [Google Scholar]
- 7.Weiss JL, Hui H, Burgoyne RD. Cell Mol. Neurobiol. 2010;30:1283–1292. doi: 10.1007/s10571-010-9588-7. [DOI] [PMC free article] [PubMed] [Google Scholar]
- 8.Ikura M. Trends Biochem. Sci. 1996;21:14–17. [PubMed] [Google Scholar]
- 9.Moncrief ND, Kretsinger RH, Goodman M. J. Mol. Evol. 1990;30:522–562. doi: 10.1007/BF02101108. [DOI] [PubMed] [Google Scholar]
- 10.Ikura M, Ames JB. Proc Natl Acad Sci U S A. 2006;103:1159–1164. doi: 10.1073/pnas.0508640103. [DOI] [PMC free article] [PubMed] [Google Scholar]
- 11.Weiss JL, Burgoyne RD. In: Handbook of cell signaling. Bradshaw R, editor. Academic Press; San Diego: 2002. pp. 79–82. [Google Scholar]
- 12.Dizhoor AM, Ray S, Kumar S, Niemi G, Spencer M, Rrolley D, Walsh KA, Philipov PP, Hurley JB, Stryer L. Science. 1991;251:915–918. doi: 10.1126/science.1672047. [DOI] [PubMed] [Google Scholar]
- 13.Dizhoor AM, Lowe DG, Olsevskaya EV, Laura RP, Hurley JB. Neuron. 1994;12:1345–1352. doi: 10.1016/0896-6273(94)90449-9. [DOI] [PubMed] [Google Scholar]
- 14.Palczewski K, Subbaraya I, Gorczyca WA, Helekar BS, Ruiz CC, Ohguro H, Huang J, Zhao X, Crabb JW, Johnson RS. Neuron. 1994;13:395–404. doi: 10.1016/0896-6273(94)90355-7. [DOI] [PubMed] [Google Scholar]
- 15.Palczewski K, Polans AS, Baehr W, Ames JB. Bioessays. 2000;22:337–350. doi: 10.1002/(SICI)1521-1878(200004)22:4<337::AID-BIES4>3.0.CO;2-Z. [DOI] [PubMed] [Google Scholar]
- 16.Stephen R, Filipek S, Palczewski K, Sousa MC. Photochem. Photobiol. 2008;84:903–910. doi: 10.1111/j.1751-1097.2008.00323.x. [DOI] [PMC free article] [PubMed] [Google Scholar]
- 17.Hidaka H, Okazaki K. Neuroscience Research. 1993;16:73–7. doi: 10.1016/0168-0102(93)90074-z. [DOI] [PubMed] [Google Scholar]
- 18.Pongs O, Lindemeier J, Zhu XR, Theil T, Engelkamp D, Krah-Jentgens, Lambrecht HG, Kock KW, Schwerner J, Rivosecchi R, Mallart A, Galceran J, Canal I, Barbas JA, Ferrus A. Neuron. 1993;11:15–28. doi: 10.1016/0896-6273(93)90267-u. [DOI] [PubMed] [Google Scholar]
- 19.McFerran BW, Graham ME, Burgoyne RD. J. Biol. Chem. 1998;273:22768–22772. doi: 10.1074/jbc.273.35.22768. [DOI] [PubMed] [Google Scholar]
- 20.Braunewell KH, Klein-Szanto AJ. Cell Tissue Res. 2009;335:301–316. doi: 10.1007/s00441-008-0716-3. [DOI] [PMC free article] [PubMed] [Google Scholar]
- 21.Bernstein HG, Baumann B, Danos P, Diekmann S, Bogerts B, Gundelfinger ED, Braunewell KH. J. Neurocytol. 1999;28:655–662. doi: 10.1023/a:1007056731551. [DOI] [PubMed] [Google Scholar]
- 22.An WF, Bowlby MR, Betty M, Cao J, Ling HP, Mendoza G, Hinson JW, Mattsson KI, Strassle BW, Trimmer JS, Rhodes KJ. Nature. 2000;403:553–6. doi: 10.1038/35000592. [DOI] [PubMed] [Google Scholar]
- 23.Carrion AM, Link WA, Ledo F, Mellstrom B, Naranjo JR. Nature. 1999;398:80–4. doi: 10.1038/18044. [DOI] [PubMed] [Google Scholar]
- 24.Buxbaum JD, Choi EK, Luo Y, Lilliehook C, Crowley AC, Merriam DE, Wasco W. Nat Med. 1998;4:1177–81. doi: 10.1038/2673. [DOI] [PubMed] [Google Scholar]
- 25.Kobayashi M, Takamatsu K, Saitoh S, Miura M, Noguchi T. Biochem. Biophys. Res. Commun. 1992;189:511–7. doi: 10.1016/0006-291x(92)91587-g. [DOI] [PubMed] [Google Scholar]
- 26.Kobayashi M, Takamatsu K, Saitoh S, Noguchi T. J. Biol. Chem. 1993;268:18898–904. [PubMed] [Google Scholar]
- 27.Tzingounis AV, Kobayashi M, Takamatsu K, Nicoll RA. Neuron. 2007;53:487–493. doi: 10.1016/j.neuron.2007.01.011. [DOI] [PMC free article] [PubMed] [Google Scholar]
- 28.Kapp Y, Melnikov S, Shefler A, Jeromin A, Sagi R. J. Immunol. 2003;171:5320–5327. doi: 10.4049/jimmunol.171.10.5320. [DOI] [PubMed] [Google Scholar]
- 29.Gomez M, De Castro E, Guarin E, Sasakura H, Kuhara A, Mori I, Bartfai T, Bargmann CI, Nef P. Neuron. 2001;30:241–248. doi: 10.1016/s0896-6273(01)00276-8. [DOI] [PubMed] [Google Scholar]
- 30.Hendricks KB, Wang BQ, Schnieders EA, Thorner J. Nature Cell Biol. 1999;1:234–241. doi: 10.1038/12058. [DOI] [PubMed] [Google Scholar]
- 31.Huttner IG, Strahl T, Osawa M, King DS, Ames JB, Thorner J. J. Biol. Chem. 2003;278:4862–4874. doi: 10.1074/jbc.M207920200. [DOI] [PubMed] [Google Scholar]
- 32.Hamasaki-Katagiri N, Molchanova T, Takeda K, Ames JB. J. Biol. Chem. 2004;279:12744–12754. doi: 10.1074/jbc.M311895200. [DOI] [PubMed] [Google Scholar]
- 33.Kawamura S. Nature. 1993;362:855–857. doi: 10.1038/362855a0. [DOI] [PubMed] [Google Scholar]
- 34.Erickson MA, Lagnado L, Zozulya S, Neubert TA, Stryer L, Baylor DA. Proc. Natl. Acad. Sci. USA. 1998;95:6474–9. doi: 10.1073/pnas.95.11.6474. [DOI] [PMC free article] [PubMed] [Google Scholar]
- 35.Makino CL, Dodd RL, Chen J, Burns ME, Roca A, Simon MI, Baylor DA. J. Gen. Physiol. 2004;123:729–741. doi: 10.1085/jgp.200308994. [DOI] [PMC free article] [PubMed] [Google Scholar]
- 36.Calvert PD, Klenchin VA, Bownds MD. J. Biol. Chem. 1995;270:24127–9. doi: 10.1074/jbc.270.41.24127. [DOI] [PubMed] [Google Scholar]
- 37.Klenchin VA, Calvert PD, Bownds MD. J. Biol. Chem. 1995;270:16147–16152. doi: 10.1074/jbc.270.27.16147. [DOI] [PubMed] [Google Scholar]
- 38.Chen CK, Inglese J, Lefkowitz RJ, Hurley JB. J. Biol. Chem. 1995;270:18060–18066. doi: 10.1074/jbc.270.30.18060. [DOI] [PubMed] [Google Scholar]
- 39.Komolov KE, Senin, I. I, Kovaleva NA, Christoph MP, Churumova VA, Grigoriev II, Akhtar M, Philippov PP, Koch KW. J. Neurochem. 2009;110:72–79. doi: 10.1111/j.1471-4159.2009.06118.x. [DOI] [PubMed] [Google Scholar]
- 40.Strissel KJ, Lishko PV, Trieu LH, Kennedy MJ, Hurley JB, Arshavsky VY. J. Biol. Chem. 2005;280:29250–29255. doi: 10.1074/jbc.M501789200. [DOI] [PubMed] [Google Scholar]
- 41.Polans AS, Buczylko J, Crabb J, Palczewski K. J. Cell Biol. 1991;112:981–989. doi: 10.1083/jcb.112.5.981. [DOI] [PMC free article] [PubMed] [Google Scholar]
- 42.Subramanian L, Polans AS. Biochem. Biophys. Res. Commun. 2004;322:1153–1165. doi: 10.1016/j.bbrc.2004.07.109. [DOI] [PubMed] [Google Scholar]
- 43.Palczewski K, Sokal I, Baehr W. Biochem. Biophys. Res. Commun. 2004;322:1123–1130. doi: 10.1016/j.bbrc.2004.07.122. [DOI] [PubMed] [Google Scholar]
- 44.Semple-Rowland SL, Gorczyca WA, Buczylko J, Helekar BS, Ruiz CC, Subbaraya I, Palczewski K, Baehr W. FEBS Lett. 1996;385:47–52. doi: 10.1016/0014-5793(96)00345-6. [DOI] [PubMed] [Google Scholar]
- 45.Sokal I, Li N, Surgucheva I, Warren MJ, Payne AM, Bhattacharya SS, Baehr W, Palczewski K. Mol. Cell. 1998;2:129–133. doi: 10.1016/s1097-2765(00)80121-5. [DOI] [PubMed] [Google Scholar]
- 46.Baehr W, Palczewski K. Subcell Biochem. 2007;45:71–91. doi: 10.1007/978-1-4020-6191-2_4. [DOI] [PubMed] [Google Scholar]
- 47.Bondarenko VA, Hayashi F, Usukura J, Yamazaki A. Mol. Cell Biochem. 2010;334:125–139. doi: 10.1007/s11010-009-0323-y. [DOI] [PubMed] [Google Scholar]
- 48.Jiang L, Baehr W. Adv. Exp. Med. Biol. 2010;664:273–282. doi: 10.1007/978-1-4419-1399-9_31. [DOI] [PMC free article] [PubMed] [Google Scholar]
- 49.Strahl T, Grafelmann B, Dannenberg J, Thorner J, Pongs O. J. Biol. Chem. 2003;278:49589–99. doi: 10.1074/jbc.M309017200. [DOI] [PubMed] [Google Scholar]
- 50.Strahl T, Huttner IG, Lusin JD, Osawa M, King D, Thorner J, Ames JB. J. Biol. Chem. 2007;282:30949–30959. doi: 10.1074/jbc.M705499200. [DOI] [PubMed] [Google Scholar]
- 51.Hama H, Schnieders EA, Thorner J, Takemoto JY, DeWald DB. J. Biol. Chem. 1999;274:34294–34300. doi: 10.1074/jbc.274.48.34294. [DOI] [PubMed] [Google Scholar]
- 52.Walch-Solimena C, Novick P. Nature Cell Biol. 1999;1:523–525. doi: 10.1038/70319. [DOI] [PubMed] [Google Scholar]
- 53.Nakamura TY, Pountney DJ, Ozaita A, Nandi S, Ueda S, Rudy B, Coetzee WA. Proc. Natl. Acad. Sci. U S A. 2001;98:12808–12813. doi: 10.1073/pnas.221168498. [DOI] [PMC free article] [PubMed] [Google Scholar]
- 54.Weiss JL, Archer DA, Burgoyne RD. J. Biol. Chem. 2000;275:40082–40087. doi: 10.1074/jbc.M008603200. [DOI] [PubMed] [Google Scholar]
- 55.Carrion AM, Mellstrom B, Naranjo JR. Mol Cell Biol. 1998;18:6921–9. doi: 10.1128/mcb.18.12.6921. [DOI] [PMC free article] [PubMed] [Google Scholar]
- 56.Cheng HY, Pitcher GM, Laviolette SR, Whishaw IQ, Tong KI, Ikura M, Salter MW, Penninger JM. Cell. 2002;108:31–43. doi: 10.1016/s0092-8674(01)00629-8. [DOI] [PubMed] [Google Scholar]
- 57.Lilliehook C, Bozdagi O, Yao J, Gomez-Ramirez M, Zaidi NF, Wasco W, Gandy S, Santucci AC, Haroutunian V, Huntley GW, Buxbaum JD. J. Neurosci. 2003;23:9097–9106. doi: 10.1523/JNEUROSCI.23-27-09097.2003. [DOI] [PMC free article] [PubMed] [Google Scholar]
- 58.Dizhoor AM, Ericsson LH, Johnson RS, Kumar S, Olshevskaya E, Zozulya S, Neubert TA, Stryer L, Hurley JB, Walsh KA. J. Biol. Chem. 1992;267:16033–6. [PubMed] [Google Scholar]
- 59.Ladant D. J. Biol. Chem. 1995;270:3179–3185. [PubMed] [Google Scholar]
- 60.Dizhoor AM, Chen CK, Olshevskaya E, Sinelnikova VV, Phillipov P, Hurley JB. Science. 1993;259:829–32. doi: 10.1126/science.8430337. [DOI] [PubMed] [Google Scholar]
- 61.Zozulya S, Stryer L. Proc. Natl. Acad. Sci. USA. 1992;89:11569–73. doi: 10.1073/pnas.89.23.11569. [DOI] [PMC free article] [PubMed] [Google Scholar]
- 62.Flaherty KM, Zozulya S, Stryer L, McKay DB. Cell. 1993;75:709–716. doi: 10.1016/0092-8674(93)90491-8. [DOI] [PubMed] [Google Scholar]
- 63.Weiergraber OH, Senin, I. I, Philippov PP, Granzin J, Koch KW. J. Biol. Chem. 2003;278:22972–22979. doi: 10.1074/jbc.M300447200. [DOI] [PubMed] [Google Scholar]
- 64.Babu YS, Bugg CE, Cook WJ. J. Mol. Biol. 1988;204:191–204. doi: 10.1016/0022-2836(88)90608-0. [DOI] [PubMed] [Google Scholar]
- 65.Herzberg O, James MN. J. Mol. Biol. 1988;203:761–779. doi: 10.1016/0022-2836(88)90208-2. [DOI] [PubMed] [Google Scholar]
- 66.Tanaka T, Ames JB, Harvey TS, Stryer L, Ikura M. Nature. 1995;376:444–7. doi: 10.1038/376444a0. [DOI] [PubMed] [Google Scholar]
- 67.Ames JB, Hamasaki N, Molchanova T. Biochemistry. 2002;41:5776–5787. doi: 10.1021/bi012153k. [DOI] [PubMed] [Google Scholar]
- 68.Ames JB, Ishima R, Tanaka T, Gordon JI, Stryer L, Ikura M. Nature. 1997;389:198–202. doi: 10.1038/38310. [DOI] [PubMed] [Google Scholar]
- 69.Lange C, Koch KW. Biochemistry. 1997;36:12019–12026. doi: 10.1021/bi970938d. [DOI] [PubMed] [Google Scholar]
- 70.Valentine KG, Mesleh MF, Opella SJ, Ikura M, Ames JB. Biochemistry. 2003;42:6333–6340. doi: 10.1021/bi0206816. [DOI] [PubMed] [Google Scholar]
- 71.Valentine KG, Peterson RW, Saad JS, Summers MF, Xu X, Ames JB, Wand AJ. Structure. 2010;18:9–16. doi: 10.1016/j.str.2009.11.010. [DOI] [PMC free article] [PubMed] [Google Scholar]
- 72.Stephen R, Bereta G, Golczak M, Palczewski K, Sousa MC. Structure. 2007;15:1392–1402. doi: 10.1016/j.str.2007.09.013. [DOI] [PMC free article] [PubMed] [Google Scholar]
- 73.Lim S, Strahl T, Thorner J, Ames JB. J. Biol. Chem. 2011;286:12565–12577. doi: 10.1074/jbc.M110.208868. [DOI] [PMC free article] [PubMed] [Google Scholar]
- 74.Olshevskaya EV, Hughes RE, Hurley JB, Dizhoor AM. J. Biol. Chem. 1997;272:14327–14333. doi: 10.1074/jbc.272.22.14327. [DOI] [PubMed] [Google Scholar]
- 75.Vijay-Kumar S, Kumar VD. Nature Struct. Biol. 1999;6:80–88. doi: 10.1038/4956. [DOI] [PubMed] [Google Scholar]
- 76.Bourne Y, Dannenberg J, Pollmann VV, Marchot P, Pongs O. J. Biol. Chem. 2001;276:11949–11955. doi: 10.1074/jbc.M009373200. [DOI] [PubMed] [Google Scholar]
- 77.Zhou W, Qian Y, Kunjilwar K, Pfaffinger PJ, Choe S. Neuron. 2004;41:573–586. doi: 10.1016/s0896-6273(04)00045-5. [DOI] [PubMed] [Google Scholar]
- 78.Scannevin RH, Wang K, Jow F, Megules J, Kopsco DC, Edris W, Carroll KC, Lu Q, Xu W, Xu Z, Katz AH, Olland S, Bowlby MR, Chanda P, Rhodes KJ. Neuron. 2004;41:587–598. doi: 10.1016/s0896-6273(04)00049-2. [DOI] [PubMed] [Google Scholar]
- 79.Ames JB, Hendricks KB, Strahl T, Huttner IG, Hamasaki N, Thorner J. Biochemistry. 2000;39:12149–61. doi: 10.1021/bi0012890. [DOI] [PubMed] [Google Scholar]
- 80.Ames JB, Dizhoor AM, Ikura M, Palczewski K, Stryer L. J Biol Chem. 1999;274:19329–37. doi: 10.1074/jbc.274.27.19329. [DOI] [PubMed] [Google Scholar]
- 81.Spilker C, Dresbach T, Braunewell KH. J. Neurosci. 2002;22:7331–7339. doi: 10.1523/JNEUROSCI.22-17-07331.2002. [DOI] [PMC free article] [PubMed] [Google Scholar]
- 82.Ermilov AN, Olshevskaya EV, Dizhoor AM. J. Biol. Chem. 2001;276:48143–48148. doi: 10.1074/jbc.M107539200. [DOI] [PubMed] [Google Scholar]
- 83.Krylov DM, Niemi GA, Dizhoor AM, Hurley JB. J. Biol. Chem. 1999;274:10833–10839. doi: 10.1074/jbc.274.16.10833. [DOI] [PubMed] [Google Scholar]
- 84.Tachibanaki S, Nanda K, Sasaki K, Ozaki K, Kawamura S. J. Biol. Chem. 2000;275:3313–3319. doi: 10.1074/jbc.275.5.3313. [DOI] [PubMed] [Google Scholar]
- 85.Olshevskaya EV, Boikov S, Ermilov A, Krylov D, Hurley JB, Dizhoor AM. J. Biol. Chem. 1999;274:10823–10832. doi: 10.1074/jbc.274.16.10823. [DOI] [PubMed] [Google Scholar]
- 86.Li C, Pan W, Braunewell KH, Ames JB. J. Biol. Chem. 2011;286:6354–6366. doi: 10.1074/jbc.M110.173724. [DOI] [PMC free article] [PubMed] [Google Scholar]
- 87.Osawa M, Dace A, Tong KI, Valiveti A, Ikura M, Ames JB. J Biol Chem in press. 2005 doi: 10.1074/jbc.M500338200. [DOI] [PubMed] [Google Scholar]
- 88.Olshevskaya EV, Ermilov AN, Dizhoor AM. J. Biol. Chem. 1999;274:25583–25587. doi: 10.1074/jbc.274.36.25583. [DOI] [PubMed] [Google Scholar]
- 89.Lusin JD, Vanarotti M, Li C, Valiveti A, Ames JB. Biochemistry. 2008;47:2252–2264. doi: 10.1021/bi7017267. [DOI] [PubMed] [Google Scholar]
- 90.Kim LA, Furst J, Butler MH, Xu S, Grigorieff N, Goldstein SA. J Biol Chem. 2004;279:5549–5554. doi: 10.1074/jbc.M311332200. [DOI] [PubMed] [Google Scholar]
- 91.Zhao CJ, Noack C, Brackmann M, Gloveli T, Maelicke A, Heinemann U, Anand R, Braunewell KH. Mol Cell Neurosci. 2009;40:280–292. doi: 10.1016/j.mcn.2008.11.001. [DOI] [PMC free article] [PubMed] [Google Scholar]
- 92.Lin L, Jeanclos EM, Treuil M, Braunewell KH, Gundelfinger ED, Anand R. J. Biol. Chem. 2002;277:41872–41878. doi: 10.1074/jbc.M206857200. [DOI] [PubMed] [Google Scholar]
- 93.Ames JB, Levay K, Wingard JN, Lusin JD, Slepak VZ. J Biol Chem. 2006;281:37237–37245. doi: 10.1074/jbc.M606913200. [DOI] [PubMed] [Google Scholar]
- 94.Higgins MK, Oprian DD, Schertler GF. J. Biol. Chem. 2006;281:19426–19432. doi: 10.1074/jbc.M602203200. [DOI] [PubMed] [Google Scholar]
- 95.Zernii E, Komolov K, Permyakov S, Kolpakova T, Dell Orco D, Poetzsch A, Permyakov E, Senin, I. I, Philippov PP, Koch KW. Biochem. J. 2011;435:441–450. doi: 10.1042/BJ20110013. [DOI] [PubMed] [Google Scholar]
- 96.Wang H, Yan Y, Liu Q, Huang Y, Shen Y, Chen L, Chen Y, Chai J. Nat. Neurosci. 2007;10:32–39. doi: 10.1038/nn1822. [DOI] [PubMed] [Google Scholar]
- 97.Pioletti M, Findeisen F, Hura GL, Minor DL. Nat. Struct. Mol. Biol. 2006;13:987–995. doi: 10.1038/nsmb1164. [DOI] [PMC free article] [PubMed] [Google Scholar]
- 98.Zheng Q, Bobich JA, Vidugiriene J, McFadden SC, Thomas F, Roder J, Jeromin A. J. Neurochem. 2005;92:442–451. doi: 10.1111/j.1471-4159.2004.02897.x. [DOI] [PubMed] [Google Scholar]
- 99.Haeseleer F, Imanishi Y, Sokal I, Filipek S, Palczewski K. Biochem Biophys Res Commun. 2002;290:615–623. doi: 10.1006/bbrc.2001.6228. [DOI] [PubMed] [Google Scholar]
- 100.Hoeflich KP, Ikura M. Cell. 2002;108:739–742. doi: 10.1016/s0092-8674(02)00682-7. [DOI] [PubMed] [Google Scholar]
- 101.Li N, Fariss RN, Zhang K, Otto-Bruc A, Haeseleer F, Bronson D, Qin N, Yamazaki A, Subbaraya I, Milam AH, Palczewski K, Baehr W. Eur J.Biochem. 1998;252:591–9. doi: 10.1046/j.1432-1327.1998.2520591.x. [DOI] [PubMed] [Google Scholar]
- 102.Holmqvist MH, Hernandez-Pineda CJ,R, Jacobson MD, Carroll KI, Sung MA, Betty M, An WF. Proc Natl Acad Sci U S A. 2002;99:1035–1040. doi: 10.1073/pnas.022509299. [DOI] [PMC free article] [PubMed] [Google Scholar]
- 103.Kuo HC, Cheng CF, Clark RB, Lin JJ, Lin JL, Hoshijima M, Nguyen-Tran VT, Gu Y, Ikeda Y, Chu PH, Ross J, Giles WR, Chien KR. J Biol Chem. 2001;278:36445–36454. [Google Scholar]
- 104.Venkataraman V, Duda T, Ravichandran S, Sharma RK. Biochemistry. 2008;47:6590–6601. doi: 10.1021/bi800394s. [DOI] [PMC free article] [PubMed] [Google Scholar]
- 105.Hyun JK, Yon C, Kim YS, Noh DY, Lee KH, Han JS. Mol. Cells. 2000;10:669–677. doi: 10.1007/s10059-000-0669-1. [DOI] [PubMed] [Google Scholar]
- 106.Nagata K, Puls A, Futter C, Aspenstrom P, Schaefer E, Nakata T, Hirokawa N, Hall A. EMBO J. 1998;17:149–158. doi: 10.1093/emboj/17.1.149. [DOI] [PMC free article] [PubMed] [Google Scholar]
- 107.Braunewell KH, Brackmann M, Schaupp M, Spilker C, Anand R, Gundelfinger ED. J. Neurochem. 2001;78:1277–1286. doi: 10.1046/j.1471-4159.2001.00506.x. [DOI] [PubMed] [Google Scholar]


