

Abstract
Capillary electrophoresis can provide fast and efficient separations of peptides. However, the high speed separation and limited loading capacity of capillary electrophoresis requires the use of a fast and sensitive detector. While laser-induced fluorescence provides exquisite sensitivity and millisecond response time, it inherently generates a low information content signal. In contrast, mass spectrometry provides an information rich signal that is attractive for peptide analysis. The recently introduced Velos-Orbitrap mass spectrometer is capable of fast and sensitive tandem MS acquisition and simultaneous high accuracy MS acquisition, which is well suited for coupling with fast and efficient separation methods for peptide analysis. We evaluated this instrument as a detector for peptide separation by capillary electrophoresis. In MS mode, we observed low attomole detection limits for a number of peptides in a tryptic digest of standard proteins with high mass resolution (30,000 at m/z 400). The response time of the Orbitrap at this resolution was ~0.70 seconds, which was adequate to reconstruct the peak shape and area of our electrophoretic peaks. The linear ion-trap successfully recorded tandem MS spectra of tryptic peptides at 20 nM concentration.
1. Introduction
Capillary electrophoresis provides efficient and rapid separations of amino acids, peptides, and proteins [1-3]. However, there are at least two important properties of capillary electrophoresis that have limited its widespread application for protein and peptide analysis. First, nanoliter injection volumes of relatively low concentration samples are required to preserve high efficiency separations. As a result, detection sensitivity often is insufficient for the study of trace components. As we have shown elsewhere, analyte concentration needs to be less than ~100 μM to minimize band broadening in capillary electrophoresis [4]. Stacking does not relax this requirement; the ionic strength of the sample must be significantly less than the ionic strength of the separation buffer to minimize peak distortions.
Second, a detector with fast response time is required in order to preserve separation efficiency. Based on Shannon’s theorem, a Gaussian peak may be reconstructed with high accuracy if it is sampled at a period equal to or less than its standard deviation [5]. Laser-induced fluorescence provides both exquisite sensitivity and response time for use in capillary electrophoresis. For example, we reported the use of ultrasensitive laser-induced fluorescence detection with 25 ms time constant for the separation of 500 zmol of fluorescein thiocarbamyl amino acids to produce >2.5 × 10⁶ theoretical plates [6]. While fluorescence detection can be used to generate exquisite separation efficiency, the information content of fluorescence detection is low, limiting its value in protein and peptide analysis.
Instead, mass spectrometry is an attractive detector for capillary electrophoresis studies of peptides and proteins. The rich information content of the mass spectrum, in combination with peptide identification through tandem mass spectrometry and database searching, has attracted a fair amount of attention. CE peptide migration times are predictable, making the technique suitable for quantitative proteomic analysis [7-8]. Being faster and complimentary to reverse phase liquid chromatography, it is well suited for coupling with the latter in the second dimension for comprehensive shotgun analysis of complex proteomic samples [9].
The history of capillary electrophoresis-electrospray mass spectrometry was recently reviewed [10-11]. Early CE-MS studies focused on evaluating the technique with a variety of MS analyzers, such as quadrupole [12-13], quadrupole ion trap [14], FTICR [15], time-of-flight [16-17], and ion-trap/time of flight [18]. In the early 1990’s, time-of-flight mass spectrometers were recognized as the instruments of choice for fast CE separations, since ion trap technology at that time could deliver less than one second scan speeds only at the gross expense of resolution.
The interface of capillary electrophoresis with electrospray mass spectrometry has been challenging. Interfaces may be divided into sheath-flow and sheathless designs. The sheath-flow interface employs a pump to provide a sheath fluid that surrounds the distal end of the capillary. That sheath fluid is connected to a power supply. The capillary is usually inserted within an emitter, and a nebulizer gas flow is often employed to stabilize the spray. Sheath-flow interfaces provide flexibility in the separation buffer, since the sheath fluid will dominate the composition of the electrospray [19]. However, the sample undergoes significant dilution by the sheath-flow because the typical sheath buffer flow rate of 1-2 μL/min is much higher than the electro-osmotic flow within the capillary. The best detection limits with a sheath-flow interface for peptides are 500 attomoles with pH mediated sample stacking [20].
Sheathless interfaces employ some form of electrical connection to the distal tip of the capillary, which also serves as the emitter. Differences in sheathless interface designs are mostly due to different approaches in closing electrical circuit [21]. In one approach, the terminus of the separation capillary is etched with hydrofluoric acid to render the capillary wall porous to small ions [22-23]. Electrical connection is made through a solution in contact with the etched region. The sheathless interface does not dilute the sample during spray, and tends to produce better detection limits than the sheath-flow interfaces. The sheathless interfaces suffer from a number of disadvantages. The choice of separation buffer is limited since that buffer must also support electrospray. Method development is hampered because any change in electro-osmotic flow will affect the spray stability. Capillaries with smaller inner diameters serve as better emitters, but have reduced loading capacity.
In this manuscript, we report the use of an electrokinetically driven sheath-flow electrospray interface with a high-resolution mass spectrometer [24]. This interface operates in the nanospray regime with a minimal sheath liquid dilution, offering improvement in sensitivity as compared to commercial sheath flow interfaces. At the same time, it retains the versatility of a sheath liquid interface. In addition, the sheath liquid does not require mechanical pumping or nebulizer gas. We employ an LTQ Orbitrap Velos mass spectrometer [25]. This instrument combines a dual-pressure linear trap and a high resolution Orbitrap mass analyzers. This instrument is capable of simultaneous acquisition of high-resolution precursor masses in the Orbitrap mass analyzer and up to 10 tandem mass spectra per second in the linear ion trap portion of the instrument.
A CE-Orbitrap separation has been recently reported [26]. That report employed a rather fragile and expensive etched-capillary interface, and produced mid-attomole detection limits for standard peptides separated in a coated capillary. Rather long capillaries and modest electric fields were employed in the separation, likely reflecting limitations in the commercial electrospray interface.
In contrast, the CE-MS interface developed in our lab allows for the operation with a wide range of separation voltages. In addition, the interface allows the use of short and inexpensive uncoated fused silica capillaries, and high electroosmotic flow separation conditions with alkaline buffers. These operational conditions are suitable for achieving fast and efficient separations, In this study we evaluated the capability of the LTQ Velos and the Orbitrap mass analyzer to handle narrow electrophoretic peaks and narrow separation time windows in the context of high-speed peptide separations.
2. Materials and methods
2.1 Reagents
All reagents were purchased from Sigma Aldrich Co. (St.Louis, MO, USA) unless otherwise noted. Peptide standards were purchased from Anaspec, Inc. (San Jose, CA, USA). Borosilicate capillaries for electrospray emitters were purchased from Sutter Instrument Co. (Novato, CA, USA). Fused-silica separation capillaries were purchased from Polymicro Technologies (Phoenix, AZ, USA). PEEK cross, nuts, ferrules, sleeves and PHFA tubing were purchased from Idex Health and Science (Oak Harbor, WA, USA).
In preparation of a tryptic digest of four standard bovine proteins (α-casein, β-casein, α-lactabumin and serum albumin), 100 µM equimolar protein mix was prepared in 20 mM ammonium bicarbonate, pH 7.8. The mix was digested overnight at 30 °C, with trypsin at 1:100 enzyme-to-protein ratio. The aliquots were stored at -20 °C and thawed promptly before use.
2.2 Yeast culture
Yeast strain S288c, obtained from ATCC, was grown in YPD broth to 1.0 OD at 600 nm. Cells were spun down at 2000 g for 15 minutes at 4 °C, washed, resuspended in iced water, and transferred to Eppendorf tubes. After spinning the tubes at 14K g for 5 minutes, the supernatant was removed. Cell pellets were then resuspended in lysis buffer containing 8 M urea, 50 mM Tris pH 8, 75 mM NaCl and protease inhibitor cocktail (Roche Diagnostics, Indianapolis, IN). Cells were lysed with glass beads three times for 90 seconds at 4°C. The lysate was spun down at 10k g for 5 minutes. The protein concentration of the supernatant was measured by BCA assay (Thermo Scientific, Rockford, IL)). The lysate was diluted 1:5 to reduce the concentration of urea. The sample was denatured with 5 mM DTT at 56°C for 25 minutes. Disulfide bonds were reduced during a 30 minute incubation in the dark with 14 mM iodoacetamide. The reaction was quenched by additional 5 mM DTT, followed by incubation in the dark for 15 minutes. The sample was digested overnight at 37 °C with sequencing grade trypsin (Promega) at 1:200 enzyme to protein ratio. 1 mg of yeast protein sample was desalted with Waters Sep pack Vac tC18 SPE cartridge, (Milford, MA) and the 10% acetonitrile fraction was collected, vacuum dried, resuspended in separation buffer, and stored at 20 °C before analysis.
2.3 Capillary electrophoresis
The electro-kinetically driven electrospray interface was setup as previously described [24]. The interface was mounted on the board attached to a base of a Thermo nanospray interface. Briefly, the separation capillary was threaded into a borosilicate glass emitter using a cross fitting. The distance between capillary and the emitter exit was 1-mm and the emitter was placed 2-mm away from the ion transfer capillary. The top of the sheath liquid was maintained level with the ESI emitter.
Capillaries were conditioned with 0.1 M HCl, followed by 1 M NaOH, and then separation buffer, all pumped at 10 psi pressure for 5 min before use. Two Spellman CZE 1000R power supplies controlled by Labview were used to supply separation and electrospray voltage via platinum electrodes. Electrospray voltage of 1 kV was supplied by an electrode placed in sheath liquid reservoir. The 300 V/cm separations were performed with 30 cm and 60 cm fused silica capillaries, 50 μm i.d. and 150 μm o.d. The separation buffer was 10 mM ammonium acetate (pH 7), and the sheath liquid consisted of 10 mM acetic acid in 50% methanol.
2.4 Mass Spectrometry
Experiments were performed with a Thermo Orbitrap Velos in positive ion mode. The ion transfer capillary was set at the temperature of 300 °C and S-lens RF level was 55%. Full scan MS spectra were acquired at 400-2000 m/z range. Ion selection threshold was 500 counts for MS/MS, and the maximum allowed ion accumulation times were 70 ms for full scans and 100 ms for CID-MS/MS measurements in the linear ion trap (LTQ). An activation q _ 0.25 and activation time of 10 ms were used. All samples were analyzed in triplicates.
High resolution MS precursor scans were acquired in the Orbitrap simultaneously with either full MS scans or CID-MS/MS scans in the LTQ. The number of ions accumulated was set to 1 million for Orbitrap scans, 30,000 for linear ion trap MS scans, and 3,000 for linear ion trap MS/MS scans. 2, 5 and 8 linear ion trap scans were acquired for every 7.5k, 30K and 60K resolution Orbitrap scan, respectively. Raw files were converted to MZXML [27] and analyzed by MATLAB.
For database searching, raw data files were converted to MS2 format [28] and analyzed by Hardklor [29] followed by Bullseye [30]. Database search was performed with Sequest 27, yeast-200209-contam.fasta and its corresponding reversed-sequence decoy database. Sequest search parameters included tryptic peptides with up to two miscleavages, and dynamic modifications (sodium adducts on Glutamic and Aspartic Acid and phosphorylation of Serine). Sequest results were filtered with Percolator [31] and protein inference on experimental replicates was performed using a modified version of IDPicker [32].
3. Results and discussion
3.1. Effect of Orbitrap resolution on electrophoretic peak width
The acquisition rate of the Orbitrap mass analyzer depends on the desirable resolution and is usually much slower than the acquisition rate of the linear ion trap.
Accurate reconstruction of a Gaussian peak is possible in the electropherogram at a time period given by the peak’s standard deviation. For the conditions used in this paper, typical peak standard deviations are ~1-s, which is similar to the sampling period of the Orbitrap when operated at 60K mass resolution. The sampling period decreases at lower mass resolution, which allows faithful characterization of higher-speed electrophoretic peaks at lower Orbitrap resolution.
To test the effect of the Orbitrap in reconstructing the electrophoresis peaks, we performed MS acquisition simultaneously with the Orbitrap and with the LTQ. The Orbitrap was evaluated at a resolution of 7.5K, 30K and 60K. The average Orbitrap sampling period was 0.43 s at 7.5K resolution, while the sampling period increased to 1.1 s at 60K resolution. The LTQ sampling period was 0.2 s, and essentially independent of Orbitrap resolution. This high sampling rate ensures accurate reconstruction of the electropherogram.
We injected a 5-μM solution of the tryptic digest of four standard proteins (α -casein, β -casein, α-lactalbumin, and bovine serum albumin). We then generated selected ion electropherograms at 75 different m/z values, each from a different peptide. Finally, we performed an unsupervised nonlinear regression on the raw selected ion electropherograms for both the Orbitrap and linear ion trap.
Fig. 1 presents a base peak electropherogram for this sample using the Orbitrap at 7.5K mass resolution (at m/z = 400). The electropherogram consists of a set of peaks that correspond to peptides with charges ranging from +4 to -1. The separation window is roughly two minutes. This short separation window is an extreme example chosen to test the performance of the Orbitrap instrument under high-speed separations.
Fig. 1.
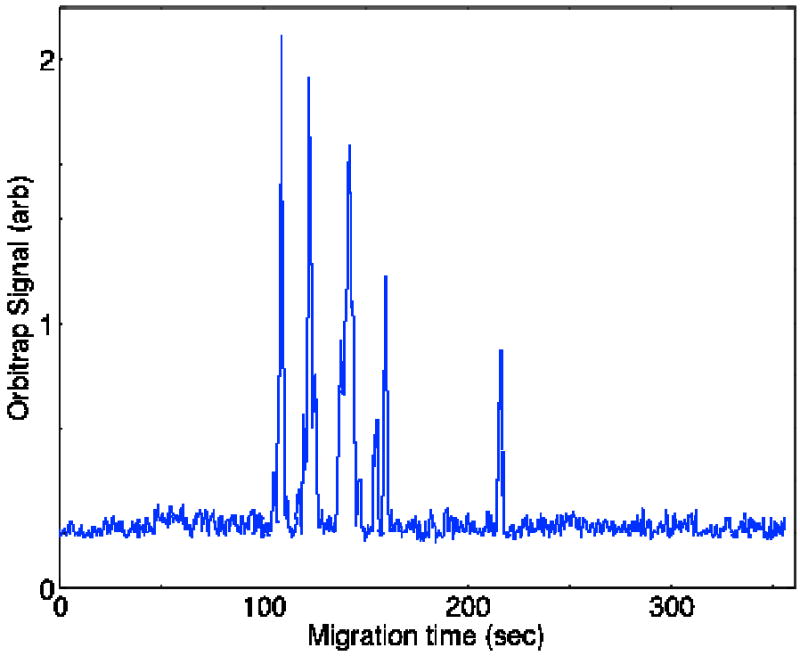
Base peak electropherogram of a set of tryptic peptides generated from four standard proteins using the Orbitrap mass spectrometer.
Figure 2 presents the selected ion electropherogram of 11 peptides from this mixture for the Orbitrap (at 60K resolution) and the linear ion trap. Before plotting, the linear ion trap data were filtered with a median filter and then a 0.3 s wide Gaussian function; the Orbitrap data were unfiltered. The median peak width is 1.2 ± 0.2 s for both the unfiltered linear ion trap and Orbitrap peaks. The theoretical plate counts were relatively low for this separation, 16,000 ± 6,000, which is a result of the relatively large injection volume used in the experiment.
Fig. 2.
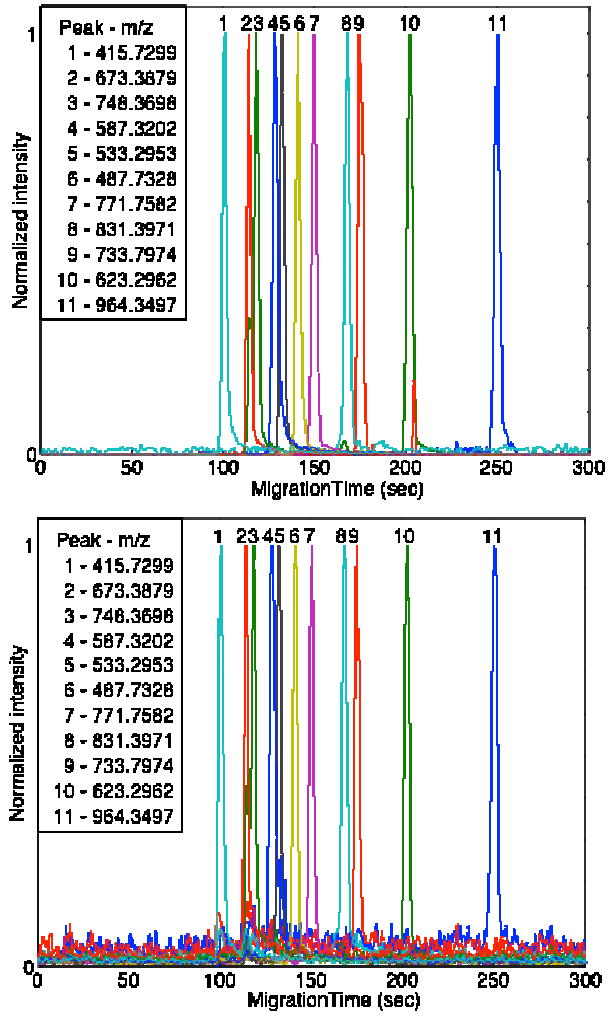
Selected ion electropherogram ten tryptic peptides generated from four standard proteins. Peaks are plotted normalized to unit intensity. A. Orbitrap data. B. Linear ion trap data. For both cases, spectra were recorded from m/z = 400 to 2,000. Linear ion trap data were filtered first with a 3 point median filter and then a 2 point Gaussian filter.
Nonlinear regression analysis was used to fit Gaussian functions to a set of 57 peaks taken from the tryptic digest of four proteins. Fig 3 presents a plot of the peak width obtained from the Orbitrap and linear ion trap. As expected, the peak widths are essentially identical (slope = 1.00 ± 0.02, intercept = 0.12 ± 0.05, r = 0.985, n = 57). The Orbitrap data acquisition rate is sufficient to reproduce the shape of the peaks, even at a resolution of 60K at m/z = 500. The ability of the Orbitrap mass analyzer to reconstruct narrow peaks makes it a suitable tool for quantitative analysis while coupled with efficient capillary electrophoretic separations.
Fig. 3.
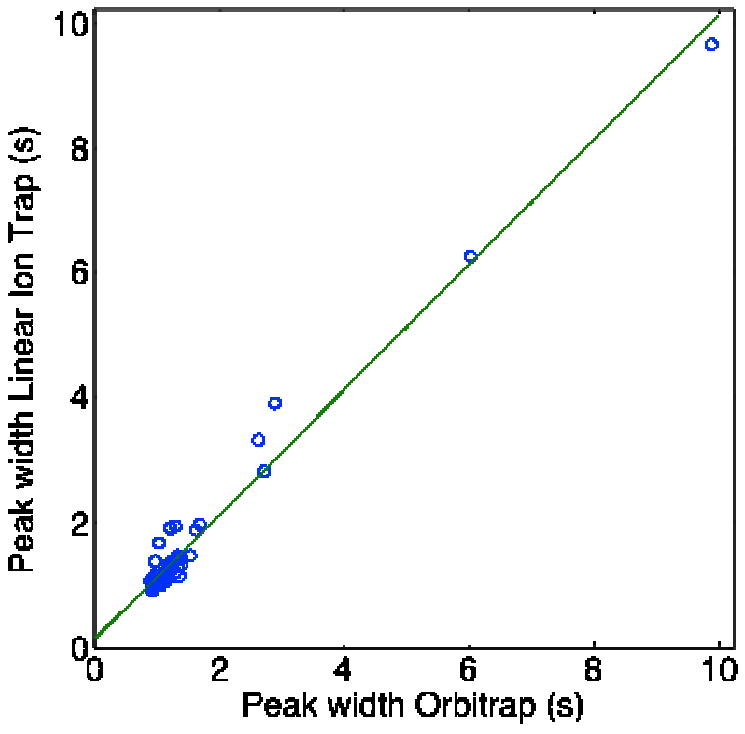
Correlation between peak widths obtained with the Orbitrap and linear ion trap mass spectrometers during the capillary electrophoretic separation of tryptic peptides produced from digestion of four standard proteins. Resolution = 60K at m/z = 500.
3.2 CE-Precursor ion Calibration curve
A calibration curve was constructed by serial dilution of the tryptic digest of the four standard proteins. The diluted digests were analyzed using the Orbitrap operating at 30K resolution. A calibration curve was constructed for 55 peptides. In each case, the electropherogram for the corresponding m/z value was fit with a Gaussian peak using an unsupervised nonlinear regression analysis. A calibration curve was constructed from the peak heights.
To estimate for noise in determining the detection limit, we measured the standard deviation of the background signal from the first 180 seconds of the set of 12 runs at each of the 55 m/z values. The average noise was determined for the set of 12 runs. Detection limit was estimated as three times the average noise divided by the slope of the calibration curve. Figure 4 presents a histogram of the detection limits for the 55 peptides, which ranged from 3 amol to 3 fmol injected onto the capillary, with a median of 20 amol (range of 300 pM to 300 nM, median of 2 nM).
Fig. 4.
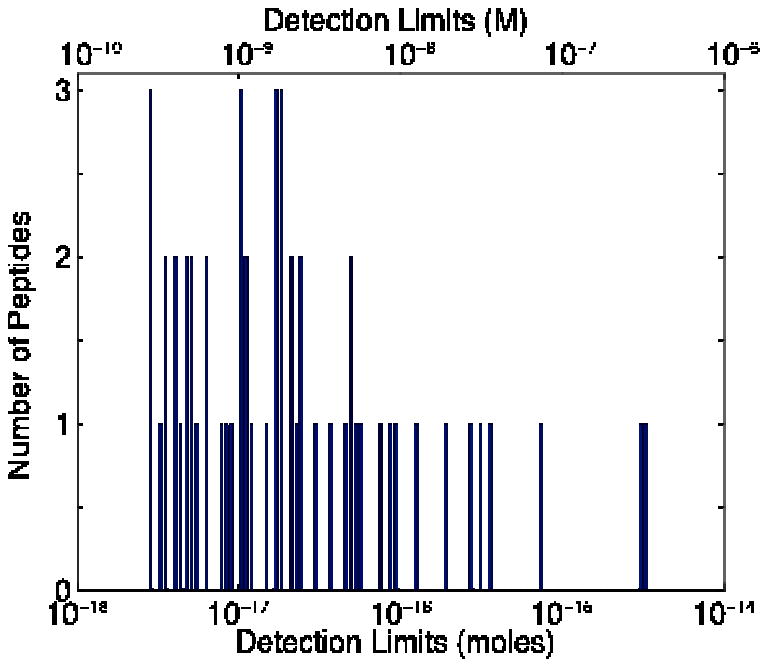
Histogram of detection limits (3 σ) for a set of 55 peptides from the tryptic digest of four standard proteins. Concentration detection limits are on the upper axis; mass detection limits on the lower axis.
Our modified CE-MS interface operates in a nanospray regime and employs minimal sample dilution. The peptide limits of detection achieved in our separations are at the low attomol level, comparable to those achieved in the previous studies with the shealthless interface [26]. The detection limits are at least an order of magnitude better than the ones achievable with a commercial sheath flow interface.
3.3 CE-Tandem MS analysis of tryptic digest of standard proteins
The LTQ Orbitrap Velos is capable of acquiring high-resolution precursor ion scans in the Orbitrap simultaneously with fast and sensitive tandem MS scans in the linear ion trap. Tandem MS spectra were simultaneously recorded with the precursor ion mass spectra during construction of the calibration curve for the tryptic digest of four standard proteins. Database searches were performed on the tandem MS spectrum. Figure 5 summarizes number peptide IDs detected with 0.1% FDR at different protein concentrations. The 20 nM protein digest was sufficient to identify all the proteins in the mixture with confident peptide IDs.
Fig. 5.
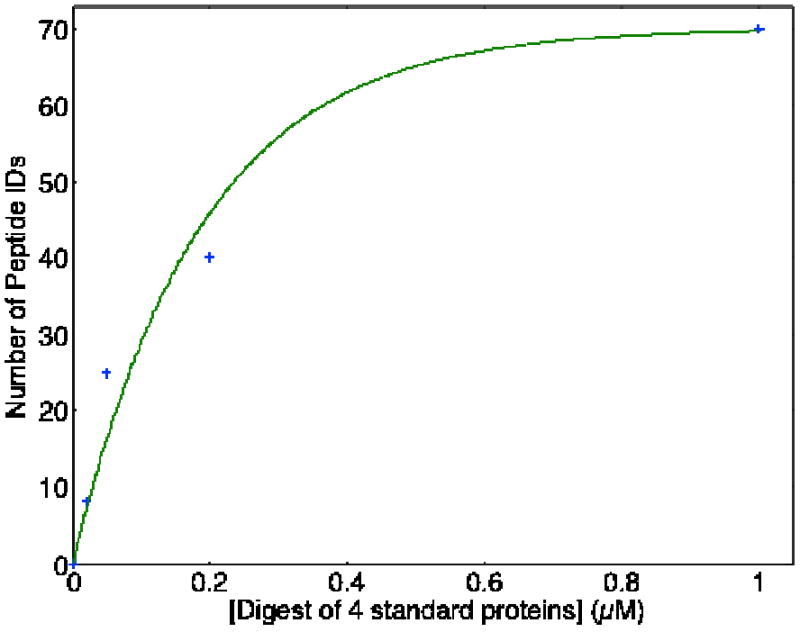
Number of unique peptide IDs (0.1%FDR) in triplicate runs of a four protein tryptic digest. The smooth curve is the result of a nonlinear least square fit of Peptide IDs = A*{1-exp(-B*[standards])}, where A = 70, B = 5.3 × 10⁶.
3.4 CE-Tandem MS analysis of tryptic digest of yeast homogenate
Fast proteomic separations are desirable due to high costs and limited access of mass spectrometers. However, narrow separation time windows pose a challenge to relatively slow tandem MS acquisition.
To evaluate the performance of the Orbitrap-Velos mass spectrometer for rapid capillary electrophoretic separation of a complex sample, a 10% acetonitrile solid-phase extraction fraction of peptides from a yeast lysate was analyzed using data dependent acquisition. Fig. 6 presents the base peak electropherogram for the sample. Like the data in Figs. 2 and 3, the separation is complete in ~5 minutes, and the separation window is roughly 2 minutes in duration.
Fig 6.
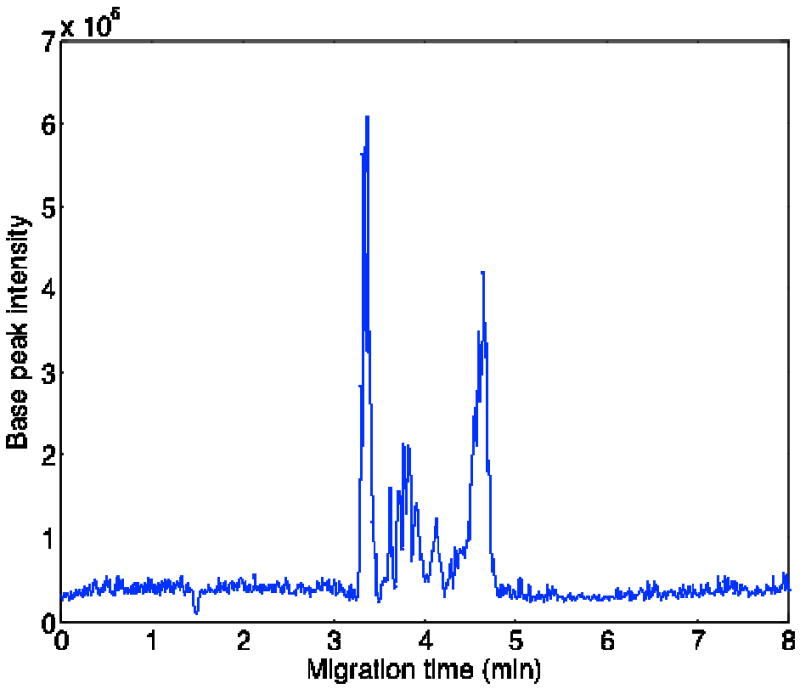
Base peak precursor ion electropherogram of the 10% acetonitrile fraction from a tryptic digest of a yeast lysate. Data were obtained with 30K Orbitrap resolution.
Combined database search results from triplicate runs generated 49 protein groups in a six minute separation time window, with the protein abundance ranging from <50 to over a million copies per cell [33]. Fig. 7 presents a histogram of the pI prediction for these peptides. There is no indication of bias for basic peptides, despite applying electrokinetic injection and separation in an alkaline buffer.
Fig 7.
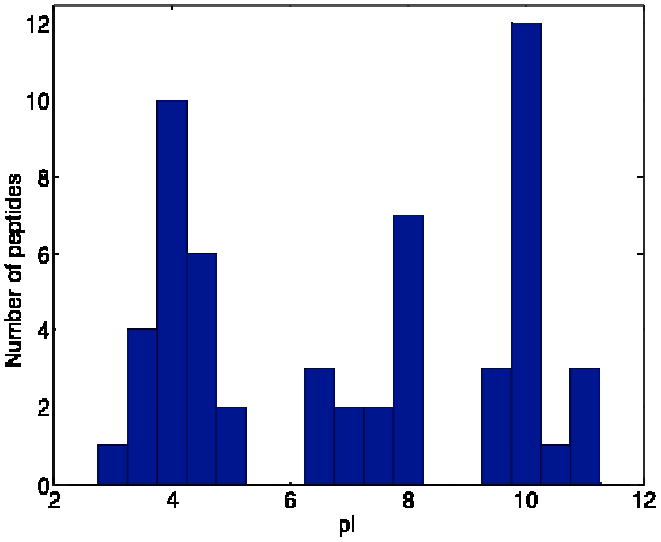
Histogram of the pI distribution of unique peptides identified t 0.1% FDR in a 10% ACN SPE fraction of yeast lysate
Although good CE peptide separations can be achieved in a variety of pH conditions, separations in alkaline environment and uncoated capillaries have proven to be simple, fast and robust [2]. Our system employs an acidic sheath liquid and operates in the nanospray regime, which alters the pH at the electrospray emitter [34-35], allowing for positive mode MS analysis of acidic peptides, even though they are negatively charged in the alkaline separation buffer.
4.Conclusions
The Velos-Orbitrap mass spectrometer is an interesting detector for the capillary electrophoresis separation of peptides. The instrument provides very high resolution MS analysis along with tandem mass spectra acquisition rates approaching 10 Hz.
We also employ a very low flow rate sheath-flow electrospray interface. This interface is based on electrokinetic pumping of the sheath liquid and the system operates in the nanospray regime. As a result, the system provides great flexibility in separation buffers, and allows the use of uncoated and inexpensive capillaries for separation. When combined with the Velos-Orbitrap instrument, detection limits in MS mode are in the low attomole range (high picomolar concentration range) for selected peptides, which is comparable with the best capillary electrophoresis/mass spectrometry detection limits for peptide analysis
We operated our separation with a short time window, which is ideal for analysis of simple samples. This separation condition is inappropriate for analysis of complex mixtures. The limited separation window only allows generation of ~100 tandem mass spectra during the separation window, which severely limits the number of identified peptides from complex samples. However, it is trivial to extend the separation window by manipulation of the separation conditions. Ultimately, we expect that the ideal application of capillary electrophoresis will be for the analysis of relatively modest complexity samples generated by a chromatographic preseparation of a more complex sample. Such experiments will be described in a subsequent publication.
Acknowledgments
This work was funded by a grant from the National Institutes of Health (R01RR031475).
Footnotes
Publisher's Disclaimer: This is a PDF file of an unedited manuscript that has been accepted for publication. As a service to our customers we are providing this early version of the manuscript. The manuscript will undergo copyediting, typesetting, and review of the resulting proof before it is published in its final citable form. Please note that during the production process errors may be discovered which could affect the content, and all legal disclaimers that apply to the journal pertain.
Literature cited
- 1.Jorgenson JW, Lukacs KD. Zone Electrophoresis in Open-Tubular Glass-Capillaries. Anal Chem. 1981;53:1298–1302. [PubMed] [Google Scholar]
- 2.Jorgenson JW, Lukacs KD. Capillary Zone Electrophoresis. Science. 1983;222:266–272. doi: 10.1126/science.6623076. [DOI] [PubMed] [Google Scholar]
- 3.Lauer HH, McManigill D. Capillary Zone Electrophoresis of Proteins in Untreated Fused-Silica Tubing. Anal Chem. 1986;58:166–170. [Google Scholar]
- 4.Dada OO, Essaka DC, Hindsgaul O, Palcic MM, Prendergast J, Schnaar RL, Dovichi NJ. Nine orders of magnitude dynamic range: picomolar to millimolar concentration measurement in capillary electrophoresis with laser induced fluorescence detection employing cascaded avalanche photodiode photon counters. Anal Chem. 2011;83:2748–2753. doi: 10.1021/ac103374x. [DOI] [PMC free article] [PubMed] [Google Scholar]
- 5.Duell KA, Avery JP, Rowlen KL, Birks JW. Exchange Of Comments On Data Acquisition For Chromatographic Peaks. Anal Chem. 1991;63:73–75. [Google Scholar]
- 6.Cheng YF, Wu SL, Chen DY, Dovichi NJ. Interaction Of Capillary Zone Electrophoresis With A Sheath Flow Cuvette Detector. Anal Chem. 1990;62:496–503. [Google Scholar]
- 7.Elliot MH, Smith DS, Parker CE, Borchers C. Current trends in quantitative proteomics. J Mass Spectrom. 2009;44:1637–1660. doi: 10.1002/jms.1692. [DOI] [PubMed] [Google Scholar]
- 8.Finney GL, Blackler AR, Hoopmann MR, Canterbury JD, Wu CC, MacCoss MJ. Label-free comparative analysis of proteomics mixtures using chromatographic alignment of high-resolution muLC-MS data. Anal Chem. 2008;80:961–971. doi: 10.1021/ac701649e. [DOI] [PubMed] [Google Scholar]
- 9.Lewis KC, Opiteck GJ, Jorgenson JW, Sheeley DM. Comprehensive online RPLC-CZE-MS of peptides. J Am Soc Mass Spectrom. 1997;8:495–509. [Google Scholar]
- 10.Maxwell EJ, Chen DDY. Twenty years of interface development for capillary electrophoresis-electrospray ionization-mass spectrometry. Anal Chim Acta. 2008;627:25–33. doi: 10.1016/j.aca.2008.06.034. [DOI] [PubMed] [Google Scholar]
- 11.Pantuckova P, Gebauer P, Bocek P, Krivankova L. Recent advances in CE-MS: Synergy of wet chemistry and instrumentation innovations. Electrophoresis. 2011;32:43–51. doi: 10.1002/elps.201000382. [DOI] [PubMed] [Google Scholar]
- 12.Olivares JA, Nguyen NT, Yonker CR, Smith RD. On-line mass spectrometric detection for capillary zone electrophoresis. Anal Chem. 1987;59:1230–1232. [Google Scholar]
- 13.Smith RD, Barinaga CJ, Udseth HR. Improved Electrospray Ionization Interface for Capillary Zone Electrophoresis - Mass-Spectrometry. Anal Chem. 1988;60:1948–1952. [Google Scholar]
- 14.Lee ED, Mück W, Henion JD, Covey TR. Liquid junction coupling for capillary zone electrophoresis/ion spray mass spectrometry. Biomed Environ Mass Spectrom. 1989;18:844–850. [Google Scholar]
- 15.Hofstadler SA, Wahl JH, Bruce JE, Smith RD. On-line capillary electrophoresis with Fourier transform ion cyclotron resonance mass spectrometry. J Am Chem Soc. 1993;115:6983–6984. doi: 10.1016/1044-0305(94)87014-4. [DOI] [PubMed] [Google Scholar]
- 16.Fang LL, Zhang R, Williams ER, Zare RN. Online Time-of-Flight Mass Spectrometric Analysis of Peptides Separated by Capillary Electrophoresis. Anal Chem. 1994;66:3696–3701. [Google Scholar]
- 17.Muddiman DC, Rockwood AL, Gao QY, Severs JC, Udseth HR, Smith RD. Application of Sequential Paired Covariance to Capillary Electrophoresis Electrospray Ionization Time-of-Flight Mass Spectrometry: Unraveling the Signal from the Noise in the Electropherogram. Anal Chem. 1995;67:4371–4375. [Google Scholar]
- 18.Wu JT, Qian MG, Li MX, Liu L, Lubman DM. Use of an ion trap storage/reflectron time-of-flight mass spectrometer as a rapid and sensitive detector for capillary electrophoresis in protein digest analysis. Anal Chem. 1996;68:3388–3396. doi: 10.1021/ac960405v. [DOI] [PubMed] [Google Scholar]
- 19.Maxwell EJ, Zhong XF, Zhang H, van Zeijl N, Chen DDY. Decoupling CE and ESI for a more robust interface with MS. Electrophoresis. 2010;31:1130–1137. doi: 10.1002/elps.200900517. [DOI] [PubMed] [Google Scholar]
- 20.Neususs C, Pelzing M, Macht M. A robust approach for the analysis of peptides in the low femtomole range by capillary electrophoresis-tandem mass spectrometry. Electrophoresis. 2002;23:3149–3159. doi: 10.1002/1522-2683(200209)23:18<3149::AID-ELPS3149>3.0.CO;2-8. [DOI] [PubMed] [Google Scholar]
- 21.Zamfir AD. Recent advances in sheathless interfacing of capillary electrophoresis and electrospray ionization mass spectrometry. J Chromatogr A. 2007;1159:2–13. doi: 10.1016/j.chroma.2007.03.115. [DOI] [PubMed] [Google Scholar]
- 22.Busnel JM, Schoenmaker B, Ramautar R, Carrasco-Pancorbo A, Ratnayake C, Feitelson JS, Chapman JD, Deelder AM, Mayboroda OA. High Capacity Capillary Electrophoresis-Electrospray Ionization Mass Spectrometry: Coupling a Porous Sheathless Interface with Transient-Isotachophoresis. Anal Chem. 2010;82:9476–9483. doi: 10.1021/ac102159d. [DOI] [PubMed] [Google Scholar]
- 23.Moini M. Simplifying CE-MS operation. 2. Interfacing low-flow separation techniques to mass spectrometry using a porous tip. Anal Chem. 2007;79:4241–4246. doi: 10.1021/ac0704560. [DOI] [PubMed] [Google Scholar]
- 24.Wojcik R, Dada OO, Sadilek M, Dovichi NJ. Simplified capillary electrophoresis nanospray sheath-flow interface for high efficiency and sensitive peptide analysis. Rapid Commun Mass Spectrom. 2010;24:2554–2560. doi: 10.1002/rcm.4672. [DOI] [PubMed] [Google Scholar]
- 25.Hu Q, Noll RJ, Li H, Makarov A, Hardman M, Cooks RG. The Orbitrap: a new mass spectrometer. J Mass Spectrom. 2005;40:430–443. doi: 10.1002/jms.856. [DOI] [PubMed] [Google Scholar]
- 26.Faserl K, Sarg B, Kremser L, Lindner H. Optimization and evaluation of a sheathless capillary electrophoresis-electrospray ionization mass spectrometry platform for Peptide analysis: comparison to liquid chromatography-electrospray ionization mass spectrometry. Anal Chem. 2011;83:7297–7305. doi: 10.1021/ac2010372. [DOI] [PubMed] [Google Scholar]
- 27.Pedrioli PGA, et al. A common open representation of mass spectrometry data and its application to proteomics research. Nature Biotechnology. 2004;22:1459–1466. doi: 10.1038/nbt1031. [DOI] [PubMed] [Google Scholar]
- 28.McDonald WH, et al. MS1, MS2, and SQT - three unified, compact, and easily parsed file formats for the storage of shotgun proteomic spectra and identifications. Rapid Communications in Mass Spectrometry. 2004;18:2162–2168. doi: 10.1002/rcm.1603. [DOI] [PubMed] [Google Scholar]
- 29.Hoopmann MR, Finney GL, MacCoss MJ. High-speed data reduction, feature detection and MS/MS spectrum quality assessment of shotgun proteomics data sets using high-resolution mass Spectrometry. Anal Chem. 2007;79:5620–5632. doi: 10.1021/ac0700833. [DOI] [PMC free article] [PubMed] [Google Scholar]
- 30.Hsieh EJ, Hoopmann MR, MacLean B, MacCoss MJ. Comparison of Database Search Strategies for High Precursor Mass Accuracy MS/MS Data. J Proteome Res. 2010;9:1138–1143. doi: 10.1021/pr900816a. [DOI] [PMC free article] [PubMed] [Google Scholar]
- 31.Zhang B, Chambers MC, Tabb DL. Proteomic parsimony through bipartite graph analysis improves accuracy and transparency. J Proteome Res. 2007;6:3549–3557. doi: 10.1021/pr070230d. [DOI] [PMC free article] [PubMed] [Google Scholar]
- 32.Kall L, Canterbury JD, Weston J, Noble WS, MacCoss MJ. Semi-supervised learning for peptide identification from shotgun proteomics datasets. Nature Methods. 2007;4:923–925. doi: 10.1038/nmeth1113. [DOI] [PubMed] [Google Scholar]
- 33.Ghaemmaghami S, Huh W, Bower K, Howson RW, Belle A, Dephoure N, O&Shea EK, Weissman JS. Global analysis of protein expression in yeast. Nature. 2003;425:737–741. doi: 10.1038/nature02046. [DOI] [PubMed] [Google Scholar]
- 34.Wilm M, Mann M. Analytical properties of the nanoelectrospray ion source. Anal Chem. 1996;68:1–8. doi: 10.1021/ac9509519. [DOI] [PubMed] [Google Scholar]
- 35.VanBerkel GJ, Zhou FM, Aronson JT. Changes in bulk solution pH caused by the inherent controlled-current electrolytic process of an electrospray ion source. Int Journal Mass Spectrom Ion Processes. 1997;162:55–67. [Google Scholar]