
Fig. 2.
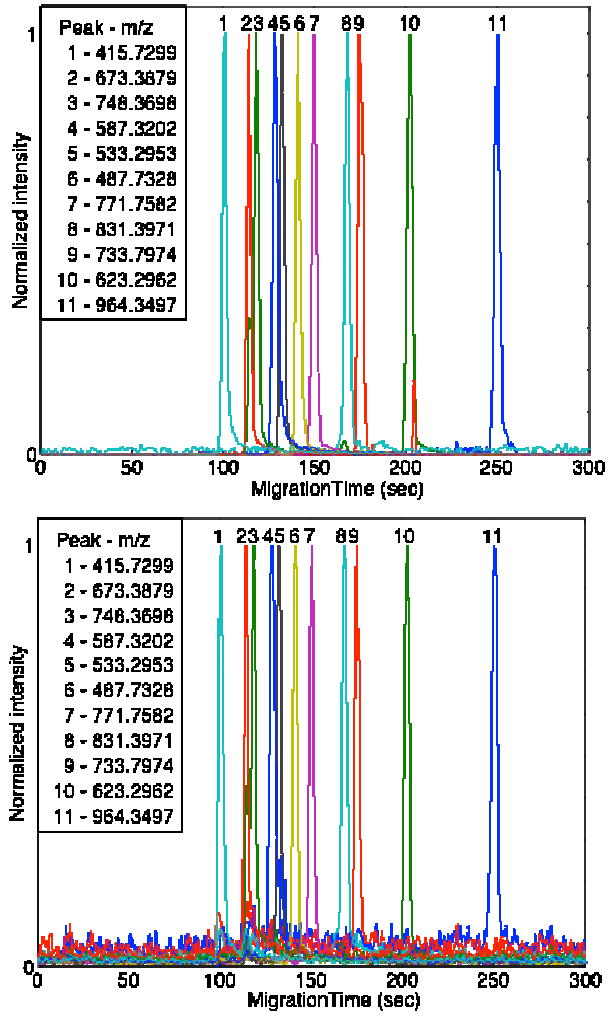
Selected ion electropherogram ten tryptic peptides generated from four standard proteins. Peaks are plotted normalized to unit intensity. A. Orbitrap data. B. Linear ion trap data. For both cases, spectra were recorded from m/z = 400 to 2,000. Linear ion trap data were filtered first with a 3 point median filter and then a 2 point Gaussian filter.