

Abstract
Background and Purpose
Our goal was to investigate whether certain metabolites, specific to neurons, glial cells, or the neuronal-glial neurotransmission system, in primary motor cortices (M1), are altered and correlated with clinical motor severity in chronic stroke.
Methods
Fourteen survivors of a single ischemic stroke located outside the M1 and 14 age-matched healthy control subjects were included. At >6 months after stroke, N-acetylaspartate, myo-inositol, and glutamate/glutamine were measured using proton magnetic resonance spectroscopic imaging (in-plane resolution=5×5 mm2) in radiologically normal-appearing gray matter of the hand representation area, identified by functional MRI, in each M1. Metabolite concentrations and analyses of metabolite correlations within M1 were determined. Relationships between metabolite concentrations and arm motor impairment were also evaluated.
Results
The stroke survivors showed lower N-acetylaspartate and higher myo-inositol across ipsilesional and contral-esional M1 compared with control subjects. Significant correlations between N-acetylaspartate and glutamate/glutamine were found in either M1. Ipsilesional N-acetylaspartate and glutamate/glutamine were positively correlated with arm motor impairment and contralesional N-acetylaspartate with time after stroke.
Conclusions
Our preliminary data demonstrated significant alterations of neuronal-glial interactions in spared M1 with the ipsilesional alterations related to stroke severity and contralesional alterations to stroke duration. Thus, MR spectroscopy might be a sensitive method to quantify relevant metabolite changes after stroke and consequently increase our knowledge of the factors leading from these changes in spared motor cortex to motor impairment after stroke.
Keywords: 1H-MRS, motor impairment, plasticity, primary motor cortex, stroke, plasticity
After stroke, the spontaneous return of motor function is associated with the return of activity in the primary motor cortex (M1). Specifically, in subcortical stroke, arm function relies predominantly on the activity of M1 in the injured hemisphere (ipsilesional).1 The role of contralesional M1 in poststroke recovery is, however, less clear. Although the contralesional M1 can be recruited to compensate for damaged crossed pathways,2 some electrophysiological studies3,4 suggest that its inhibition improves motor function of the paretic arm, likely due to decreased abnormal interhemispheric inhibition from the contralesional M1 on the ipsilesional M1 during paretic arm movements.5 Although contral esional M1 recruitment might reflect recruitment of uncrossed pathways,6 there is no evidence that contralesional activation represents firing of uncrossed corticospinal tract fibers, which would be expected to involve proximal rather than distal movements.7 Contralesional M1 recruitment might also represent an epiphenomenon reflecting either diffuse recruitment of the motor networks driven by higher-order areas during paretic arm movement or dendritic overgrowth due to overuse of the healthy arm unmasked by the lack of transcallosal inhibition from ipsilesional M1.8
Therefore, understanding the neural events that parallel functional M1 changes should increase our knowledge of patient's impairment. Proton MR spectroscopy (1H-MRS) provides insights into metabolic events involved in poststroke recovery.9 Specifically, low ipsilesional N-acetylaspartate (NAA), a marker of neuronal integrity, is related to cortical dysfunction,10 poor behavioral outcome,11 and possibly diaschisis.12 Other 1H-MRS-visible metabolites might be informative. For example, myo-inositol (mI) provides insights into the role of glia in plastic brain changes13–15 or into nonsynaptic mechanisms underlying plasticity.16 Finally, glutamate/glutamine (Glx), reflecting the neuronal–glial neurotransmission system, might provide further insights into synaptic mechanisms underlying plasticity.16
We hypothesized that in patients with chronic (>6 months after onset) subcortical ischemic stroke, NAA, mI, and Glx in spared ipsilesional and contralesional gray matter of the hand representation area of M1, identified by functional MRI, would be altered compared with healthy control subjects. We also hypothesized that the metabolite concentrations would be related to arm/hand motor abilities.
Materials and Methods
Participants
Fourteen stroke survivors and 14 age- and sex-matched healthy control subjects signed informed consent in accordance with the University of Kansas Medical Center Human Subjects Committee (Institutional Review Board). Stroke survivors were included if they: (1) had a single ischemic stroke at least 6 months before participation; (2) had radiologically normal appearing M1 on T2-weighted MRI; and (3) were able to perform a handgrip task (Fugl-Meyer Upper Extremity Scale17 [FMUE] ≥10). Exclusion criteria are described in the Supplement (available at http://stroke.ahajournals.org). All patients were on antihypertensive therapy, and some were on cholesterol-lowering (n=7) and/or antiplatelet (n=7) therapy. No patients were receiving inpatient or outpatient rehabilitation therapy. Healthy control subjects, without neurological and psychiatric disorders, MRI contraindications and with normal T2-weighted images, were recruited.
Experimental Protocol
Arm motor impairment was assessed with the FMUE Scale. Because we used a handgrip task to elicit brain activation, we distinguished voluntary from involuntary (spastic finger flexion) contribution18 by subtracting the baseline from the maximal voluntary handgrip pressure using a Jamar dynamometer (Asimow Engineering Co, Los Angeles, CA).
Neuroimaging assessments were performed at 3 T (Siemens Medical Solutions, Erlangen, Germany). Whole-brain 3-dimensional T1-weighted MRI was acquired to estimate brain tissue volume in spectroscopic voxels (Magnetization Prepared Rapid Acquisition Gradient Echo; TR=2300 ms; TE=3 ms; field of view=240 mm; matrix=256×256; resolution=1×1×1 mm3). An axial proton density/T2-weighted MRI parallel to the anterior commissure–posterior commissure line (TR=4800 ms; TE1/TE2= 18/106 ms; field of view=240 mm; matrix size=256×256; slice thickness = 5 mm, no gap) was acquired to confirm the presence of a single ischemic lesion that did not involve M1 and to exclude other pathological conditions in stroke and undiagnosed pathology in control subjects.
Gradient echo blood oxygen level-dependent scans were acquired in 25 axial slices coincident with the PD/T2 series (TR=2000 ms; TE=50 ms; field of view=240 mm; matrix=64×64; slice thickness = 5 mm; 0 skip; in-plane resolution=5×5 mm2; 100 time points). One scan was performed for each hand and consisted of 2 conditions: movement (20 seconds) and rest (20 seconds) repeated 5 times (3 minutes 28 seconds). In the movement condition, participants performed a single brief handgrip task repeated every 4 seconds (further methodological details in the Supplement). We selected this task to broaden patient recruitment, because handgrip returns earlier than finger movements.19
Immediately after the acquisition was completed, the blood oxygen level-dependent data were analyzed using the scanner analysis software (online). Then, by visual inspection of all slices, we determined the slice corresponding to maximal M1 activation. This slice was used to select the corresponding coincident PD/T2 image on which the 1H-MRS image slab was centered. Scalp lipid artifact was minimized with outer voxel suppression bands (thickness=30 mm) prescribed around and above the 1H-MRS image slab.
A 1H-MRS image was acquired using a point-resolved spectroscopy sequence (TE=30 ms; TR=1500 ms; matrix size=16×16; field of view=160 mm2; slice thickness=15 mm; in-plane resolution=5×5 mm2; spectral width= 1200 Hz). Automated, followed by manual, shimming was performed to achieve full-width at half maximum of <20 Hz of the water signal from the entire excitation volume.
To identify spectroscopic voxels corresponding to hand representation in M1, blood oxygen level-dependent data were analyzed using Brain Voyager (Brain Innovation BV, Maastricht, The Netherlands) and the general linear model was used to extract foci of activation in M1 (cluster threshold=100 contiguous voxels; P [Bonferroni]=0.01) and create a hand representation mask (further analysis details are presented in the Supplement). T1-weighted images were segmented using SPM2 (Welcome Department of Cognitive Neurology, London, UK) into white matter, gray matter (GM), and cerebrospinal fluid. 1H-MRS image data were analyzed using LCModel (linear combination of model spectra using a basis set included in the package)20 using a radiofrequency coil loading factor. Using custom-designed software (Matlab Version 7.1, 2005), the hand representation mask images were superimposed on segmented T1-weighted images, 1H-MRS image, and LCModel output. Thus, 3 voxels that corresponded to M1 hand representation (Figure 1A, black squares) were selected to compute the mean concentrations for NAA, mI, and Glx with the following criteria: GM >75%, a signal-to-noise ratio >10, and Cramer-Rao lower bounds <20%. Metabolite concentrations were corrected for voxel parenchyma proportion as follows: c=cLCModel*[1/Fbrain], where c is corrected concentration, cLCModel the institutional unit from LCModel, and Fbrain the fraction brain tissue. Finally, metabolite concentrations were expressed in millimoles per kilogram wet weight by converting the institutional unit into molar concentrations (mM) with a calibration factor obtained by matching the mean NAA concentration in our control subjects to the mean concentration of GM NAA reported in healthy brain.21–23
Figure 1.
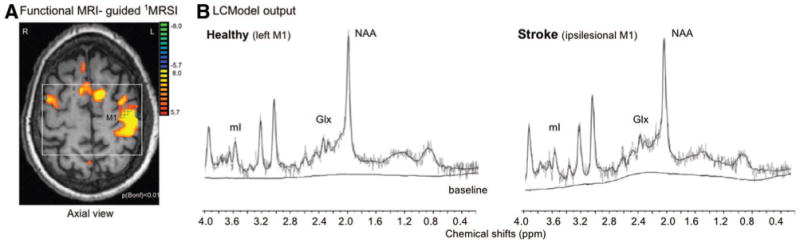
A, 1H-MRS image slab (white box) and spectroscopic voxels (black squares) were positioned according to maximal M1 activation. L indicates left; R, right. B, Left panel, LCModel output from 1 spectroscopic voxel located in left M1 in the healthy control subject (60-year-old man) shown in A. (NAA=14.5 mmol/L, mI=5.2 mmol/L, Glx=14.8 mmol/L). Right, LCModel output from a similar spectroscopic voxel location in the ipsilesional M1 of a stroke survivor (Subject 11, Table 1; 11.5 mmol/L, 7.4 mmol/L, 8.4 mmol/L). ppm indicates parts per million.
Statistical Analysis
The analysis focused on 3 variables (NAA, mI, and Glx) in each M1 (ipsilesional and contralesional) and 2 outcomes (FMUE, handgrip strength). Means and SDs were computed for each variable. In addition, for each variable, between-group differences in mean concentrations were expressed as percentage change (SEs) of the healthy group by using bootstrapping. Stroke and healthy were compared for each variable individually and after adjusting for hemisphere and group-by-hemisphere interaction effects using 1-and 2-way analysis of variance, respectively. These models were controlled for GM fraction within region of interest in both groups and stroke duration in the stroke group. Spearman rank order correlation was used to quantify the relationships between metabolites within M1. Multiple regression was used to analyze the relationships between outcomes and metabolite variables. Bootstrapping was completed using R (Version 2.9.2). Other analysis was performed on SPSS 16.0 (Chicago, IL).
Results
Participants
Stroke and healthy participants did not significantly differ with respect to age (mean [SD]=58.5 [9.4] years versus 52.1 [14.5] years, P=0.18), years of education (13.4 [2.3] versus 14.6 [3.9], P=0.30), or male/female distribution (10/4 in each group).
Stroke survivors had sustained a single cerebral infarction (41.7 [29.2] months previously leading to arm motor impairment (FMUE=41.6 [16.3]; handgrip strength = 60.9% [35.8%]). No M1 damage was detectable on T2-weighted image in any participant (Table 1). We reference region of interest location to the lesion, that is, ipsilesional refers to the injured hemisphere. Because the majority (n=11) of stroke survivors had left-sided infarcts, we compared ipsilesional metabolites with left hemisphere metabolites from control subjects.
Table 1. Demographic and Clinical Characteristics of Stroke Survivors.
| Age, Yrs/Sex | Stroke Duration, Months | Site of Stroke | FMUE (66) | Handgrip Strength (>89%) |
|---|---|---|---|---|
| 68/M | 63 | L/basal ganglia, internal capsule | 65 | 84.7 |
| 46/M | 52 | L/basal ganglia, internal capsule | 63 | 96.4 |
| 48/F | 11 | L/MCA territory, striatocapsular distribution | 61 | 93.6 |
| 71/M | 98 | L/corona radiata, basal ganglia | 54 | 96.0 |
| 57/M | 24 | R/basal ganglia, internal capsule | 50 | 87.2 |
| 61/F | 27 | L/MCA territory, striatocapsular distribution | 50 | 86.4 |
| 65/M | 36 | R/MCA territory, striatocapsular distribution | 42 | 88.1 |
| 71/M | 26 | L/MCA territory, striatocapsular distribution | 37 | 84.4 |
| 45/M | 27 | R/basal ganglia, internal capsule | 36 | 41.9 |
| 63/F | 48 | L/pons | 34 | 34.8 |
| 61/M | 15 | L/pons | 30 | 30.8 |
| 44/F | 106 | L/MCA territory, striatocapsular distribution | 26 | 12.5 |
| 58/M | 27 | L/basal ganglia, internal capsule | 24 | 8.6 |
| 61/M | 24 | L/MCA territory, striatocapsular distribution | 10 | 7.2 |
M indicates male; F, female; L, left; MCA, middle cerebral artery; R, right.
Imaging Findings
The percentages of brain tissue and GM within M1 were similar between stroke and control subjects (ipsilesional brain tissue: 90.5% [5.7%] versus left 90.4% [6.2%], P=0.97; GM: 75.1% [6.1%] versus 75.6% [9.3%], P=0.95; contralesional 82.9% [11.8%] versus right 87.2% [6.7%], P=0.3; 75.1% [3.6%] versus 75.4% [3.9%], P=0.8). Although larger M1 activations were found in stroke compared with control subjects (ipsilesional 27.6% [9.9%] versus left 8.2% [4.9%], P<0.001; contralesional 14.8% [10.1%] versus right 0.8% [1.2%], P=0.002), the anatomic locations of spectroscopic voxels were similar in both groups.
1H-MRS Findings
In our control subjects, similar concentrations of NAA, mI, and Glx were found in both left and right M1 (Table 2). Consistent with previous studies,21,22,24 left NAA and mI concentrations were correlated with region of interest GM fraction (r=0.58, P=0.03; 0.58, P=0.03, respectively).
Table 2. Between-Group Comparisons of Metabolite Concentrations.
| NAA | mI | Glx | |
|---|---|---|---|
| Left+ right vs ipsilesional+contralesional | |||
| Healthy | 11.7 (1.8) | 5.4 (1.0) | 12.3 (2.6) |
| Stroke | 10.2 (1.6) | 6.1 (0.9) | 11.6 (3.4) |
| F1,56 | 9.97 | 7.2 | 0.7 |
| P | 0.003 | 0.01 | 0.39 |
| Left vs ipsilesional | |||
| Healthy | 11.3 (1.9) | 5.4 (1.2) | 12.5 (2.6) |
| Stroke | 9.7 (1.6) | 6.1 (0.9) | 10.8 (2.9) |
| F1,28 | 5.8 | 3.3 | 2.4 |
| P | 0.023 | 0.079 | 0.134 |
| Right vs contralesional | |||
| Healthy | 12.0 (1.8) | 5.4 (0.9) | 12.2 (2.7) |
| Stroke | 10.7 (1.6) | 6.0 (0.9) | 12.5 (3.8) |
| F1,28 | 4.2 | 3.9 | 0.04 |
| P | 0.051 | 0.059 | 0.842 |
Metabolite concentrations are shown as Mean (SD), concentration expressed as mmol/L.
Significant metabolite differences between stroke and control subjects were found for NAA and mI (Table 2). Follow-up analysis found generally lower NAA (ipsilesional: − 14.2% [5.2%], P=0.02; contralesional: −10.9% [4.9%], P=0.05) and higher mI (ipsilesional: +13.2% [7.6%], P=0.08; contralesional: +12.6% [6.6%], P=0.06) in stroke (Figure 2A). In stroke survivors, NAA was lower in ipsilesional than contralesional M1 (9.7 mM [1.6 mM] versus 10.7 mM [1.6 mM], P=0.03). No significant correlations were found between ipsi- or contralesional metabolites and region of interest GM fraction. Contralesional NAA was positively correlated with time after stroke (r=0.61, P=0.02).
Figure 2.
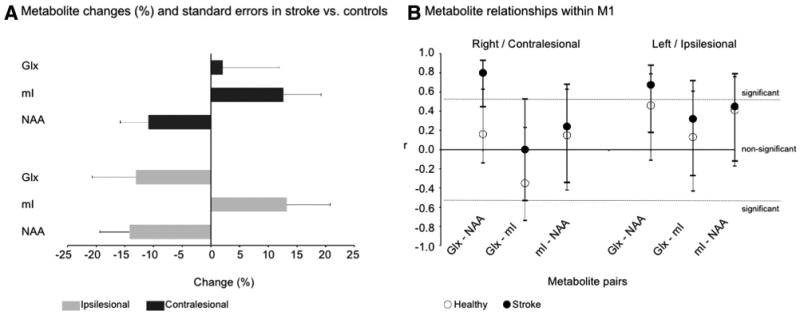
A, Metabolite changes (%) and SE (bootstrapping) in stroke vs controls in ipsilesional (gray bars) and contralesional (black) M1. B, Correlation coefficients (r) and 95% CI between NAA, mI, and Glx within M1 in control subjects (white dots) and patients with stroke (black). Lines indicate the statistically significant r (P<0.05).
Stronger and significant correlations between NAA and Glx were detected in each M1 in stroke (ipsilesional, r=0.67, P=0.009; contralesional, r=0.80, P=0.002) than in control subjects (r=0.46, P=0.10; r=0.16, P=0.69; Figure 2B).
FMUE scores were correlated (R2=0.60) to ipsilesional NAA (β=12.4, P=0.01) and Glx (β= −6.9, P=0.04). No significant correlations were found between ipsi- or contralesional metabolites and handgrip strength.
Discussion
We introduced a novel approach to studying poststroke reorganization by measuring metabolites specific to neurons, glia, or the neuronal–glial neurotransmission system. Overall, we found altered metabolite concentrations and high metabolite correlations within M1 in chronic stroke. Metabolite concentrations were correlated with stroke severity and duration.
Because metabolite changes occurred in spared M1, di-aschisis is possibly involved.12,25 Diaschisis, that is, neural dysfunction due to structural or functional disconnectivity of intact brain regions remote from, but connected, to the insult location, might impair motor recovery by preventing postin-jury neural reorganization.26 Alternatively, diaschisis is considered a part of neural reorganization, for example, development of new cortical connections.27 Although diaschisis has been reported several weeks to months after stroke,12 our data suggest that metabolite alterations might persist considerably longer, that is, up to 9 years after injury.
Mechanisms such as neuronal death and/or altered neuronal metabolic activity16 might induce low ipsilesional NAA. Retrograde degeneration could be a potential candidate for neuronal death. Although limited retrograde degeneration has been detected after subcortical infarction,28 data on incidence, development period, or distance of this process are lacking in humans. Findings in animal models support the presence of this phenomenon but suggest that it is limited to just a few millimeters above the lesion.29 Thus, neuronal death due to retrograde degeneration seems an unlikely cause. Alternatively, low NAA might indicate altered neuronal metabolism. In addition, the positive relationships between ipsilesional NAA and clinical severity and between contralesional NAA and stroke duration provide support for NAA as a marker of poststroke reorganization in both injured and uninjured hemispheres.
Myo-inositol was significantly increased across ipsilesional and contralesional M1 compared with control subjects, possibly indicating glial involvement. Owing to their plasticity and sensitivity to neuronal activity, we have hypothesized that glia could play a significant role in poststroke plasticity. Indeed, astrocytes release trophic factors promoting neuronal survival and synaptogenesis, neurogenesis, and angiogenesis after stroke15 and participate in long-term synaptic plasticity.13,14 Alternatively, high mI might indicate gliosis.30 However, as noted previously, neuronal death that might trigger gliosis seems unlikely in spared M1. Moreover, there were no significant changes in the correlations between NAA and mI in either M1 (Figure 2B). Thus, high mI is not due solely to a gliotic process. Another explanation for increased mI would lie in its osmolyte proprieties.31 Because glutamate and glutamine, other major brain osmolytes, tend to be lower in these areas, it is therefore unlikely that increased mI was driven by hyperosmolarity, which would also increase glutamate and glutamine.32 Finally, mI is also involved in various cellular functions, that is, cellular membrane-based secondary messenger system, as stated earlier. Although the exact mechanisms underlying mI increase remain unsettled, our data suggest that glial cells could be actively involved in poststroke reorganization.
Glutamate, involved in neurotransmission (80% to 100% of glutamate is rapidly cycled to glutamine) and other metabolic processes,16 is a major component of Glx. Although our data did not show significant Glx changes, the correlation between ipsilesional Glx and motor impairment as well as the presence of stronger and significant correlations between NAA and Glx in both M1s suggests a potential role of Glx in poststroke plasticity. However, we cannot confirm whether the Glx involvement represents a consequence or the source of motor disability.
There were some potential pitfalls with the current approach. The use of antiplatelet therapy (ie, clopidogrel) could increase the resting cerebral blood flow, which would decrease the blood oxygen level-dependent response.33 We found, however, larger blood oxygen level-dependent responses in our stroke participants.
Although the effects of the cerebral blood flow alterations on the cerebral metabolites are inconclusive,34,35 we cannot rule out that low NAA could be the result of carotid stenosis. Our unpublished data have shown no significant NAA decrease in the dorsal premotor cortex. Thus, misery perfusion is an unlikely explanation because a global effect would be expected.
Because our stroke sample included mostly left hemispheric strokes, we did not address the potential differences between brain reorganization of left- versus right-sided, limiting the generalizability of results.
Although no power analysis was performed in this exploratory study, our data provide important information for formulating hypotheses in future confirmatory studies.
Conclusions
The current study adds new perspectives to address post-stroke plasticity and provides further evidence that 1H-MRS might broaden our understanding of cellular processes underlying plasticity in vivo.
Supplementary Material
Acknowledgments
Sources of Funding: This work was supported by Natural Sciences and Engineering Research Council of Canada (CMC) and American Heart Association (0860041Z C.M.C.; 0655759Z W.M.B.). The Hoglund Brain Imaging Center is supported by a generous gift from Forrest and Sally Hoglund and the United States National Institutes of Health (P30 HD 002528).
Footnotes
The online-only Data Supplement is available at http://stroke.ahajournals.org/cgi/content/full/STROKEAHA.110.601047/DC1.
Disclosures: None.
References
- 1.Ward NS, Brown MM, Thompson AJ, Frackowiak RS. Neural correlates of outcome after stroke: a cross-sectional fMRI study. Brain. 2003;126:1430–1448. doi: 10.1093/brain/awg145. [DOI] [PMC free article] [PubMed] [Google Scholar]
- 2.Ago T, Kitazono T, Ooboshi H, Takada J, Yoshiura T, Mihara F, Ibayashi S, Iida M. Deterioration of pre-existing hemiparesis brought about by subsequent ipsilateral lacunar infarction. J Neurol Neurosurg Psychiatry. 2003;74:1152–1153. doi: 10.1136/jnnp.74.8.1152. [DOI] [PMC free article] [PubMed] [Google Scholar]
- 3.Takeuchi N, Tada T, Toshima M, Chuma T, Matsuo Y, Ikoma K. Inhibition of the unaffected motor cortex by 1 Hz repetitive transcranical magnetic stimulation enhances motor performance and training effect of the paretic hand in patients with chronic stroke. J Rehabil Med. 2008;40:298–303. doi: 10.2340/16501977-0181. [DOI] [PubMed] [Google Scholar]
- 4.Nowak DA, Grefkes C, Dafotakis M, Eickhoff S, Kust J, Karbe H, Fink GR. Effects of low-frequency repetitive transcranial magnetic stimulation of the contralesional primary motor cortex on movement kinematics and neural activity in subcortical stroke. Arch Neurol. 2008;65:741–747. doi: 10.1001/archneur.65.6.741. [DOI] [PubMed] [Google Scholar]
- 5.Murase N, Duque J, Mazzocchio R, Cohen LG. Influence of interhemi-spheric interactions on motor function in chronic stroke. Ann Neurol. 2004;55:400–409. doi: 10.1002/ana.10848. [DOI] [PubMed] [Google Scholar]
- 6.Gerloff C, Bushara K, Sailer A, Wassermann EM, Chen R, Matsuoka T, Waldvogel D, Wittenberg GF, Ishii K, Cohen LG, Hallett M. Multimodal imaging of brain reorganization in motor areas of the contralesional hemisphere of well recovered patients after capsular stroke. Brain. 2006;129:791–808. doi: 10.1093/brain/awh713. [DOI] [PubMed] [Google Scholar]
- 7.Foltys H, Krings T, Meister IG, Sparing R, Boroojerdi B, Thron A, Topper R. Motor representation in patients rapidly recovering after stroke: a functional magnetic resonance imaging and transcranial magnetic stimulation study. Clin Neurophysiol. 2003;114:2404–2415. doi: 10.1016/s1388-2457(03)00263-3. [DOI] [PubMed] [Google Scholar]
- 8.Calautti C, Baron JC. Functional neuroimaging studies of motor recovery after stroke in adults: a review. Stroke. 2003;34:1553–1566. doi: 10.1161/01.STR.0000071761.36075.A6. [DOI] [PubMed] [Google Scholar]
- 9.Saunders DE. MR spectroscopy in stroke. Br Med Bull. 2000;56:334–345. doi: 10.1258/0007142001903256. [DOI] [PubMed] [Google Scholar]
- 10.Kang DW, Roh JK, Lee YS, Song IC, Yoon BW, Chang KH. Neuronal metabolic changes in the cortical region after subcortical infarction: a proton MR spectroscopy study. J Neurol Neurosurg Psychiatry. 2000;69:222–227. doi: 10.1136/jnnp.69.2.222. [DOI] [PMC free article] [PubMed] [Google Scholar]
- 11.Kobayashi M, Takayama H, Suga S, Mihara B. Longitudinal changes of metabolites in frontal lobes after hemorrhagic stroke of basal ganglia: a proton magnetic resonance spectroscopy study. Stroke. 2001;32:2237–2245. doi: 10.1161/hs1001.096621. [DOI] [PubMed] [Google Scholar]
- 12.Chu WJ, Mason GF, Pan JW, Hetherington HP, Liu HG, San Pedro EC, Mountz JM. Regional cerebral blood flow and magnetic resonance spec-troscopic imaging findings in diaschisis from stroke. Stroke. 2002;33:1243–1248. doi: 10.1161/01.str.0000015240.75199.be. [DOI] [PubMed] [Google Scholar]
- 13.Henneberger C, Papouin T, Oliet SH, Rusakov DA. Long-term poten-tiation depends on release of D-serine from astrocytes. Nature. 2010;463:232–236. doi: 10.1038/nature08673. [DOI] [PMC free article] [PubMed] [Google Scholar]
- 14.Rango M, Cogiamanian F, Marceglia S, Barberis B, Arighi A, Biondetti P, Priori A. Myoinositol content in the human brain is modified by transcranial direct current stimulation in a matter of minutes: a 1H-MRS study. Magn Reson Med. 2008;60:782–789. doi: 10.1002/mrm.21709. [DOI] [PubMed] [Google Scholar]
- 15.Shibuya M. Brain angiogenesis in developmental and pathological processes: therapeutic aspects of vascular endothelial growth factor. FEBS J. 2009;276:4636–4643. doi: 10.1111/j.1742-4658.2009.07175.x. [DOI] [PubMed] [Google Scholar]
- 16.Siegel GJB, Agranoff BW, Albers GW, Fisher SK, Uhler MD. Basic Neurochemistry: Molecular, Cellular and Medical Aspects. Oxford, UK: Academic Press; 2005. [Google Scholar]
- 17.Fugl-Meyer AR, Jaasko L, Leyman I, Olsson S, Steglind S. The post-stroke hemiplegic patient. 1. A method for evaluation of physical performance. Scand J Rehabil Med. 1975;7:13–31. [PubMed] [Google Scholar]
- 18.Carr J, Shepherd R. Movement Science: Foundations for Physical Therapy Rehabilitation. Rockville, MD: Aspen; 1987. [Google Scholar]
- 19.Heller A, Wade DT, Wood VA, Sunderland A, Hewer RL, Ward E. Arm function after stroke: measurement and recovery over the first three months. J Neurol Neurosurg Psychiatry. 1987;50:714–719. doi: 10.1136/jnnp.50.6.714. [DOI] [PMC free article] [PubMed] [Google Scholar]
- 20.Provencher SW. Automatic quantitation of localized in vivo 1H spectra with LCmodel. NMR Biomed. 2001;14:260–264. doi: 10.1002/nbm.698. [DOI] [PubMed] [Google Scholar]
- 21.Inglese M, Rusinek H, George IC, Babb JS, Grossman RI, Gonen O. Global average gray and white matter N-acetylaspartate concentration in the human brain. Neuroimage. 2008;41:270–276. doi: 10.1016/j.neuroimage.2008.02.034. [DOI] [PMC free article] [PubMed] [Google Scholar]
- 22.Wang Y, Li SJ. Differentiation of metabolic concentrations between gray matter and white matter of human brain by in vivo 1H magnetic resonance spectroscopy. Magn Reson Med. 1998;39:28–33. doi: 10.1002/mrm.1910390107. [DOI] [PubMed] [Google Scholar]
- 23.Hetherington HP, Pan JW, Mason GF, Adams D, Vaughn MJ, Twieg DB, Pohost GM. Quantitative 1H spectroscopic imaging of human brain at 4.1 T using image segmentation. Magn Reson Med. 1996;36:21–29. doi: 10.1002/mrm.1910360106. [DOI] [PubMed] [Google Scholar]
- 24.Ratiney H, Noworolski SM, Sdika M, Srinivasan R, Henry RG, Nelson SJ, Pelletier D. Estimation of metabolite T1 relaxation times using tissue specific analysis, signal averaging and bootstrapping from magnetic resonance spectroscopic imaging data. MAGMA. 2007;20:143–155. doi: 10.1007/s10334-007-0076-0. [DOI] [PMC free article] [PubMed] [Google Scholar]
- 25.Seitz RJ, Azari NP, Knorr U, Binkofski F, Herzog H, Freund HJ. The role of diaschisis in stroke recovery. Stroke. 1999;30:1844–1850. doi: 10.1161/01.str.30.9.1844. [DOI] [PubMed] [Google Scholar]
- 26.Carmichael ST, Tatsukawa K, Katsman D, Tsuyuguchi N, Kornblum HI. Evolution of diaschisis in a focal stroke model. Stroke. 2004;35:758–763. doi: 10.1161/01.STR.0000117235.11156.55. [DOI] [PubMed] [Google Scholar]
- 27.Dancause N, Barbay S, Frost SB, Mahnken JD, Nudo RJ. Interhemi-spheric connections of the ventral premotor cortex in a new world primate. J Comp Neurol. 2007;505:701–715. doi: 10.1002/cne.21531. [DOI] [PMC free article] [PubMed] [Google Scholar]
- 28.Liang Z, Zeng J, Zhang C, Liu S, Ling X, Xu A, Ling L, Wang F, Pei Z. Longitudinal investigations on the anterograde and retrograde degeneration in the pyramidal tract following pontine infarction with diffusion tensor imaging. Cerebrovasc Dis. 2008;25:209–216. doi: 10.1159/000113858. [DOI] [PubMed] [Google Scholar]
- 29.Wannier T, Schmidlin E, Bloch J, Rouiller EM. A unilateral section of the corticospinal tract at cervical level in primate does not lead to measurable cell loss in motor cortex. J Neurotrauma. 2005;22:703–717. doi: 10.1089/neu.2005.22.703. [DOI] [PubMed] [Google Scholar]
- 30.Glanville NT, Byers DM, Cook HW, Spence MW, Palmer FB. Differences in the metabolism of inositol and phosphoinositides by cultured cells of neuronal and glial origin. Biochim Biophys Acta. 1989;1004:169–179. doi: 10.1016/0005-2760(89)90265-8. [DOI] [PubMed] [Google Scholar]
- 31.Lohr JW, McReynolds J, Grimaldi T, Acara M. Effect of acute and chronic hypernatremia on myoinositol and sorbitol concentration in rat brain and kidney. Life Sci. 1988;43:271–276. doi: 10.1016/0024-3205(88)90317-7. [DOI] [PubMed] [Google Scholar]
- 32.Heilig CW, Stromski ME, Blumenfeld JD, Lee JP, Gullans SR. Characterization of the major brain osmolytes that accumulate in salt-loaded rats. Am J Physiol. 1989;257:F1108–1116. doi: 10.1152/ajprenal.1989.257.6.F1108. [DOI] [PubMed] [Google Scholar]
- 33.Stefanovic B, Warnking JM, Rylander KM, Pike GB. The effect of global cerebral vasodilation on focal activation hemodynamics. Neuroimage. 2006;30:726–734. doi: 10.1016/j.neuroimage.2005.10.038. [DOI] [PubMed] [Google Scholar]
- 34.van der Grond J, Balm R, Kappelle LJ, Eikelboom BC, Mali WP. Cerebral metabolism of patients with stenosis or occlusion of the internal carotid artery. A 1H-MR spectroscopic imaging study. Stroke. 1995;26:822–828. doi: 10.1161/01.str.26.5.822. [DOI] [PubMed] [Google Scholar]
- 35.Hattingen E, Magerkurth J, Pilatus U, Mozer A, Seifried C, Steinmetz H, Zanella F, Hilker R. Phosphorus and proton magnetic resonance spec-troscopy demonstrates mitochondrial dysfunction in early and advanced Parkinson's disease. Brain. 2009;132:3285–3297. doi: 10.1093/brain/awp293. [DOI] [PubMed] [Google Scholar]
Associated Data
This section collects any data citations, data availability statements, or supplementary materials included in this article.