

Abstract
This study describes the pattern of interhemispheric connections of the ventral premotor cortex (PMv) distal forelimb representation (DFL) in squirrel monkeys. Our objectives were to describe qualitatively and quantitatively the connections of PMv with contralateral cortical areas. Intracortical microstimulation techniques (ICMS) guided the injection of the neuronal tract tracers biotinylated dextran amine or Fast blue into PMv DFL. We classified the interhemispheric connections of PMv into three groups. Major connections were found in the contralateral PMv and supplementary motor area (SMA). Intermediate interhemispheric connections were found in the rostral portion of the primary motor cortex, the frontal area immediately rostral and ventral to PMv (FR), cingulate motor areas (CMAs), and dorsal premotor cortex (PMd). Minor connections were found inconsistently across cases in the anterior operculum (AO), posterior operculum/inferior parietal cortex (PO/IP), and posterior parietal cortex (PP), areas that consistently show connections with PMv in the ipsilateral hemisphere. Within-case comparisons revealed that the percentage of PMv connections with contralateral SMA and PMd are higher than the percentage of PMv connections with these areas in the ipsilateral hemisphere; percentages of PMv connections with contralateral M1 rostral, FR, AO, and the primary somatosensory cortex are lower than percentages of PMv connections with these areas in the ipsilateral hemisphere. These studies increase our knowledge of the pattern of interhemispheric connection of PMv. They help to provide an anatomical foundation for understanding PMv’s role in motor control of the hand and interhemispheric interactions that may underlie the coordination of bimanual movements.
Indexing terms: connections, contralateral, interhemispheric, monkey, neuroanatomy, premotor cortex
The ventral premotor cortex (PMv) of primates is a motor area of the frontal cortex that is involved in the control of forelimb and orofacial movements (Rizzolatti et al., 2002; Dancause et al., 2006a; Wise, 2006). Neurophysiological and ablation/inactivation-behavior studies suggest that PMv is involved the initiation and control of forelimb movements based on visual cues and other sensory information (Godschalk et al., 1981; Rizzolatti et al., 1983, 1988; Kurata and Tanji, 1986; Gentilucci et al., 1988, 1989; Mushiake et al., 1991; Kurata and Hoshi, 1999). Furthermore, electrophysiological studies suggest that PMv plays an essential role as a sensory-motor interface for the precise control of the hand (Murata et al., 1997; Raos et al., 2006). The connections of PMv with ipsilateral somatosensory, visual, polysensory, and visuo-motor areas of the parietal cortex and its extensive connections with primary motor and other premotor cortical areas of the frontal cortex place PMv at a strategic location to assume this function (Matelli et al., 1986; Kurata, 1991; Ghosh and Gattera, 1995; Tanné-Gariépy et al., 2002; Dum and Strick, 2005; Dancause et al., 2006a,b).
Whereas the ipsilateral anatomical network of PMv and its role in the control of the contralateral forearm has been the focus of extensive investigation, information concerning its interhemispheric connectivity is much sparser. The relatively few studies that have been done have concluded that premotor areas have extensive connectivity with the contralateral hemisphere in comparison to M1, which has much less extensive contralateral connections (Rouiller et al., 1994). These results suggest that premotor areas may be more instrumental to interhemispheric interaction and bimanual motor control than M1.
Interhemispheric connections have been documented for the supplementary motor area (SMA) (McGuire et al., 1991; Rouiller et al., 1994) and dorsal premotor cortex (PMd) (Marconi et al., 2003). To date, only one study (in macaque monkeys) has documented interhemispheric connections of PMv (Boussaoud et al., 2005). Limited quantitative analysis of interhemispheric connections is currently available. Only two studies (Rouiller et al., 1994; Boussaoud et al., 2005) quantified interhemispheric connectivity of premotor areas. In addition, the documentation of both the pattern of ipsi- and contralateral connections within the same animals, allowing direct quantitative comparison, has not been reported. Finally, previous studies have been based exclusively on the distribution of retrogradely labeled cell bodies in the contralateral hemisphere. No studies of terminal distribution have been conducted. This information could be of great interest in evaluating reciprocal connectivity between PMv and contralateral cortical areas.
In order to address these issues we examined the interhemispheric connections of PMv in the squirrel monkey. In this experimental model we take advantage of this species’ lissencephalic cortex to perform tangential sectioning, which allows precise coregistration of the physiological and anatomical data. Our objectives were to document the interhemispheric connections, particularly the termination patterns, of the PMv distal forelimb representation (DFL) through 1) the physiological documentation of the injection site, 2) physiological documentation of the forelimb areas in the contralateral hemisphere, and 3) quantification of the connections in the contralateral hemisphere and comparison to the ipsilateral connections within the same animals.
MATERIALS AND METHODS
Surgical procedures
Five adult squirrel monkeys (Saimiri spp.) were used in the present study (weight range = 645–1,229 g; three males, two females). The pattern of ipsilateral connectivity for four of these cases (1934, 1892, 3024, 9409), as well as the anatomical and physiological methodology, has been described previously (Dancause et al., 2006b). All animal use was in accordance with a protocol approved by the Institutional Animal Care and Use Committee of the University of Kansas Medical Center. In all animals, injections of neuronal tracers were effected on the hemisphere contralateral to the preferred hand on a reach-and-retrieval task (see Nudo et al., 1992, for details).
Surgeries were performed using aseptic techniques and halothane-nitrous oxide anesthesia. Following a craniectomy over the lateral portion of the frontal cortex, exposing the M1 and PMv DFLs, a plastic cylinder was fitted over the opening and filled with warm, sterile silicone oil. A digital photograph of the exposed cortex was taken and subsequently used to create a 2D map of motor representations superimposed on the vascular landmarks.
Derivation of motor maps
After the surgical procedures were completed the halothane was withdrawn and ketamine-valium (diazepam) administered intravenously for the electrophysiological and tracer injection procedures. Intracortical microstimulation (ICMS) techniques were used in all five animals to derive neurophysiological maps of movement representations in M1 and PMv in the hemisphere contralateral to the preferred hand. These physiological data were useful to ensure precise and consistent location of the neuronal tracer injections in relation to topographic representations. In one animal (396), additional motor mapping was done in the contralateral hemisphere to identify M1, PMv, PMd, and SMA DFLs and further document the location of labeling in relation to DFLs in these additional areas. A microelectrode, made from a glass micropipette tapered to a fine tip and filled with 3.5M NaCl, was used for electrical stimulation applied at a depth of ≈1,750 μm (layer V). Stimulation consisted of a 40-ms train of 13 monophasic cathodal pulses of 200 μs delivered at 350 Hz from an electrically isolated, constant current stimulator (Nudo et al., 1992; Nudo and Milliken, 1996). Pulse trains were repeated at 1-Hz intervals; current was limited to 30 μA or less.
Movements were described using conventional terminology (Gould et al., 1986). We defined and included in the DFL all sites at which electrical stimulation elicited movements of the digits, wrist, or forearm. As defined, the DFL comprises a contiguous region typically surrounded by the more proximal elbow and shoulder representations in primary and premotor areas (Frost et al., 2003; Dancause et al., 2006a–c).
Sites at which the stimulation elicited movement of the elbow, shoulder, or no response determined the physiological border of the DFL. In two animals (1934 and 1892), M1 and PMv were mapped at relatively low resolution (≈500 μm interpenetration distances); for two other animals (9409 and 3024), M1 was mapped at higher resolution (≈250 μm interpenetration distances) and PMv at low resolution (500 μm). In one animal (396), M1, PMv, PMd, and SMA were mapped at low resolution bilaterally. The lower resolution was sufficient for defining the borders of the DFL and for locating the sites for injection of neuroanatomical tracing agents. Surface area measurements were subsequently obtained using a graphics program (Canvas 3.5; Deneba Systems, Miami, FL) by drawing polygons circumscribing sites where movement of similar body segments was elicited by ICMS.
Injection of neuronal tracers
Following the physiological mapping procedures the animal was returned to halothane-nitrous oxide anesthesia for the injection of neuronal tracers. In all cases we used injections of biotinylated dextran amine (BDA; 5% in NaCl solution; 10,000 MW conjugated to lysine; Molecular Probes, Eugene, OR), a neuroanatomical tracer that allows detailed analysis of both anterograde and retrograde transport patterns (Veenman et al., 1992). Because this form of BDA is especially well suited for describing terminal labeling (Reiner et al., 2000), the pattern of retrograde labeling was confirmed in one additional case (1892) using an injection of the fluorescent tracer Fast blue (FB; Dr. Illig Gml3H, Grob-Umstadt, Germany). All injections targeted the PMv DFL.
The injection in case 1934 was made via pressure injection with a microsyringe pump controller (UPP2-1, WPI Instruments, Sarasota, FL) and a 1-μL Hamilton syringe (injected volume = 0.2 μL). The injection in cases 1892, 3024, and 396 were made via pressure injection with the microsyringe pump controller through a tapered, graduated micropipette (Fisher Scientific, Pittsburgh, PA; injected volume = 0.2 μL). In case 9409 the injection of BDA was performed using electrophoresis (6 μA positive current 7 s on/7 s off for 10 minutes). In case 1892 the fluorescent tracer Fast blue (2% in H2O) was injected 500 μm caudal and lateral to the BDA injection site in PMv (injected volume = 0.4 μL) using similar methods. In each animal injections were made at multiple depths (≈1,750 μm; 1,000 μm, and 500 μm) in order to label a column of PMv cortex through all layers of the gray matter.
Tissue preparation
Twelve days following tracer injection each animal was euthanized and perfused, the brain removed, and the cerebral cortex separated from the rest of the brain. The parietal and frontal cortex was then flattened between two glass slides (Gould and Kaas, 1981; Dancause et al., 2006b). The cortical block was sectioned tangential to the cortical surface (thickness = 50 μm). Every third section was used for histological processing to examine the presence of BDA, allowing us to document the distribution of terminal boutons of PMv and cell bodies of other cortical areas projecting to PMv at increments of ≈150 μm in depth through the cortical gray matter (approximate, since some compression occurs during flattening; see below). To further facilitate identification of functional boundaries within the parietal cortex, one section out of three was used for a myelin staining protocol (Gallyas, 1979; Krubitzer and Kaas, 1990; Dancause et al., 2006b). In case 1892, other sections (1/3) were used for the documentation of fluorescently labeled cell bodies. These latter sections were immediately mounted from 0.05M phosphate buffer in saline solution (pH 7.4) following sectioning and coverslipped the same day. Further details of BDA histochemistry and myelin staining protocols have been previously published (Dancause et al., 2005, 2006a,b).
Quantitative neuroanatomical analyses
A neuroanatomical reconstruction system, consisting of a computer-interfaced microscope (Carl Zeiss, Thornwood, NY) and associated software (Neurolucida: MicroBright-Field, Colchester, VT), was used to record the locations of labeled terminals and cell bodies. These techniques were identical to those used in an earlier examination of ipsilateral connections (Dancause et al., 2006a,b).
Documentation of terminal and cell body labeling
In each case we reconstructed all the sections that comprised the entire cortex (i.e., we did not analyze incomplete or broken sections). We typically began to obtain complete cortical sections at ≈500 μm depth (section 10) and encountered the gray matter/white matter interface in some cortical areas at ≈1,600 μm (section 32). Note that due to the compression that occurs during tissue flattening, the section number does not represent actual depth within the intact cortex, but section depth. Within this range of section depth, if a section was broken, it was not retained for the reconstruction. Accordingly, a total of seven sections were analyzed for case 1934 (sections 10, 13, 19, 22, 25, 28, and 31); seven sections for case 9409 (10, 16, 19, 22, 25, 28, and 31); five sections for case 3024 (10, 13, 16, 19, and 22); five sections for case 396 (10, 16, 19, 22, and 25); five sections for case 1892 (BDA) (sections 10, 13, 16, 19, and 22); and seven sections for 1892 (FB) (sections 11, 14, 17, 20, 23, 26, and 29). Thus, our sampling likely excluded the most superficial layers, potentially resulting in an underestimation or overestimation of connections. However, for all cases high-resolution photographs of the remaining BDA-processed sections were acquired using a MicroLumina digital scanning camera (Leaf Systems, Bedford, MA) and imported into Photoshop (Adobe Systems, San Jose, CA). These photographs were scanned visually (but not entered into the computerized neuroanatomical system) to assure representative sampling. For all photographs the brightness and contrast was adjusted using Photoshop to maximize visibility of the labeled terminals and cells. The distribution of label was not found to differ in any substantial way from the reconstructed data, at least qualitatively. Whereas the section depth provides some information concerning the depth of the analyzed tissue (section number × 50 μm section thickness), several reasons render the evaluation of precise cortical depth precarious using tangential sectioning. First, often the first few sections are not sectioned ideally, rendering quantitative analysis of these sections suspect. Second, although the tissue is flattened, it is nearly impossible to maintain the same depth throughout the tangential section; exact depth within each region of interest is questionable. Third, the compression of the tissue during the flattening procedures alters the thickness of the layers. Fourth, cytoarchitectonic information typically used to define laminar boundaries in coronal sections is much more limited in tangential sections. For these reasons we purposefully refrain from any attempts to identify laminar location.
A varicosity was considered to be a terminal bouton if it appeared as a small, darkly labeled sphere contacting a small fiber. For BDA, labeled cell bodies that displayed a full rounded soma and at least two darkly stained protuberances (considered to be dendrites or the axon) were marked in Neurolucida. For FB, the neurons simply were required to contain the fluorescent tracer in their somata.
For the documentation of terminal labeling, a grid pattern (100 × 100 μm) was overlaid on the section image and was used to sample the entire section. If at least two terminals were located within a square of the grid at any depth within the section, a marker was placed in the center of the square. The results provide information on the number and density of 100 × 100 × 50 μm voxels with labeled terminals.
The method used to document PMv terminals (number of voxels with ≥2 terminal boutons) was chosen to provide an accurate and detailed report of their distribution in a reasonable amount of time. The voxel resolution of 0.0005 mm3 provided limited information on absolute synapse density, and thus on total synapse numbers (one voxel can have between two to hundreds of synapses). Thus, our quantitative report of the magnitude of PMv projections to different areas does not reflect the density of the projections per se. The resulting numbers of labeled voxels are more directly correlated with the total cortical volume occupied by terminals from PMv. This should be considered in the interpretation of quantitative results. By converting both terminal and cell body estimates to percentages of total values in the entire hemisphere, it is possible to compare quantitatively the relative magnitude of afferent and efferent projections for each of the cortical regions of interest. It is noteworthy that the percentage of terminals was not significantly different from the percentage of cell bodies in any of the cortical regions, strengthening the validity of this approach. An additional validity check was performed by converting labeled voxel counts to voxels per mm2 (for areas that could be accurately circumscribed), effectively controlling for the total surface area of a region of interest. The rank order for the different regions using the two methods was identical, suggesting that the voxel method is a valid measure of the strength of connections.
Total counts for cell bodies were adjusted using Abercrombie’s formula (T/(T+h)), where T = section thickness and h = mean diameter of the objects along the z axis (Abercrombie, 1946; Guillery, 2002). Data to estimate the correction factor were collected in the animal with the most BDA-labeled cell bodies per section (case 1934; see Table 1). Because of the limited number of cells in most areas we were only able to randomly select the measured cells for PMv and SMA. Measurements in other areas were made on all labeled cells. We measured cell diameters in cortical areas where labeling was consistently found in all cases (i.e., PMv, SMA, FR, CMAs, PMd, Rostral M1). Thickness of the mounted tissue was obtained by averaging data from random sampling of the thickness at 25 sites across cortical areas (T = 42.1 μm). Individual correction factors and corrected numbers of cell bodies in each area are listed in Table 2. In areas with inconsistent labeling, accurate measurement of cell body diameters was not possible due to low numbers of profiles. In these areas (i.e., AO, PO/IP, PP, and caudal M1), an average correction factor was derived from the areas with consistent labeling, and used to correct these counts. Note that cell counts for these areas were not used for our statistical analysis (see below).
TABLE 1.
Summary of BDA Injections
| Injection area (mm2) |
Injection size category |
Labeled cell body profiles1 (no. per section) |
Corrected labeled cell bodies1 (no. per section) |
Labeled voxels1 (no. per section) |
Movement representations within the injection core
|
|||||||
|---|---|---|---|---|---|---|---|---|---|---|---|---|
| Undefined (%) |
No response (%) |
Face (%) |
Proximal (%) |
Distal forelimb (%)
|
||||||||
| Wrist/ forearm |
Digits | Total | ||||||||||
| 1934 | 3.3 | Large | 51 | 38.2 | 314.8 | 0 | 1.2 | 0 | 13.5 | 68.5 | 16.8 | 85.3 |
| 1892 (BDA) | 1.92 | Large | 0.2 | 0.2 | 61.5 | 0 | 0 | 0 | 32.1 | 5.7 | 62.2 | 67.9 |
| 1892 (FB) | 3.31 | Large | 343.3 | 257.5 | N/A | 0 | 0 | 7.8 | 51.0 | 12.4 | 28.7 | 41.1 |
| 9409 | 0.9 | Small | 1.9 | 1.4 | 130.6 | 0 | 0 | 0 | 16.2 | 13.7 | 70.1 | 83.8 |
| 3024 | 0.8 | Small | 1.4 | 1.0 | 19.4 | 0 | 11.9 | 0 | 0 | 54.8 | 33.3 | 88.1 |
| 396 | 5.22 | Large | 44.2 | 33.2 | 2303.6 | 6.33 | 20.1 | 12.3 | 1.9 | 15.5 | 43.9 | 12.3 |
Note that numbers of labeled cells (or labeled voxels) per section are reported. Estimates of cell body numbers were corrected for overcounting (Abercrombie, 1946). For an approximation of the total number of labeled cells in the entire hemisphere, the number of cells per section must be multiplied by the total number of sections through the cortical gray matter. It should be kept in mind that these are general estimates since unbiased stereological techniques would be required for appropriate determination of actual numbers. The present data is appropriate, however, for estimates of proportions in each area. Using these methods of approximation, in only three cases the total no. BDA-labeled cell bodies in the contralateral hemisphere was estimated to be higher than one thousand prior to the Abercrombie’s correction factor (case 1934 = 1377; case 1892 FB = 9955; case 396 = 1238). Thus, only these cases were used for analysis of the distribution of cell bodies (cell count approximation with the global correction factor of 0.75: case 1934 = 1033; case 1892 = 7466; case 396 = 928).
These numbers are approximate in this case because the center of FB dense core of the injection was absent. This missing portion was considered to be fully contained in the core of the injection site of both FB and BDA (see Materials and Methods).
Because of the craniectomy border, there was a small proportion of these injection cores that was not physiologically defined. However, this area was most likely included in the distal forelimb area (see Figure 1).
TABLE 2.
Distribution of Terminal and Cell Body Labeling Across Cases
| Cell bodies1 |
Voxels with labeled terminals1 |
|||||||||||||
|---|---|---|---|---|---|---|---|---|---|---|---|---|---|---|
| Correction factor |
1934 (BDA)
|
396 (BDA)
|
1892 (FB)
|
Average % (±std) |
1934 (BDA) |
1892 (BDA) |
9409 (BDA) |
3024 (BDA) |
396 (BDA) |
Average (±std) |
||||
| Corrected no. cell bodies in analyzed sections (n = 7) |
% of contralateral hemisphere |
Corrected no. cell bodies in analyzed sections (n=5) |
% of contralateral hemisphere |
Corrected no. cell bodies in analyzed sections (n = 7) |
% of contralateral hemisphere |
% | % | % | % | % | % | |||
| PMv | 0.76 | 172 | 63.5 | 70 | 42.0 | 696 | 38.4 | 48.0 (13.6) | 44.4 | 51.8 | 42.1 | 58.8 | 34.5 | 46.3 (9.3) |
| M1rostral | 0.74 | 4 | 1.4 | 24 | 14.1 | 103 | 5.7 | 7.1 (6.4) | 6.8 | 6.5 | 17.9 | 6.2 | 15.5 | 10.6 (5.7) |
| M1caudal2 | 0.75 | 0 | 0 | 0 | 0 | 4 | 0.2 | 0.1 (0.1) | 0.3 | 0.5 | 0 | 0 | 0 | 0.2 (0.2) |
| PMd | 0.75 | 2 | 0.8 | 7.5 | 4.5 | 176 | 9.7 | 5.0 (4.5) | 5.5 | 6.0 | 6.9 | 9.3 | 12.2 | 8.0 (2.8) |
| SMA | 0.74 | 48 | 17.6 | 23 | 13.8 | 438 | 24.2 | 18.5 (5.2) | 31.5 | 29.8 | 20.4 | 15.5 | 20.0 | 23.4 (6.9) |
| CMAs | 0.75 | 5 | 2.0 | 3 | 1.8 | 191 | 10.6 | 4.8 (5.0) | 5.1 | 0 | 1.9 | 4.1 | 6.8 | 3.6 (2.7) |
| FR | 0.74 | 40 | 14.6 | 27 | 16.1 | 82 | 4.5 | 11.8 (6.3) | 4.7 | 5.4 | 10.7 | 6.2 | 6.4 | 6.7 (2.4) |
| AO2 | 0.75 | 0 | 0 | 8 | 4.5 | 100 | 5.5 | 3.3 (2.9) | 0 | 0 | 0 | 0 | 1.0 | 0.2 (0.4) |
| PO/IP2 | 0.75 | 0 | 0 | 4 | 2.2 | 12 | 0.7 | 1.0 (1.2) | 1.7 | 0 | 0 | 0 | 3.4 | 1.0 (1.5) |
| PP2 | 0.75 | 0 | 0 | 2 | 0.9 | 10 | 0.5 | 0.5 (0.4) | 0 | 0 | 0 | 0 | 0.2 | 0.0 (0.1) |
Percentages of total contralateral cell bodies or voxels with terminals. Percentages for cell body labeling was based on numbers of cell bodies per section corrected for overcounting based on soma diameters in each specific area (see Table 1).
These areas had too few and inconsistent cells labeled with BDA to obtain an average cell diameter. Instead, an average correction factor was derived from the areas with consistent labeling, and used to correct these counts. For this reason, these areas were excluded from our statistical analysis of cell body versus terminal distribution.
Tangential sectioning aided the coregistration of anatomical and physiological data using the blood vessel pattern (Xiao and Felleman, 2004; Dancause et al., 2005). In general, the location of terminal and cell body labeling was delineated primarily with respect to structural landmarks (e.g., central sulcus, cingulate sulcus) and myeloarchitecture (e.g., hand/face septum, area 3b and area 1/2 hand representation). In addition, in one case (396) the location of labeling in the contralateral hemisphere with respect to frontal motor areas (M1, PMv, PMd, and SMA) was physiologically verified using ICMS.
In the ipsilateral hemisphere we documented the injection site location in relation to PMv DFL. For each case the section showing the largest injection core was identified using a dissecting microscope. A contour was drawn on the section reconstruction (Neurolucida, MicroBright-Field) to circumscribe the core and its size determined with Neuroexplorer.
Identification of functional areas in the contralateral hemisphere
In tangential sections, labeled terminals (or cell bodies) formed four isolated clusters at locations corresponding to PMv, SMA, FR, and M1. The confirmation of these functional areas was done using ICMS in one case (396). Labeling located between PMv and SMA clusters was attributed to PMd. Labeling immediately rostral and ventral to PMv was included in area FR. All labeling medial to SMA was considered to be CMAs. To increase the confidence in the identification of the area the distance between a functional area and the hand/face septum found in the contralateral hemisphere was confirmed to be similar to the distance found in the ipsilateral hemisphere for the same area. The operculum was divided into PO/IP and AO. PO/IP was the operculum that is caudal to the hand/face septum and AO is rostral to it. Any labeling caudal to S1 and medial to PO/IP was included in PP. Thus, the identification of functional areas that were located outside of the neurophysiologically and neurohistochemically defined borders was limited and was primarily based on topographic location and similarities to results of previous tract-tracing studies. Whereas this limitation should be kept in mind, the consistency in the overall pattern of label in the contralateral hemisphere across cases and the confirmation of the functional location of the clusters of labeling in one case with ICMS allow us to be relatively confident of our approximations.
Statistical analysis
Quantitative assessments of the connections within each area were made to investigate the distribution of labeled cell bodies and voxels with labeled terminals in the contralateral cortex after the tracer injection into PMv. Analysis of variance (ANOVA) models tested for a differential distribution by connection type (cell bodies versus terminals in areas with consistent labeling across cases. i.e., PMv, SMA, FR, CMAs, PMd, Rostral M1) using the area-by-connection type interaction term. To identify major, moderate, and minor interhemispheric connections with PMv, a one-way ANOVA using the voxels with labeled terminals was performed. Fisher’s Least Significant Difference (LSD) was then used to provide objective criteria for group separation, using P < 0.05. Subsequent group assignment into major, moderate, and minor connections with PMv were based on post hoc comparisons that were not adjusted for multiplicity due to the small sample size (n = 5), and thus did not control the experiment-wise type I error rate (Rao, 1998). As a result, P-values associated with this analysis were liberal. This unadjusted approach was used to provide objective, quantitative guidance criteria by which to describe the distribution of the connections by grouping the contralateral areas, and thus we have refrained from claiming “statistical significance” in this portion of our results. Complete adjustment to contain the type I error rate would have left the group assignment analysis uninformative, as P-values would have become overly conservative.
We previously reported the ipsilateral connections for cases 1934, 1892, 9409, and 3024, thus allowing within-case comparison of ipsilateral and contralateral connection patterns. In that earlier publication (Dancause et al., 2006b), we used the percentage of extrinsic connections of PMv in the ipsilateral hemisphere, i.e., excluding area surrounding the injection core. Numbers of connections in PMv were subtracted from the total connections in the hemisphere as the tissue near the injection core in PMv contained the greatest proportion of labeled terminal voxels and cell bodies. This enabled us to avoid minimizing the percentage label in other areas. To allow comparison of ipsilateral and contralateral PMv connections, we adjusted the proportion of connections to contralateral areas in a similar manner:
where L = number of voxels with terminals, and X = cortical area of interest.
The nonparametric Fisher sign test (Hollander and Wolfe, 1999) was then used to compare PMv extrinsic connections in the ipsi- and contralateral hemispheres. We used voxels with labeled terminals for the four monkeys that had both ipsi- and contralateral data (396 was excluded because ipsilateral data was not available). The differences between the pairs of extrinsic connection percentages (ipsi- and contralateral) were compared within each monkey. The null hypothesis, that connection percentage of a given area was the same in both hemispheres (i.e., the median connection percentages for an area in the ipsi- hemisphere was equal to that in the contralateral hemisphere), was rejected when either the connections for a given area increased in all four monkeys or decreased in all four monkeys. It should be noted that due to the small number of pairs for each area (n = 4) the smallest possible P-value for this test would be 0.125. Thus, because statistical significance at traditional alpha values could not be obtained we only considered as relevant changes that were consistent in all four animals. When such changes could be observed we report that changes, i.e., either increase or decrease of PMv projections with areas x, were found consistently across cases. It should be noted that the number of animals (n = 5) is equal to or greater than that typically used in descriptive anatomical studies in primates. As the use of larger numbers is not feasible in such nonhuman primate studies, we employed relatively conservative approaches in our reporting of statistical results.
RESULTS
Size and location of injection core
The dense core was defined as the area of the injection site where cells and terminals could not be easily differentiated. The contour was drawn outside the area of transition where terminal, cell body, and fiber labeling started to be identifiable. Thus, the area we defined as the injection core partly included the surrounding halo (Dancause et al., 2006a). Sizes and locations of the injection cores in relation to the PMv forelimb representation in the ipsilateral hemisphere are summarized in Table 1. Figure 1 shows the topographic location of the injection core in all five cases. Injection cores were located primarily within the DFL (digits and wrist/forearm) of PMv. The injection cores for 1892 (FB) and 396 were larger and encroached on a small portion of proximal and orofacial representations. The larger injections resulted in a similar pattern of labeling, although there was weak labeling in additional areas (see Table 2).
Fig. 1.

Location of injection core. In each of the five cases injections of BDA (brown outline) and FB (dark blue outline; case 1892 only) were made within the ICMS-defined PMv DFL of the ipsilateral hemisphere. Documentation of labeled cell bodies and voxels with labeled terminals was achieved in the contralateral hemisphere. In cases 396 and 9409 the dashed line indicates the craniectomy border. In both cases the area of the dense core that was beyond the opening was probably within the DFL, but was designated ‘undefined’ for quantitative purposes (see Table 1). On the top left the cartoon depicts the physiologically defined areas in the ipsi- and contralateral hemispheres. Red = distal forelimb area; blue = proximal; hatched black = nonresponsive; yellow = face; M = Medial; R = Rostral. Scale bar = 1 mm.
Distribution of labeled cell bodies and voxels with labeled terminals in the contralateral cortex after tracer injection into the PMv DFL
In the contralateral hemisphere, labeled cell bodies were roughly round in shape (due to tangential sectioning). BDA-labeled cell bodies contained dense black granules, while FB-labeled cell bodies contained fluorescent tracer throughout the cytoplasm (Fig. 2). Neurites were seen extending from most BDA-labeled cell bodies and some FB-labeled cell bodies. In general, FB was much more effective as a retrograde tracer compared with 10,000 MW BDA, at least based on this single FB case (see Table 1). Nevertheless, cell body labeling after BDA injections was robust in the two cases that had larger injection cores (1934 and 396), and the distribution of BDA-labeled cell bodies was similar to the distribution of FB-labeled cell bodies. Thus, the analysis of the distribution and quantification of cell body labeling was based on the two cases with larger BDA injections and the one case with an FB injection (see Table 1).
Fig. 2.

Examples of cell body and terminal labeling. A: Low-magnification photomicrograph of retrograde labeling in the contralateral PMv of case 1934 following injection of BDA in the ipsilateral PMv DFL. Numerous labeled cell bodies and fibers can be observed. The gray square indicates the area magnified in B. B: Cell body with multiple BDA-labeled dendrites (arrowheads). The long arrow points to the fiber that is magnified further (bottom). The many varicosities seen on this fiber (arrowheads) are typical of terminal bouton labeling in the present series of cases. C: Low magnification of FB-labeled cell bodies in the contralateral PMv of case 1892 following injection of FB in the contralateral PMv DFL. White square indicates the area magnified in D. D: Magnified FB-labeled cell bodies. Examples of protuberances considered to be dendrites are indicated by white arrowheads. Contrast and brightness of photographs were adjusted in Photoshop. Scale bar = 100 μm.
Terminal labeling (BDA) in the contralateral cortex was far less than that observed in the ipsilateral cortex of the same cases (Dancause et al., 2006b). However, even with relatively small injection volumes, labeling was adequate for reliable qualitative and quantitative examination of terminal distribution within each cortical region. Distribution and quantification of terminal labeling was based on data from all five BDA cases. In all cases, labeled cell bodies and voxels with labeled terminals were found interspersed at the same locations (see Figs. 3–6), supporting the reciprocity of interhemispheric connections.
Fig. 3.

Distribution of labeled cell bodies in the contralateral hemisphere following FB injection in PMv DFL. FB-labeled cell bodies are indicated by black dots. Inset on the top right is a cartoon illustrating the location of the 14 functional areas examined in the present series. A: M1; B: CMAs; C: SMA; D: PMd; E: PMv; F: anterior operculum (AO); G: other frontal areas; H: frontal area rostral to PMv (FR); I: 3b hand; J: 1/2 hand; K: S1 ventral; L: area 3a hand; M: posterior operculum/inferior parietal cortex (PO/IP); N: posterior parietal cortex. Accordingly, FB-labeled cell bodies were found in the locations corresponding to the PMv DFL and SMA. In addition, labeled cells were found in the CMAs, rostral M1, FR, and PMd, the AO, PO/IP, and posterior parietal cortex. Gray backgrounds indicate the approximate location of M1 and PMv DFLs. Lateral to the central sulcus (Cs), a black line with a black arrowhead indicate the location of the myelin-defined hand/face septum. Scale bar = 1 mm.
Fig. 6.

Coregistration of neurophysiologically defined SMA DFL map with cell bodies and terminal distribution. In case 396 (large injection), additional ICMS mapping was conducted near the medial convexity to locate the SMA DFL. The medial extent of the SMA DFL was limited by the craniectomy border. Red contour shows the extent of the observed digit sites. These were surrounded by proximal representations (elbow and shoulder) shown by blue contours and unresponsive sites (hatched black area). This figure shows physiological confirmation that the dense labeling area found medial to PMd corresponds to the SMA forelimb representation and, to a large extent, to the DFL. Additional, sparser labeling was observed along the medial wall, which we attributed to CMAs. M, medial; R, rostral. Scale bar = 1 mm.
The distribution of connections in the contralateral hemisphere was documented by dividing the hemisphere into the same 14 cortical regions used in an earlier report of ipsilateral hemisphere (Dancause et al., 2006b; see Fig. 3 inset). Area locations were based on physiological documentation, myelin staining, anatomical landmarks, and comparison with other physiological and anatomical studies (Preuss and Goldman-Rakic, 1989; Krubitzer and Kaas, 1990; Jain et al., 2001). Figure 3 shows the distribution of labeled cell bodies following FB injections, while Figure 4 shows the distribution of voxels with labeled terminals in the contralateral hemisphere following an injection of BDA into the PMv DFL. In general, labeling was found in the same areas as found in the ipsilateral hemisphere (Dancause et al., 2006b). In the frontal lobe, label was found in PMv, SMA, FR, M1, PMd, and CMAs. As confirmed by physiological mapping in case 396, most of the labeling in the contralateral PMv was observed within the DFL (Fig. 5). However, significant labeling was also observed caudally within the PMv proximal representation. Very few connections were found in the orofacial representation forming the caudal border of PMv. The cluster of labeling in the area we have named FR was found rostral and lateral to the border of PMv DFL (≈2 mm rostral). As in the ipsilateral hemisphere, no or very sparse labeling was found in the caudomedial portion of M1. In the ipsilateral hemisphere we consistently found three domains of connections within the rostrolateral half of M1 (Dancause et al., 2006a). In the contralateral hemisphere we only found connections at two locations, corresponding to the two most rostral domains. The largest cluster of labeling was visible within the rostrolateral portion of the M1 DFL and, as in the ipsilateral M1, this cluster extended into the proximal forelimb representation. Another cluster of labeled terminals was located more medially at the rostral edge of M1. This cluster was mainly located within the proximal representation forming the border between M1 and PMd DFL. This cluster of labeling extended into the PMd DFL. Thus, the majority of this cluster was attributed to PMd. Labeling immediately medial to the PMv DFL was also attributed to the PMd proximal representations. In some cases, additional sparse labeling was found in the cortex lying on the upper and lower banks of the lateral sulcus in areas rostral to the hand/face septum (i.e., AO). In SMA, although the craniectomy did not allow us to derive a complete DFL map, as in the ipsilateral hemisphere, most of the labeling appeared to be located within the DFL (Fig. 6). Other clusters could also be observed medial to the SMA DFL and were attributed to the CMAs.
Fig. 4.

Distribution of voxels with labeled terminals in the contralateral hemisphere following BDA injection in PMv DFL. A: Representative distribution pattern of voxels with labeled terminals found in the contralateral hemisphere following relatively large BDA injection in PMv DFL (case 1934). B: Pattern of labeled voxels found following a comparatively small BDA injection in PMv DFL (case 9409). A large number of voxels with labeled terminals were found in the location corresponding to the PMv DFL. Medially, another large cluster corresponding to SMA was found. Sparse labeling was observed medial to SMA at locations corresponding to the CMAs, in a region rostral to PMv (FR) and in PMd. In some cases, sparse labeling was found in posterior parietal cortex, posterior operculum/inferior parietal cortex (PO/IP), and anterior operculum (AO) (see Table 2). Gray backgrounds indicate the approximate location of M1 and PMv DFLs. Lateral to the central sulcus (Cs), black line with black arrowhead indicates the location of the myelin-defined hand/face septum. Black dot = voxel with labeled terminals. Cs, central sulcus; M, medial; R, rostral. Scale bar = 1 mm.
Fig. 5.
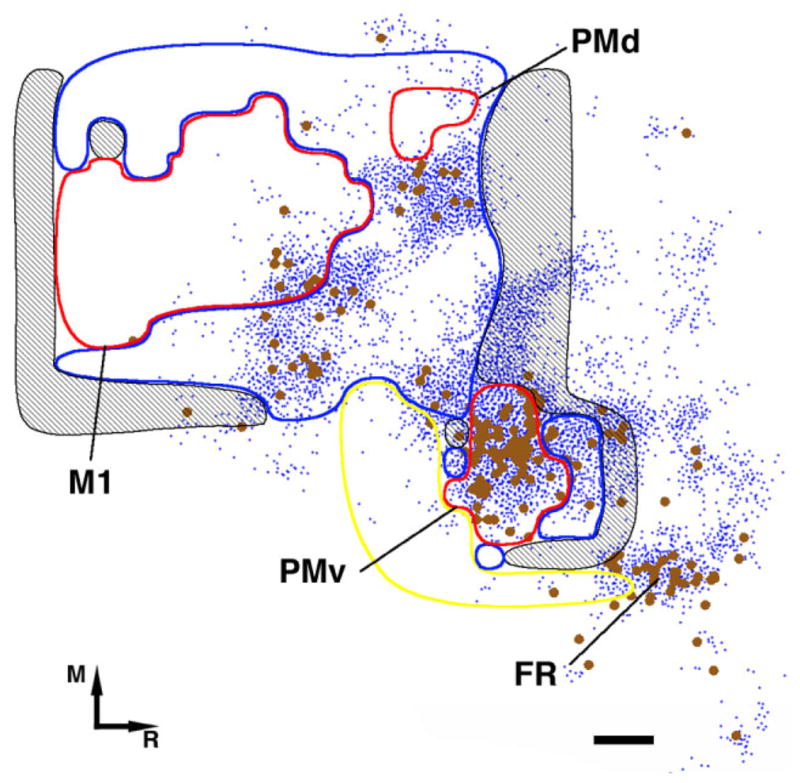
Coregistration of the M1, PMv and PMd DFL and labeling in the contralateral hemisphere. Coregistration of the M1 DFL (red area) to cell body and terminal (voxels with labeled terminals) distribution in case 396. When coregistered with the physiological map of PMv, M1, and PMd, the densest connections (both BDA-labeled cell bodies and voxels with labeled terminals) were shown to be located in PMv. In M1 the great majority of labeling was contained in a cluster located at the rostrolateral portion of the forelimb representation. As in the ipsilateral hemisphere, labeling was found in both distal and proximal representations. No labeling was found in the caudolateral aspect of M1 (where a cluster is found in the ipsilateral cortex; see Dancause et al., 2006a). Whereas some labeling was found at the rostral medial aspect of the DFL (where another cluster is found in the ipsilateral cortex; see Dancause et al., 2006a), most of the labeling was found further rostral (> 1.2 mm from the M1 distal forelimb rostral border), thus in PMd forelimb representation. Additional labeling could be attributed to PMd, immediately medial from PMv border where PMd trunk/back representation is usually found. This pattern of labeling in M1 left the caudal and medial portion of M1 largely unlabeled. Rostral and lateral from PMv another cluster of connections could be attributed to area FR. Connections between FR and PMv were also observed in the ipsilateral hemisphere. Terminal area indicated by blue dots. Cell bodies are indicated by larger brown dots. Red = distal forelimb area; Blue = proximal representation; Yellow = orofacial; Hatched black = nonresponsive; M = medial; R = rostral; Scale bar = 1 mm.
In the parietal lobe, labeling was occasionally observed in the cortex lying on the upper and lower banks of the lateral sulcus in areas caudal and lateral to the hand/face septum (i.e., PO/IP); in the cortex caudal to area S1 and medial to PO/IP (i.e., posterior parietal cortex or PP). However, no labeled terminals or cell bodies were found in S1 hand or orofacial areas or in prefrontal cortex of the contralateral cortex.
The quantitative distribution of labeled cell bodies and voxels with labeled terminals for each case is summarized in Table 2. To account for differences due to injection size or tracer type, the numbers of voxels with labeled terminals and cell bodies were transformed to percentages of total voxels with labeled terminals and cell bodies found in the contralateral hemisphere. A graphic representation is shown in Figure 7. Table 2 indicates a similar distribution of voxels with labeled terminals and cell body labeling across areas of the contralateral hemisphere, and the ANOVA test of area-by-connection type interaction (F = 0.96, df (numerator) = 5, df (denominator) = 36, P = 0.4572) gave no evidence to indicate that the distributions across the contralateral hemisphere differed by connection type (cell bodies versus voxels with labeled terminals). Thus, due to the greater number of cases available (five cases with terminal labeling, but only three cases with sufficient cell body labeling), subsequent statistical analysis of the interhemispheric connections was performed using the voxels with labeled terminals distribution.
Fig. 7.

Quantitative distribution of terminal labeling in the contralateral cortex. The numbers of BDA-labeled cell bodies and voxels with labeled terminals found in the contralateral cortex were obtained from seven sections for cases 1934, 9409, and 1892 (FB), and five sections for cases 1892 (BDA), 3024 and 396 (depths ranging from 500–1,800 μm). Numbers reported are the percentage of total BDA-labeled terminal voxels in the contralateral cortex (e.g., Area X/(total contralateral) * 100; see Table 2). PMv’s most numerous interhemispheric connections were with its homotopic counterpart. SMA also showed dense interhemispheric interconnectivity with PMv, but to a lesser extent. In addition, FR, Rostral M1, PMd, and CMAs had moderate interhemispheric connectivity with PMv. Finally, sparse connections were found inconsistently across cases in the anterior operculum (AO), posterior operculum/inferior parietal cortex (PO/IP), posterior parietal cortex, and caudal M1.
A one-way ANOVA of the contralateral connections confirmed a main effect of area (F = 57.45, df (numerator) = 9, df (denominator) = 40, P < 0.0001). Further post-hoc analysis using Fisher’s LSD (P < 0.05) was conducted. Based on this analysis, interhemispheric connections of PMv were divided into three groups: major, moderate, and minor.
Major interhemispheric connections of PMv (Group 1)
The contralateral PMv contained far more labeling than any other area, accounting for about 46% of the voxels with labeled terminals in the contralateral hemisphere (Table 2). SMA contained the second highest percentage, about 23%, of the voxels with labeled terminals in the contralateral hemisphere. The magnitude of connections of SMA was greater than each of the other regions in the contralateral hemisphere (P < 0.001). Thus, these two connections are considered major.
Moderate interhemispheric connections of PMv (Group 2)
A second group included FR, rostral M1, PMd, and CMAs (Table 2). Since the terminal labeling in these areas was lower than that of Group 1 (P < 0.001) and higher than terminal labeling in all remaining areas (Group 3; P < 0.027), these connections were considered moderate, ranging from 15% in rostral M1 to 3.6% in CMAs. Differences in the magnitude of connections between areas of Group 2 were not significantly different from each other with the exception of CMAs, which was lower than other areas in Group 2 (P < 0.047). However, because CMAs was significantly higher than all areas of Group 3, it was included in Group 2.
Minor interhemispheric connections of PMv (Group 3)
Voxels with labeled terminals (and cell bodies) were found in other areas of the contralesional cortex, including PO/IP, AO, PP, and caudal M1. However, labeling in these areas was sparser and inconsistently found across cases (see Table 2). The percentage of total voxels with labeled terminals within the hemisphere ranged from 1% in PO/IP to less than 0.1% in PP. The percentage of voxels with labeled terminals in these areas was lower compared with areas in Group 1 (P < 0.0001) or 2 (P < 0.027), and thus, these connections were considered minor. Differences in the percentage of voxels with labeled terminals between areas of Group 3 were not significantly different from each other.
Comparison of PMv extrinsic connections in the ipsi- and contralateral hemispheres in squirrel monkeys
Figure 8 shows the percentages of cell bodies and voxels with labeled terminals in the ipsilateral and contralateral hemispheres. To identify differences between the hemispheres, within-animal comparisons were made in four animals, since data were available for both hemispheres in these cases (1934, 1892, 9409, and 3024). The percentages of voxels with labeled terminals in the ipsi- and contralateral hemispheres were compared for each cortical area using Fisher’s sign test of the pairwise differences (contra- minus ipsilateral percentages). The percentage of voxels with labeled terminals in the contralateral hemisphere was consistently higher in all four cases in SMA (median difference (Med) = 40.1%) and PMd (Med = 4.9%), and consistently lower in M1 rostral (Med = −11.5%), FR (Med = −9.1%), AO (Med = −4.5%), S1 ventral (Med = −2.7%), other frontal (Med = −0.8%), 3a hand (Med= −0.3%), and 3b hand (Med = −0.3%).
Fig. 8.

Comparison of patterns of ipsi- and contralateral projections of PMv. Proportion of extrinsic output from PMv from ipsi- and contralateral cortical areas (n = 4; 396 is excluded). The same numbers of sections and cases were used for this analysis as reported in Figure 7.
DISCUSSION
In this study we found that, as in the ipsilateral hemisphere, PMv connections with areas of the contralateral hemisphere are reciprocal. However, in contrast to the ipsilateral pattern of connections, in the contralateral hemisphere, PMv has connections almost exclusively with motor cortical areas. These connections were found in the same areas with which PMv has its connections in the ipsilateral motor cortical areas. In all animals, PMv DFL had interhemispheric connections with its homotopic counterpart (i.e., contralateral PMv), SMA, PMd, FR, the rostral portion of the M1 forelimb area, and CMAs. Sparse connections were also found in other areas of the frontal and parietal cortex but inconsistently across animals. Combining these data on contralateral connections with previous results in the ipsilateral hemisphere (Dancause et al., 2006b), Figure 9 summarizes the pattern of cortical connections of PMv in squirrel monkeys. Whereas we use the term ‘connections’ in this discussion, one should keep in mind that the statistical analysis was performed using terminals voxels with labeled terminals only.
Fig. 9.

Pattern of PMv connections in squirrel monkeys. Summary of the pattern of ipsi (black) and contralateral (red) connections of PMV as we described in squirrel monkeys. The thickness of the arrows is related to the intensity of connections (major, moderate, minor). Dotted red lines show connections that were not found in all cases (inconsistent). Data of ipsilateral connections are from Dancause et al. (2006b). R, rostral; L, lateral.
Detailed comparison of the pattern of ipsilateral and contralateral connections of PMv in squirrel monkeys
Our data allowed a direct, within-animal comparison of ipsilateral and contralateral connections of PMv. This analysis led us to conclude that the pattern of contralateral connections differs quantitatively with the pattern of ipsilateral connections. The proportion of contralateral connections to both SMA and PMd are higher than the proportion of ipsilateral connections to these areas. In contrast, the proportion of contralateral connections to M1, FR, AO, S1 ventral (orofacial), 3a hand, and 3b hand is lower than the proportion of ipsilateral connections to these areas.
Connections with frontal cortex
In our view, the most striking result we found was the higher proportion of interhemispheric connections that PMv has with SMA in comparison to the ipsilateral connections. The functional relevance of major interhemispheric connections with SMA cannot be directly extrapolated from our data. However, SMA has been proposed to be particularly critical for bimanual motor control. Following SMA lesions, monkeys have long-term deficits in bimanual coordination and have a tendency to show mirror movements (Brinkman, 1984). Interestingly, these long-term deficits have not been reproduced following lesions in other premotor areas (Brinkman, 1984). In addition, patients with SMA lesions also show problems with bimanual coordination that can be exaggerated if both hands perform simultaneous but different movements (Laplane et al., 1977). The role of interhemispheric connections in complex bimanual inter-coordination has been inferred from callosal disconnection experiments, which demonstrated deficits in bimanual coordination and intermanual conflicts (Sauerwein and Lassonde, 1997; Lausberg et al., 1999). It is thus possible that SMA has a stronger interhemispheric network because of an augmented role in bimanual coordination in comparison to other cortical areas.
A significantly higher proportion of PMv interhemispheric connections, in comparison to the pattern of ipsilateral connections, was also found with PMd. In macaques, interhemispheric connections between the caudal portion of PMd (F2; Matelli et al., 1985) with PMv have been well described (Marconi et al., 2003) and the role of PMd in bimanual motor control has already been suggested (Kermadi et al., 2000). In fact, other premotor areas have also been proposed to be involved in bimanual coordination, leading to the hypothesis that this function is sustained by an extensive interhemispheric network involving, among others, all premotor areas (Swinnen, 2002).
Our current set of data show that, in comparison to the ipsilateral network, the pattern of contralateral connections has a tendency for a higher proportion of connections with other premotor areas and lower proportion of connections with any other areas of the frontal cortex. This suggests that contralateral projections of PMv are mostly devoted to interhemispheric modulation of premotor activity and point to a crucial role of interhemispheric connections in movement preparation and execution. If interhemispheric connections are a key component of the hardware for bimanual inter-coordination, the extended interhemispheric network of premotor areas certainly provides a framework through which premotor areas can be particularly crucial to this function. In support of that hypothesis, several functional imaging studies of bimanual coordination reported an increased frontal activation within premotor areas and not M1 (Meyer-Lindenberg et al., 2002; Ullen et al., 2003; Aramaki et al., 2006). Whereas this function has not been investigated directly, the extended interhemispheric network of premotor areas might point to the involvement of direct premotor corticospinal outputs in the control of bimanual coordination. Premotor areas are known to have numerous corticospinal connections (He et al., 1995) and thus exhibit the ‘hardware’ for the task. Clearly, this is a speculation based on the pattern of anatomical connectivity, but if accurate it would greatly enhance our understanding of the role of premotor corticospinal output.
Finally, another observation with regard to the pattern of interhemispheric connections in the frontal cortex is that the proportion of projections to the contralateral area FR was less than that found in the ipsilateral hemisphere. FR represents an additional forelimb field in which distal forelimb movements can be evoked using higher current stimulation levels than PMv (for further discussion of FR, see Dancause et al., 2006b). Because we found a reduced proportion of connections of PMv with this area in the contralateral hemisphere in comparison to the ipsilateral hemisphere, it appears that the pattern of interhemispheric connections of PMv with FR follows more closely that of prefrontal areas (Frontal Other and AO) rather than that of other premotor areas. However, to date the function of this region and its possible homologs in other species is still not completely clear and will require further investigation.
Connections with the parietal cortex
In the ipsilateral hemisphere, extensive connections were found with the parietal cortex (Dancause et al., 2006b). In contrast, contralateral connections of PMv with the parietal cortex were sparse or absent in all cases. The proportion of contralateral connections with subdivisions of S1 (i.e., 3a, 3b, and S1 ventral) was consistently less than that of the ipsilateral network. Additionally, in the ipsilateral hemisphere connections are found on the upper and lower banks of the lateral sulcus, in areas caudal and lateral to the S1 hand representation (Dancause et al., 2006b). We have referred to this area as the posterior operculum/inferior parietal (PO/IP) cortex in our previous publications. In macaques, this area has been further divided and connections between PMv with area 7b (Godschalk et al., 1984; Ghosh and Gattera, 1995), second somatosensory area (S2), and the parietal ventral cortex (PV) (Tanné-Gariépy et al., 2002) have been described. In the ipsilateral hemisphere the interconnections between PO/IP and PMv suggest that PMv receives integrated sensory information, particularly somatosensory information. This somatosensory information can be used for object recognition and precise adaptation of hand configuration. Connections with 7b also suggest a particular role for PMv in the integration of sensory signal from the face and forearm.
There is thus an obvious trend when comparing the pattern of ipsilateral and contralateral connections of PMv such that the proportion of contralateral connections with parietal areas is much lower. The lower proportion of connections between the contralateral S1 and PO/IP with PMv suggest that the ipsilateral PMv does not access (nor modulate via reciprocal connections) the information processed by these sensory areas in the contralateral hemisphere. Functionally, this suggests that interhemispheric connections of PMv are much more involved in the integration and/or modulation of motor activity than of sensory information.
General pattern of interhemispheric connections of premotor areas across species
To date, interhemispheric connections of premotor areas have documented that SMA has its densest connections with the contralateral SMA (Rouiller et al., 1994), sparser connections with the cingulate motor areas (CMAs), premotor cortex, and finally with M1. PMd also has its densest connections with its homotopic counterpart and progressively fewer connections with SMA, area 8 (frontal eye fields), prefrontal cortex (area 46), PMv, and M1 (Marconi et al., 2003). A previous study on PMv interhemispheric connectivity in macaques (Boussaoud et al., 2005) and the present study in squirrel monkeys agree that PMv’s densest connections are with the contralateral PMv. From our results, it appears that PMv interhemispheric connections are principally with premotor areas (about 76% of total interhemispheric connections; see Table 2), in agreement with the pattern of interhemispheric connections reported for other premotor areas (Muakkassa and Strick, 1979; Gould et al., 1986; Rouiller et al., 1994; Marconi et al., 2003; Boussaoud et al., 2005). It is reasonable to propose that the predominant network of premotor areas is with their homotopic counterpart, and thus is a general rule of interhemispheric organization. To our knowledge, only one study, which reported cortical connections of SMA in squirrel monkeys, found projections in homotopic contralateral cortex to be sparse (Jurgens, 1984), and thus would seem to contradict this rule of homotopic preference. Currently, it is not clear if this divergence of SMA pattern of interhemispheric connectivity from studies in macaques (Rouiller et al., 1994) is due to interspecies differences. However, our results in squirrel monkeys show that PMv follows a similar pattern of connections as documented in macaques (Boussaoud et al., 2005). The conformity of the organization of the pre-motor network across species suggests that these areas would subserve similar functions for motor control in different primates.
Acknowledgments
The authors thank Robert Cross for technical assistance during surgical procedures and Ines Eisner-Janowicz, Erik Plautz, Ann Stowe, Michael Taylor, and Elena Zoubina for help during the physiological data collection.
Grant sponsor: Canadian Institutes of Health Research (CIHR) (fellowship to N.D.); Grant sponsor: National Institutes of Health (NIH); Grant number: NS30853 (to R.J.N.); Grant sponsor: NICHD; Grant number: HD02528; Grant sponsor: Landon Center on Aging.
LITERATURE CITED
- Abercrombie A. Estimation of nuclear population from microtome sections. Anat Rec. 1946;94:239–247. doi: 10.1002/ar.1090940210. [DOI] [PubMed] [Google Scholar]
- Aramaki Y, Honda M, Okada T, Sadato N. Neural correlates of the spontaneous phase transition during bimanual coordination. Cereb Cortex. 2006;16:1338–1348. doi: 10.1093/cercor/bhj075. [DOI] [PubMed] [Google Scholar]
- Boussaoud D, Tanne-Gariepy J, Wannier T, Rouiller EM. Callosal connections of dorsal versus ventral premotor areas in the macaque monkey: a multiple retrograde tracing study. BMC Neurosci. 2005;6:67. doi: 10.1186/1471-2202-6-67. [DOI] [PMC free article] [PubMed] [Google Scholar]
- Brinkman C. Supplementary motor area of the monkey’s cerebral cortex: short- and long-term deficits after unilateral ablation and the effects of subsequent callosal section. J Neurosci. 1984;4:918–929. doi: 10.1523/JNEUROSCI.04-04-00918.1984. [DOI] [PMC free article] [PubMed] [Google Scholar]
- Dancause N, Barbay S, Frost SB, Plautz EJ, Chen D, Zoubina EV, Stowe AM, Nudo RJ. Extensive cortical rewiring after brain injury. J Neurosci. 2005;25:10167–10179. doi: 10.1523/JNEUROSCI.3256-05.2005. [DOI] [PMC free article] [PubMed] [Google Scholar]
- Dancause N, Barbay S, Frost SB, Plautz EJ, Popescu M, Dixon PM, Stowe AM, Friel KM, Nudo RJ. Topographically divergent and convergent connectivity between premotor and primary motor cortex. Cereb Cortex. 2006a;16:1057–1068. doi: 10.1093/cercor/bhj049. [DOI] [PubMed] [Google Scholar]
- Dancause N, Barbay S, Frost SB, Plautz EJ, Stowe AM, Friel KM, Nudo RJ. Ipsilateral connections of the ventral premotor cortex in a New World primate. J Comp Neurol. 2006b;495:374–390. doi: 10.1002/cne.20875. [DOI] [PMC free article] [PubMed] [Google Scholar]
- Dancause N, Barbay S, Frost SB, Zoubina EV, Plautz EJ, Mahnken JD, Nudo RJ. Effects of small ischemic lesions in the primary motor cortex on neurophysiological organization in ventral premotor cortex. J Neurophysiol. 2006c;96:3506–3511. doi: 10.1152/jn.00792.2006. [DOI] [PubMed] [Google Scholar]
- Dum RP, Strick PL. Frontal lobe inputs to the digit representations of the motor areas on the lateral surface of the hemisphere. J Neurosci. 2005;25:1375–1386. doi: 10.1523/JNEUROSCI.3902-04.2005. [DOI] [PMC free article] [PubMed] [Google Scholar]
- Frost SB, Barbay S, Friel KM, Plautz EJ, Nudo RJ. Reorganization of remote cortical regions after ischemic brain injury: a potential substrate for stroke recovery. J Neurophysiol. 2003;89:3205–3214. doi: 10.1152/jn.01143.2002. [DOI] [PubMed] [Google Scholar]
- Gallyas F. Silver staining of myelin by means of physical development. Neurol Res. 1979;1:203–209. doi: 10.1080/01616412.1979.11739553. [DOI] [PubMed] [Google Scholar]
- Gentilucci M, Fogassi L, Luppino G, Matelli M, Camarda R, Rizzolatti G. Functional organization of inferior area 6 in the macaque monkey. I. Somatotopy and the control of proximal movements. Exp Brain Res. 1988;71:475–490. doi: 10.1007/BF00248741. [DOI] [PubMed] [Google Scholar]
- Gentilucci M, Fogassi L, Luppino G, Matelli M, Camarda R, Rizzolatti G. Somatotopic representation in inferior area 6 of the macaque monkey. Brain Behav Evol. 1989;33:118–121. doi: 10.1159/000115912. [DOI] [PubMed] [Google Scholar]
- Ghosh S, Gattera R. A comparison of the ipsilateral cortical projections to the dorsal and ventral subdivisions of the macaque premotor cortex. Somatosens Mot Res. 1995;12:359–378. doi: 10.3109/08990229509093668. [DOI] [PubMed] [Google Scholar]
- Godschalk M, Lemon RN, Nijs HG, Kuypers HG. Behaviour of neurons in monkey peri-arcuate and precentral cortex before and during visually guided arm and hand movements. Exp Brain Res. 1981;44:113–116. doi: 10.1007/BF00238755. [DOI] [PubMed] [Google Scholar]
- Godschalk M, Lemon RN, Kuypers HG, Ronday HK. Cortical afferents and efferents of monkey postarcuate area: an anatomical and electrophysiological study. Exp Brain Res. 1984;56:410–424. doi: 10.1007/BF00237982. [DOI] [PubMed] [Google Scholar]
- Gould HJ, 3rd, Kaas JH. The distribution of commissural terminations in somatosensory areas I and II of the grey squirrel. J Comp Neurol. 1981;196:489–504. doi: 10.1002/cne.901960311. [DOI] [PubMed] [Google Scholar]
- Gould HJ, 3rd, Cusick CG, Pons TP, Kaas JH. The relationship of corpus callosum connections to electrical stimulation maps of motor, supplementary motor, and the frontal eye fields in owl monkeys. J Comp Neurol. 1986;247:297–325. doi: 10.1002/cne.902470303. [DOI] [PubMed] [Google Scholar]
- Guillery RW. On counting and counting errors. J Comp Neurol. 2002;447:1–7. doi: 10.1002/cne.10221. [DOI] [PubMed] [Google Scholar]
- He SQ, Dum RP, Strick PL. Topographic organization of corticospinal projections from the frontal lobe: motor areas on the medial surface of the hemisphere. J Neurosci. 1995;15(5 Pt 1):3284–3306. doi: 10.1523/JNEUROSCI.15-05-03284.1995. [DOI] [PMC free article] [PubMed] [Google Scholar]
- Hollander M, Wolfe DA. Nonparametric statistical methods. New York: John Wiley & Sons; 1999. [Google Scholar]
- Jain N, Qi HX, Catania KC, Kaas JH. Anatomic correlates of the face and oral cavity representations in the somatosensory cortical area 3b of monkeys. J Comp Neurol. 2001;429:455–468. doi: 10.1002/1096-9861(20010115)429:3<455::aid-cne7>3.0.co;2-f. [DOI] [PubMed] [Google Scholar]
- Jurgens U. The efferent and afferent connections of the supplementary motor area. Brain Res. 1984;300:63–81. doi: 10.1016/0006-8993(84)91341-6. [DOI] [PubMed] [Google Scholar]
- Kermadi I, Liu Y, Rouiller EM. Do bimanual motor actions involve the dorsal premotor (PMd), cingulate (CMA) and posterior parietal (PPC) cortices? Comparison with primary and supplementary motor cortical areas. Somatosens Mot Res. 2000;17:255–271. doi: 10.1080/08990220050117619. [DOI] [PubMed] [Google Scholar]
- Krubitzer LA, Kaas JH. The organization and connections of somatosensory cortex in marmosets. J Neurosci. 1990;10:952–974. doi: 10.1523/JNEUROSCI.10-03-00952.1990. [DOI] [PMC free article] [PubMed] [Google Scholar]
- Kurata K. Corticocortical inputs to the dorsal and ventral aspects of the premotor cortex of macaque monkeys. Neurosci Res. 1991;12:263–280. doi: 10.1016/0168-0102(91)90116-g. [DOI] [PubMed] [Google Scholar]
- Kurata K, Hoshi E. Reacquisition deficits in prism adaptation after muscimol microinjection into the ventral premotor cortex of monkeys. J Neurophysiol. 1999;81:1927–1938. doi: 10.1152/jn.1999.81.4.1927. [DOI] [PubMed] [Google Scholar]
- Kurata K, Tanji J. Premotor cortex neurons in macaques: activity before distal and proximal forelimb movements. J Neurosci. 1986;6:403–411. doi: 10.1523/JNEUROSCI.06-02-00403.1986. [DOI] [PMC free article] [PubMed] [Google Scholar]
- Laplane D, Talairach J, Meininger V, Bancaud J, Orgogozo JM. Clinical consequences of corticectomies involving the supplementary motor area in man. J Neurol Sci. 1977;34:301–314. doi: 10.1016/0022-510x(77)90148-4. [DOI] [PubMed] [Google Scholar]
- Lausberg H, Gottert R, Munssinger U, Boegner F, Marx P. Callosal disconnection syndrome in a left-handed patient due to infarction of the total length of the corpus callosum. Neuropsychologia. 1999;37:253–265. doi: 10.1016/s0028-3932(98)00079-7. [DOI] [PubMed] [Google Scholar]
- Marconi B, Genovesio A, Giannetti S, Molinari M, Caminiti R. Callosal connections of dorso-lateral premotor cortex. Eur J Neurosci. 2003;18:775–788. doi: 10.1046/j.1460-9568.2003.02807.x. [DOI] [PubMed] [Google Scholar]
- Matelli M, Luppino G, Rizzolatti G. Patterns of cytochrome oxidase activity in the frontal agranular cortex of the macaque monkey. Behav Brain Res. 1985;18:125–136. doi: 10.1016/0166-4328(85)90068-3. [DOI] [PubMed] [Google Scholar]
- Matelli M, Camarda R, Glickstein M, Rizzolatti G. Afferent and efferent projections of the inferior area 6 in the macaque monkey. J Comp Neurol. 1986;251:281–298. doi: 10.1002/cne.902510302. [DOI] [PubMed] [Google Scholar]
- McGuire PK, Bates JF, Goldman-Rakic PS. Interhemispheric integration: II. Symmetry and convergence of the corticostriatal projections of the left and the right principal sulcus (PS) and the left and the right supplementary motor area (SMA) of the rhesus monkey. Cereb Cortex. 1991;1:408–417. doi: 10.1093/cercor/1.5.408. [DOI] [PubMed] [Google Scholar]
- Meyer-Lindenberg A, Ziemann U, Hajak G, Cohen L, Berman KF. Transitions between dynamical states of differing stability in the human brain. Proc Natl Acad Sci U S A. 2002;99:10948–10953. doi: 10.1073/pnas.162114799. [DOI] [PMC free article] [PubMed] [Google Scholar]
- Muakkassa KF, Strick PL. Frontal lobe inputs to primate motor cortex: evidence for four somatotopically organized ‘premotor’ areas. Brain Res. 1979;177:176–182. doi: 10.1016/0006-8993(79)90928-4. [DOI] [PubMed] [Google Scholar]
- Mushiake H, Inase M, Tanji J. Neuronal activity in the primate premotor, supplementary, and precentral motor cortex during visually guided and internally determined sequential movements. J Neurophysiol. 1991;66:705–718. doi: 10.1152/jn.1991.66.3.705. [DOI] [PubMed] [Google Scholar]
- Nudo RJ, Milliken GW. Reorganization of movement representations in primary motor cortex following focal ischemic infarcts in adult squirrel monkeys. J Neurophysiol. 1996;75:2144–2149. doi: 10.1152/jn.1996.75.5.2144. [DOI] [PubMed] [Google Scholar]
- Nudo RJ, Jenkins WM, Merzenich MM, Prejean T, Grenda R. Neurophysiological correlates of hand preference in primary motor cortex of adult squirrel monkeys. J Neurosci. 1992;12:2918–2947. doi: 10.1523/JNEUROSCI.12-08-02918.1992. [DOI] [PMC free article] [PubMed] [Google Scholar]
- Preuss TM, Goldman-Rakic PS. Connections of the ventral granular frontal cortex of macaques with perisylvian premotor and somatosensory areas: anatomical evidence for somatic representation in primate frontal association cortex. J Comp Neurol. 1989;282:293–316. doi: 10.1002/cne.902820210. [DOI] [PubMed] [Google Scholar]
- Rao PV. Statistical research methods in the life sciences. Pacific Grove, CA: Brooks/Cole; 1998. [Google Scholar]
- Reiner A, Veenman CL, Medina L, Jiao Y, Del Mar N, Honig MG. Pathway tracing using biotinylated dextran amines. J Neurosci Methods. 2000;103:23–37. doi: 10.1016/s0165-0270(00)00293-4. [DOI] [PubMed] [Google Scholar]
- Rizzolatti G, Matelli M, Pavesi G. Deficits in attention and movement following the removal of postarcuate (area 6) and prearcuate (area 8) cortex in macaque monkeys. Brain. 1983;106(Pt 3):655–673. doi: 10.1093/brain/106.3.655. [DOI] [PubMed] [Google Scholar]
- Rizzolatti G, Camarda R, Fogassi L, Gentilucci M, Luppino G, Matelli M. Functional organization of inferior area 6 in the macaque monkey. II. Area F5 and the control of distal movements. Exp Brain Res. 1988;71:491–507. doi: 10.1007/BF00248742. [DOI] [PubMed] [Google Scholar]
- Rizzolatti G, Fogassi L, Gallese V. Motor and cognitive functions of the ventral premotor cortex. Curr Opin Neurobiol. 2002;12:149–154. doi: 10.1016/s0959-4388(02)00308-2. [DOI] [PubMed] [Google Scholar]
- Rouiller EM, Babalian A, Kazennikov O, Moret V, Yu XH, Wiesendanger M. Transcallosal connections of the distal forelimb representations of the primary and supplementary motor cortical areas in macaque monkeys. Exp Brain Res. 1994;102:227–243. doi: 10.1007/BF00227511. [DOI] [PubMed] [Google Scholar]
- Sauerwein HC, Lassonde M. Neuropsychological alterations after split-brain surgery. J Neurosurg Sci. 1997;41:59–66. [PubMed] [Google Scholar]
- Swinnen SP. Intermanual coordination: from behavioural principles to neural-network interactions. Nat Rev Neurosci. 2002;3:348–359. doi: 10.1038/nrn807. [DOI] [PubMed] [Google Scholar]
- Tanné-Gariépy J, Rouiller EM, Boussaoud D. Parietal inputs to dorsal versus ventral premotor areas in the macaque monkey: evidence for largely segregated visuomotor pathways. Exp Brain Res. 2002;145:91–103. doi: 10.1007/s00221-002-1078-9. [DOI] [PubMed] [Google Scholar]
- Ullen F, Forssberg H, Ehrsson HH. Neural networks for the coordination of the hands in time. J Neurophysiol. 2003;89:1126–1135. doi: 10.1152/jn.00775.2002. [DOI] [PubMed] [Google Scholar]
- Veenman CL, Reiner A, Honig MG. Biotinylated dextran amine as an anterograde tracer for single- and double-labeling studies. J Neurosci Methods. 1992;41:239–254. doi: 10.1016/0165-0270(92)90089-v. [DOI] [PubMed] [Google Scholar]
- Wise SP. The ventral premotor cortex, corticospinal region C, and the origin of primates. Cortex. 2006;42:521–524. doi: 10.1016/s0010-9452(08)70391-5. [DOI] [PubMed] [Google Scholar]
- Xiao Y, Felleman DJ. Projections from primary visual cortex to cytochrome oxidase thin stripes and interstripes of macaque visual area 2. Proc Natl Acad Sci U S A. 2004;101:7147–7151. doi: 10.1073/pnas.0402052101. [DOI] [PMC free article] [PubMed] [Google Scholar]