

Abstract
The co-assembly of mutually complementary, but self-repulsive oligopeptide pairs into viscoelastic hydrogels has been studied. Oligopeptides of 6, 10, and 14 amino acid residues were used to investigate the effects of peptide chain length on the structural and mechanical properties of the resulting hydrogels. Biophysical characterizations, including dynamic rheometry, small-angle X-ray scattering (SAXS) and fluorescence spectroscopy, were used to investigate hydrogelation at the bulk, fiber, and molecular levels, respectively. Upon mixing, the 10-mer peptides and the 14-mer peptides both form hydrogels while the 6-mer peptides do not. SAXS studies point to morphological similarity of the cross-sections of fibers underlying the 10:10 and 14:14 gels. However, fluorescence spectroscopy data suggest tighter packing of the amino acid side chains in the 10:10 fibers. Consistent with this tighter packing, dynamic rheometry data show that the 10:10 gel has much higher elastic modulus than the 14:14 mer (18 kPa vs. 0.1 kPa). Therefore, from the standpoint of mechanical strength, the optimum peptide chain length for this class of oligopeptide-based hydrogels is around 10 amino acid residues.
Introduction
Proteins and peptides, either individually as molecules (e.g., enzymes) or collectively as materials (e.g., collagen), have a wide range of biological functions. In light of this, much effort has been invested in protein engineering, with the hope of generating proteins with modified or new properties and functions. From an engineering standpoint, the ability to control molecular and material properties with minimum chemical perturbation would be of tremendous practical value. Hydrogels are viscoelastic soft materials,1,2 which can be either synthetic or natural. For example, collagen exists in the body as a hydrogel. Engineered hydrogels are finding diverse applications in biomedicine, such as tissue engineering scaffolds,3 controlled-release drug delivery vehicles,4 and as cell-culture matrices.5,6 Peptide-based hydrogels, whether chemically synthesized or genetically produced, have a precisely defined chemical composition in terms of sequence, chain length and stereochemistry. This feature makes the control of material properties via molecular design a much more realistic goal in peptide-based hydrogels than in traditional polymer-based hydrogels. In this work, we set out to explore the effects of chain length on hydrogels assembled from unprotected oligopeptides.
Based on the seminal discovery by Zhang et al. that peptides with alternating charged/neutral sequence patterns can form hydrogels,7 we previously developed a modular approach to the engineering of peptide-based hydrogels.8,9,10 Our design separates positively and negatively charged amino acids into different peptide modules (i.e., alternating positive/neutral and alternating negative/neutral sequence patterns). As a result of the electrostatic repulsions inherent within each peptide module, spontaneous hydrogelation due to slight environmental fluctuations (pH, temperature, ionic strength, etc.) is avoided. Hydrogelation occurs when solutions of oppositely-charged peptide modules are mixed. Material assembly is driven by intermolecular interactions such as electrostatic attractions of two oppositely charged modules, possibly complemented by hydrophobic interactions and hydrogen bonding.8 The most significant benefit of a modular approach is the ability to control material properties combinatorially by pairing different oppositely charged modules.
For instance, we have explored pairing of oppositely charged un-equal chain length oligopeptides with an intention to create sticky-ends in growing peptide fibers and thereby modulate bulk material properties. It was found that sticky-end pairs were not beneficial in comparison to the blunt-end pairs. In particular the hydrogels assembled from oligopeptides of 15 amino acid long is not mechanically as strong as hydrogels assembled from oligopeptides of 10 amino acid long.10 Based on this observation, we hypothesize that for this type of mutually-complementary but self-repulsive oligopeptide pairs, the optimal chain length for hydrogelation is around 10 amino acids. To validate this hypothesis, three peptide pairs of chain length 6, 10 and 14 were designed (Table 1). The sequences of these oligopeptides have the same alternating positive/neutral or alternating negative/neutral patterns, as in our previous works.8,9,10
Table 1.
Sequences of oligopeptides a
| Peptide | Sequence | Molecular Weight (Da) | Molar Conc.(for 1% wt/wt) |
|---|---|---|---|
| OAW6 | formyl-WOAOAO-amide | 715 | 13.6 mM |
| OAW10 | formyl-WOAOAOAOAO-amide | 1,086 | 8.9 mM |
| OAW14 | formyl-WOAOAOAOAOAOAO-amide | 1,456 | 6.6 mM |
| Peptide | Sequence | Molecular Weight (Da) | Molar Conc.(for 1% wt/wt) |
| EAW6 | formyl-WEAEAE-amide | 760 | 13.6 mM |
| EAW10 | formyl-WEAEAEAEAE-amide | 1,161 | 8.9 mM |
| EAW14 | formyl-WEAEAEAEAEAEAE-amide | 1,561 | 6.6 mM |
The numbers represent the chain length of peptides. Modular material assembly is achieved by pairing a positive module with a negative module. A, alanine; E, glutamic acid; O, ornithine; W, tryptophan. Tryptophan serves as a spectroscopic probe to determine concentration and to monitor gelation. The N-, C-termini of each peptide were formylated (formyl-) and amidated ( amide), respectively.
In the present paper, we explore the effects of chain length on the structural and mechanical characteristics of hydrogels using a combination of biophysical techniques.11 Fluorescence spectroscopy and small-angle X-ray scattering (SAXS) were used to explore structures of the hydrogels at the molecular and fiber levels, respectively, while dynamic rheometry was used to study viscoelastic properties of the hydrogels at the bulk material level. Confirming the exsistence of an optimal chain length for material strength has braod implications for the engineering and manufacture of peptide-based viscoelastic materials.
Materials and methods
Peptide design and synthesis
The sequences of positively and negatively charged oligopeptide modules are given in Table 1. The separation of positive and negative charges into different modules make it possible to initiate gelation through mixing. Such mutual-complementarity distinguishes our design from other works where the peptide gelator is self-complementary and gelation is initiated through changes either chemical (e.g., pH, ionic strength) or physical (e.g., temperature) environment. The advantage of mixing-induced gelation is that it preserves the sample’s pH, ionic strength and temperature.
Oligopeptides were synthesized using Fmoc solid-phase peptide synthesis12 as described in a previous publicaiton.13 The molecular weight for each peptide was verified using MALDI-MS. Purity of the peptides was verified by analytical HPLC.
For biophysical characterizations, purified peptides were dissolved and dialyzed in phosphate-buffered saline (50 mM phosphate + 100 mM NaCl) at pH 7. The pH of each dialyzed peptide solution was verified and, if necessary, adjusted to pH 7. Concentrations of the peptide solutions were determined on the basis of the molar absorptivity of tryptophan at 280 nm (ε280 = 5690 M−1 cm−1).14 All hydrogel measurements were conducted at a total peptide concentration of 1 wt%/wt.
Dynamic rheometry
Sample preparation
Samples for rheological measurements were prepared as described previously.13 The just-mixed sample was immediately transferred into the parallel-plate geometry with a pre-set temperature of 25°C.
Rheological Measurements
Dynamic rheological measurements were made using an AR 550 stress-controlled rheometer equipped with a Peltier temperature-control unit, and a 20-mm diameter parallel-plate aluminum geometry with a solvent trap (TA Instruments, New Castle, DE). To prevent solvent evaporaiton during measurements, the solvent trap was filled with mineral oil. Time-sweep measurements were conducted at 0.2% strain amplitude and 1 rad/s angular frequency at 25°C. The setting of the strain amplitude (γ = 0.2%) was selected based on the linear region of the dependence of shear modulus vs strain amplitude previously observed for this class of oligopeptide-based hydrogels.8,13
Fluorescence spectroscopy
Sample Preparation
Peptide solutions were prepared as described for the rheological experiments. The just-mixed samples were immediately transferred to quartz cuvettes that were equilibrated at room temperature and fixed in the cuvette holder of the fluorometer which was maintained at 25°C.
Steady-State Fluorescence Measurements and Data Analysis
Steady state fluorescence spectra were obtained using a Varian Cary Eclipse Spectrofluorometer (Varian Inc.) equipped with a Peltier temperature-control unit (QUANTUM Northwest) in 1 mm × 10 mm quartz cuvettes. The short path length for excitation (1mm) and the long path length for emission (10 mm) were chosen to avoid absorption of the excitation light and to minimize interference from Raman scattering. Samples were excited at 300 nm, and emission spectra were collected at 90° to the excitation over a range of 305 nm to 450 nm with 5-nm excitation and emission slits.
For fluorescence intensity and anisotropy measurements, vertically oriented excitation polarizer and was used. For emission, the polarizer was oritented both vertically for the measurement of IVV and horizontally for the measurement of IVH. Isotropic fluorescence intensity at time t, Iiso(t), corresponding to the intensity observed with the polarizer orientation of 54.7° (magic angle) was calculated using
| (1) |
To average out intensity fluctuation (instrumental noise) during measurement, we define normalized cumulative signal intensity Icum as:
| (2) |
which is used as the parameter for monitoring gelation. The Icum value reflects time-dependent tryptophan fluorescence intensity change induced by gelation. Here, λ is the emission wavelength. Iiso(λ, t = 0) is obtained from the emission intensity of individual peptide modules as:
| (3) |
Iiso(λ, positive module) and Iiso(λ, negative module) refer to the tryptophan emission intensity of unmixed positive and negative modules, respectively. The Raman scattering is minimized by using 1 mm thick cuvette. To exclude Rayleigh scattering (significant for the gel form), the averaging is performed in the range from λ1 ( 330 nm) to λ2 ( 395 nm).
The fluorescence anisotropy15 r for vertically polarized excitation light is defined as:
| (4) |
where IVV and IVH are vertically and horizontally polarized fluorescence intensities, respectively; the g-factor corrects for the sensitivity of the fluorescence detection channel (detection optics, monochromator, and detector) to vertically and horizontally polarized light. Fluorescence anisotropy measures the difference in the intensities of vertically and horizontally polarized emission light. Due to photoselection, for an isotropic system excited with linearly (vertically) polarized light, possible values of anisotropy lie within the range from 0.4 to −0.2. For isotropic rigid (frozen) fluorophores with parallel absorption and emission transition moments, the expected anisotropy is close to 0.4. Rotational diffusion reorients the fluorophore dipoles, thus decreasing the observed anisotropy as described by the Perrin equation:15
| (5) |
where r is the observed steady-state anisotropy, r0 is the limiting anisotropy (anisotropy which would be measured in the absence of rotational diffusion), τ is the fluorescence lifetime, and Θ is the rotational correlation time of the chromophore. When rotational diffusion (defined by Θ) of fluorophores is fast compared to its emission lifetime (τ > Θ), the anisotropy approaches zero (IVV = IVH). The aggregation of rapidly diffusing small molecules slows down the rotational diffusion and increases the correlation time (Θ). The result is an increase in the steady-state fluorescence anisotropy r which, in turn, could be used as a relative measure of the size of assembled aggregates. As equation (5) suggests, it is equally important to monitor the fluorescence lifetime τ which also might change upon aggregation.
Again, to alleviate signal fluctuations, the average anisotropy at a given time point of gelation process, <r>, is calculated over the wavelength range as
| (6) |
The wavelength range chosen is the same as for the intensity integration, the averaging takes place over the range from λ1 (330 nm) to λ2 (395 nm).
Time-resolved Fluorescence Measurements and Data Analysis
Time-resolved fluorescence measurements were performed on a FluoTime 200 (PicoQuant) equipped with a Hamamatsu microchannel plate (MCP) providing better than 100 ps resolution for UV LED excitation. The excitation source was a 295 nm LED driven at a 10 MHz repetition rate by a PDL800 driver (PicoQuant) with a pulse width of approximately 500 ps. The emission monochromator was set to 365 nm, with slits fully open (10 nm resolution), and the polarizers were set to magic angle conditions for lifetime measurements, i.e., the excitation polarizer was vertically oriented and the emission polarizer was oriented at 54.7° with respect to the vertical excitation polarizer (magic angle conditions). The time-resolved intensity decay could be written as the sum of exponential components
| (7) |
where αi’s re the normalized emission amplitudes and τi’s are the decay times, Σαi = 1.0. The average emission lifetime, which is the average time the fluorophore remains in the excited state, is given by
| (8) |
For time-resolved anisotropy measurement, a vertically oriented excitation polarizer and both vertical (IVV) and horizontal (IVH) positions for emission polarizer were used. Time-resolved fluorescence data were analyzed using the FluoFit software package (PicoQuant, Ver. 4.0). Intensity decay data were deconvoluted and analyzed by nonlinear regression using a multi-exponential anisotropy decay model.
Small-Angle X-ray Scattering (SAXS)
Sample Preparation
Peptide solutions were prepared as for rheological measurements. The just-mixed sample was loaded into the SAXS instrument as described earlier.13
SAXS Data Measurements and Analysis of Fiber Matrix
SAXS data were acquired and reduced to I(q) versus q using the small-angle X-ray scattering instrument and procedures described earlier.16 q is the amplitude of the scattering vector. The inverse Fourier transform of I(q) gives the pair distance or vector length distribution function, P(R), for the scattering particle and is calculated using indirect Fourier transform methods.17,18,19 The R value at which P(R) goes to 0 gives the maximum linear dimension for the scattering particle, Dmax. The zeroth and second moments of P(R) give the zero-angle scattering intensity (I(0)) and the radius of gyration of the scattering particle (Rg), respectively.
For Guinier analysis of rod-shaped objects, the scattering in the low q region can be approximated as20
| (9) |
where Rc is the average radius of gyration of the cross-section of the particle and Ic(0), again when normalized by protein concentration in mg/mL, is proportional to the average mass per unit length of the rod-shaped object.
To estimate cross-linking density of in hydrogel networks, the Debye-Bueche model was used,21 which is implemented using the Irena SAS macros (ver. 2.35)22 for IGOR Pro 6.0 in the following form:
| (10) |
where lc is the correlation length. The correlation length of a network is a measure of the spatial extent of the cross-linked regions and is equivalent to the average mesh size of the network. The greater the correlation length, the larger the average mesh size, the lesser dense the cross-linking.23
Modeling of the 2D cross-sectional shape used a simulated annealing algorithm24 as described in our earlier publication.13 Briefly, this analysis uses dummy atom models to generate scattering profile which is compared with experimental scattering profile to generate the shape of fiber cross-section.
Results and discussion
Chain Length Effect on Mechanical Properties
Time-sweep rheological measurements at 25°C showed that the EAW6:OAW6 (6:6) pair did not form a gel (Figure 1)—for this pair, the storage modulus, G′, has small magnitude (~1 Pa) and the loss modulus, G″, falls below ~0.1–0.01 Pa which corresponds to torque values below the detection limit of the rheometer. Additionally, we have not observed any visual signs of gelation by the 6:6 pair. In contrast, the other two pairs, EAW10:OAW10 (10:10) and EAW14:OAW14 (14:14), have much higher G′ and G″ values. More importantly, the G′ values of the 10:10 pair and the 14:14 pair are much higher than their G″ values, indicative of a highly elastic gel. Of the 10:10 and 14:14 pairs, the 10:10 pair has a higher plateau G′ value than the 14:14 pair (18 kPa vs. 0.1 kPa). This result clearly shows that for these oligopeptide-based hydrogels, the optimum chain length for mechanical strength is around 10 amino acids.
Figure 1.
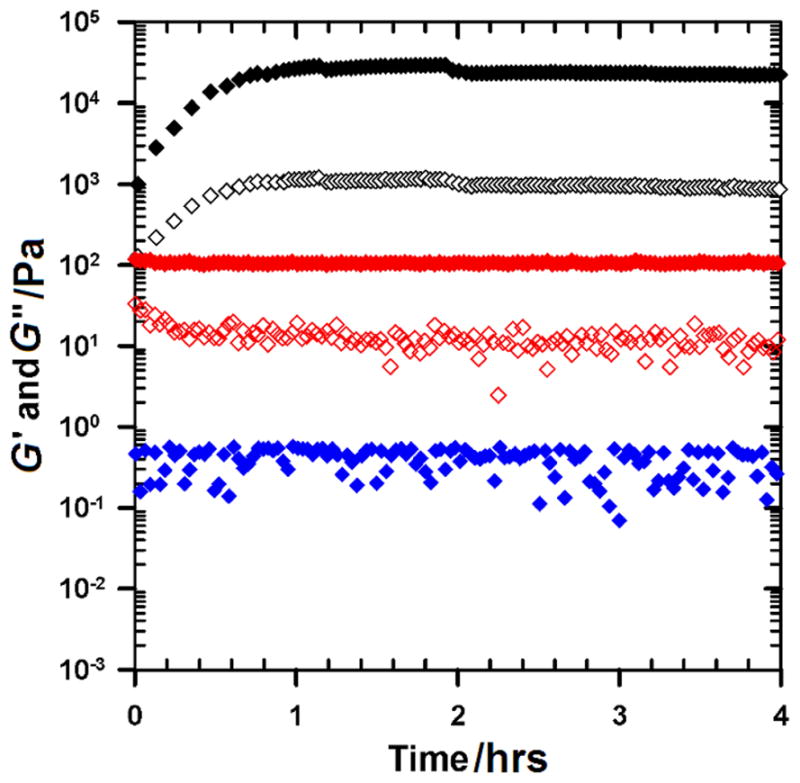
Effect of chain length on the mechanical strength of oligopeptide-based hydrogels. Time-sweep measurements of the EAW6:OAW6 (blue diamonds), EAW10:OAW10 (black diamonds) and EAW14:OAW14 (red diamonds) pairs at 1% wt/wt total peptide concentration. Measurements were conducted at 0.2% strain amplitude and 1 rad/sec angular frequency at 25°C. Closed symbols are storage modulus G′; open symbols are loss modulus G″; data on loss modulus for the EAW6:OAW6 pair are below the detection limit.
Chain Length Effect on Gelation Kinetics
Rheological characterization of the 10:10 and 14:14 pairs reveal that the 10:10 pair took about 1 hr to reach plateau G′ value whereas for the 14:14 pair gelation was instantaneous (Figure 1). Similar kinetics was observed at the molecular level by fluorescence spectroscopy, where the isotropic fluorescence intensity decreased to a steady state in about 1 hr for the 10:10 pair and instantaneously for the 14:14 pair (Figure 2(B) and (D)). Similarly, the average anisotropy for the 14:14 pair increased to ca. 0.1 within 2 min of mixing and then drops back to ca. 0.7 almost instantaneously; whereas for the 10:10 pair, the average anisotropy increased to ca. 0.1 10 min after mixing and then droped back to ca. 0.7 in about 1 hr (Figure 3). SAXS measurements also showed faster gelation kinetics for the 14:14 pair in comparison to the 10:10 pair (Figure 4). When mixed, both peptide pairs result in hydrogels formed by large ordered assemblies with I(q) versus q profiles measured up to 24 hr. The formation of a fibrous network by the 14:14 pair as evidenced by the increasing intensity profile is essentially completed within 1 hr after mixing of the individual peptides while in the case of the 10:10 pair, the gelation is complete within 5 hrs and no significant changes in scattering intensity I(q) were observed up to 24 hrs (cf. Figure 4(A) and (B)).
Figure 2.

Tryptophan fluorescence intensity decay during the co-assembling process of the EAW10:OAW10 (A, B) and EAW14:OAW14 pair (C, D) pairs at 25°C. OAW10, EAW10, OAW14 and EAW14 denote individual peptide solutions. (A) and (C) show fluorescence emission spectra at different time points while (B) and (D) plot the normalized cumulative intensity Icum vs. time. In (B) and (D), the data point at time 0 is the average of the two solutions. The EAW6:OAW6 pair did not show any intensity change till 24 h after mixing (ESI, Figure S1).
Figure 3.

Average anisotropy vs. time profile. Measured at 25°C for the EAW10:OAW10 gel (black) and for the EAW14:OAW14 gel (red).
Figure 4.

Chain length effect on the SAXS data for mixtures of the peptide pairs as a function of time. I(q) vs q during the process of gelation for the EAW10:OAW10 (A) and the EAW14:OAW14 pair (B) (15 min, orange; 1 hour, black; 5 hours, green; 8 hours, red; 24 hours, blue). Insets in (A) and (B) show the comparison of the corresponding scattering profiles after 12 hours (red open circles) and 24 hours (closed blue circles). Guinier plots for elongated particles as ln qI(q) vs q2 after 24 hours: (C) EAW10:OAW10 (black); (D) EAW14:OAW14 (red). Arrows show the roll-over position on Guinier plots: (C) q = 0.0070 Å−1, (D) q = 0.0070 Å−1
Therefore, all three techniques, dynamic rheometry, fluorescence spectroscopy and SAXS, indicate that the 14:14 pair gels faster than the 10:10 pair. The faster gelation of the 14:14 might arise from two contributing factors. First, the 14-mer peptides carry more charges and therefore have a greater attractive force between them, leading to faster gelation. Second, the longer 14-mer peptide might be more prone to coiling than the 10-mer petides, which might lead to faster diffusion and therefore faster gelation.
Chain length effect on the underlying structure
A tryptophan residue has been included at the N-terminus of each peptide sequence in order to monitor the gelation process at the molecular level by observing changes in intrinsic tryptophan fluorescence. The assembly process affects the tryptophan environment and modifies its fluorescence intensity and anisotropy. In full accordance with the visual absence of gelation of the 6:6 peptide pair, both tryptophan emission and anisotropy did not change significantly after 12 hr of mixing of this pair (ESI, Figure S1), in contrast to the evident intensity decrease and anisotropy increase after mixing of the 10:10 and 14:14 pairs (Figure 2 & 3). Similarly, SAXS scattering intensity (I(q)), for the 6:6 pair also did not change significantly 24 hrs after mixing, consistent with rheological measurements (ESI, Figure S3).
The fluorescence emission intensity of tryptophan decreased upon gelation for the 10:10 and 14:14 pairs (Figure 2). Burial of tryptophan into a more hydrophobic environment in the fiber can result in restricted mobility, thereby decreasing solvent accessibility and quenching by nearby amino acids.15 The overall decrease in normalized cumulative fluorescence intensity during the gelation process is greater for the 10:10 pair (~80%) than for the 14:14 pair (~20%) (Figure 2). This result points to significant difference in the tryptophan environment in these two gels. The decrease in the fluorescence emission intensity is a rather surprising result. One would expect that burying tryptophan residue between the polypeptide chains shields the water access and therefore should increase the overall intensity.
Steady-state anisotropy of the tryptophan of the 10:10 and 14:14 pairs increased upon gelation, indicative of peptides incorporation into larger assemblies (Figure 3 and ESI, Figure S2). However, after completion of gelation, there was no significant difference in the equilibrium, steady-state tryptophan anisotropy between the 10:10 and 14:14 pairs. This result indicates that in both cases the formed complex is rather large and only local mobility of the N-terminal tryptophan contributes to signal depolarization.
As indicated by eq. (5), the steady-state anisotropy depends on the ratio of fluorescence lifetime (τ) and rotational correlation time (Θ). Proper interpretation of the anisotropy changes should take into account gelation-induced change of tryptophan fluorescence lifetime. Time-resolved fluorescence measurements show two dominant τ components (Table 2) for solutions and gels. In the gel, τ values are significantly longer. The time-resolved data are consistent with the expectation that burying the tryptophan residue between closely packed peptide chains in the gel state reduces the water access and stabilizes excited state, therebyleading to longer τ.
Table 2.
Fluorescence emission lifetimes τ, rotational correlation times Θ from time-resolved anisotropy measurements a
| Sample | τ (ns) | Θ (ns) |
|---|---|---|
| EAW10:OAW10 gel | 0.222± 0.02 (32.6%) | |
| 1.252 (73.4 %) 4.031 (26.6 %) |
0.389± 0.03 (33.1%) | |
| > 50 (34.3%) | ||
|
| ||
| EAW14:OAW14 gel | 0.248 ± 0.02 (38.0%) | |
| 1.237 (69.8 %) 3.967 (30.2 %) |
0.563 ± 0.03 (45.1%) | |
| > 50 (16.9%) | ||
|
| ||
| OAW10 Solution | 0.532 ± 0.04 (44.5%) | |
| 0.881 (55.1 %) 1.606 (44.9 %) |
2.243 ± 0.20 (52.0%) | |
| 11 ± 3.6 (3.5%) | ||
|
| ||
| EAW10 Solution | 0.633 ± 0.04 (43.8%) | |
| 0.932 (56.8 %) 1.847 (43.2 %) |
2.287 ± 0.2 (52.9%) | |
| 11 ± 3.6 (3.3%) | ||
|
| ||
| OAW14 Solution | 0.425 ± 0.03 (73.4%) | |
| 0.939 (43.3 %) 1.678 (56.7 %) |
6.847 ± 0.3 (8.3%) | |
| 12 ± 5.2 (18.3%) | ||
|
| ||
| EAW14 Solution | 0.466 ± 0.03 (63.5%) | |
| 1.010 (47.8 %) 1.947 (52.2 %) |
11.8 ± 5.2 (20.9%) | |
| 22 ± 7.5 (15.6%) | ||
All lifetime measurements were performed at 25°C; τ is the average lifetime of the tryptophan fluorescence; Θ is the rotational correlation time from time-resolved anisotropy measurements. In gels, the component with the longest Θ value (> 50 ns) is very poorly defined because the fluorescence lifetime τ is much shorter than 50 ns. The percentage numbers in the parentheses mean the relative contributions of each individual component.
The increase of τ upon gelation should be accompanied by an increase of fluorescence intensity, but the opposite effect has been observed (Figure 2). This unusual behavior can be explained by the presence of significant static quenching of tryptophan in the gelled state, probably by neighboring amino acids from associated chains. As a result of gelation, a significant fraction of tryptophan residues come in close contact with other amino acids that quench the excited tryptophans.15 The greater static quenching of the excited tryptophan residues in the 10:10 gel (Figure 2) is indicative of tighter side chain packing than in the 14:14 gel, and fully conforms to the observation of much greater mechanical strength of the 10:10 gel (Figure 1).
Time-resolved anisotropy studies provide further information on tryptophan mobility in solution and hydrogel. Trytophan anisotropy in the 10:10 gel is very different from that in the 10-mer solution: within the life-time of tryptophan fluorescence, its anisotropy in the gel leveled off at ~0.08 while that in the solution approached zero (Figure 5a). In contrast, tryptophan anisotropy in the 14:14 gel shows very insignificant difference from the 14-mer solution: within the life-time of trytophan fluorescence, its anisotropy in both the gel and the solution approached zero (Figure 5b). The residual anisotropy in the 10:10 gel is indicative of a more restricted surrounding for tryptophan, consistent with tigher packing revealed by emission intensity measurement.
Figure 5.

Time-resolved anisotropy decays in solution and in the gel. (A) Comparison of the EAW10 solution (purple circles) and the EAW10:OAW10 gel (black circles) at 25°C. (B) Comparison of OAW14 solution (purple circles) and the EAW14:OAW14 gel (red circles) at 25°C. Solid lines represent the data fit used to extract the values of rotational correlation time shown in Table 2.
The time-resolve anisotropy decay can be decomposed into three components characterized by three different rotational correlation times Θ: two fast components with Θ on the order of 10−10 s and 10−9 s and one slow component with Θ on the order of 10−8 s (Table 2). Here, a clear trend can be observed: for the two fast components, the order is: 10:10 gel < 14:14 gel < 14-mer solutions < 10-mer solutions; for the slow component, the order is: 10:10 gel ≈ 14:14 gel > 14-mer solutions > 10-mer solutions; the percentage of the slow component has this order: 10:10 gel > 14:14 gel ≈ 14-mer solutions > 10-mer solutions. Therefore, compared to solutions, the two fast components become faster and the slow component become slower in gels. Moreover, the percentage of the slow component becomes larger in gels. Of the two gels, the two fast components are faster in the 10:10 gel and the percentage of the slow component is larger in the 10:10 gel. The two fast components in the gel reflect local tryptophan motion and segmental mobility while the slow component is due to large peptide aggregation and immobilization. Thereore, these results indicate that the motion of tryptophan is more restricted in the gel than in the solution and, of the two gels, more restricted in the 10:10 gel than in the 14:14 gel. This same can be said about overall peptide tumbling. In terms of peptide aggregation and immobilization, the percentage of the slow component indicate that its extent is larger in gels than in solutions and, of the two gels, larger in the 10:10 gel than in the 14:14 gel. These conclusions are entirely consistent with tigher packing of tryptophan in the 10:10 than in the 14:14 gel and consistent with the 10:10 gel having higher mechanical strength.
In summary, the 10:10 gel and the 14:14 gel have similar steady state anisotropy value (Figure 3) and similar tryptophan life time (Table 2), but the 10:10 gel has much lower tryptopham emission intensity (Figure 2) and its rotational correlation time has much higher percentage of components with longer Θ values (> 50 ns) (Table 2). These differences in fluorescence characteristics suggest that the 10:10 gel is more densely packed as compared to the 14:14 gel, and these conclusions at the molecular level are in agreement with stronger bulk mechanical strength of the 10:10 gel observed by dynamic rheometry.
To characterize hydrogels at the individual fiber level, we used SAXS to determine the shape and the dimension of the underlying fibers. Guinier plots of ln qI(q) versus q2 for the 10:10 and 14:14 pairs after 24 hr (Figure 4(C) and (D)) were linear in the loq q2 region with a sharp roll-over at q2 = 4.9×10⁻⁵ Å−2 suggesting that both gels are formed by elongated rod-like particles of finite length.20 Such roll-over is characteristic for highly asymmetric particles, e.g., a fiber whose length is much greater than its cross-sectional radius. The decrease of scattering intensity at the roll-over point is observed for values q < 5/(A·d), where A is the aspect ratio, A = L/d, L is the length of the rod-like particle and d is the diameter of the rod-like particle. Thus, the drop in scattering intensity is observed at q < 5/L, and this roll-over point is at 0.0070 Å−1 for the both the 10:10 and the 14:14 gels (Figure 4(C) and (D)). P(R) calculations (not shown) for the scattering data of the 10:10 and the 14:14 gels suggested that the lengths of these rods exceed the limits of precise measurement for our data which are limited to a minimum measurable q value of 0.006 Å−1 which means that length scales Dmax ≥ 600 Å (Dmax < π/qmin; Dmax ~ 600 Å)25 cannot be reliably determined. We therefore turned to analysis of the data in terms of cross-sectional parameters.
A two-dimensional (2D) dummy atom modeling routine was employed to determine an average shape of the cross-sectional area of the fiber. Figure 6 shows examples of 2D models that fit the data (with χ2 < 1), while their associated Pc(R) are shown in Figure 7.24 While the details of the shapes shown in Figure 6 are not uniquely determined by the scattering data, the Pc(R) profiles and derived structural parameters (such as the dimensional characteristics of the cross-section) are. Figure 6 is provided merely as an aid to visualizing the general features of the shapes that are defined by the data. The cross-sections of the both 10:10 and 14:14 gels have quite similar complex shapes that are also reflected in the similarity in their Pc(R) functions (Figure 7). This structural similarity of the fiber cross-sections is also corroborated by the values of the radii of gyration of the cross-section, Rc, calculated as a second moment of Pc(R) functions (Figure 7). Both 10:10 and 14:14 gels have almost identical Rc values, 164.4 Å and 164.8 Å, respectively.
Figure 6.

Cross-sectional model for of the fibers formed by (A) the EAW10:OAW10 pair, (B) the EAW14:OAW14 pair that fit the scattering data.
Figure 7.

Pair-wise distance distribution function (Pc(R)) of the average cross-sectional area for elongated fiber-like structures of the EAW10:OAW10 hydrogel (black) and the EAW14:OAW14 hydrogel (red). (Data are on a relative scale and the area under the curves is proportional to the Ic(0) values which are in turn proportional to the mass-per-unit length of the fiber).
Also, SAXS data for both 10:10 and 14:14 gels could be used to estimate the correlation length, lc, which in a gel system characterizes the extent of the cross-linking network and reflects the network mesh size. Application of the Debye-Bueche approach21 to calculate the correlation length have shown that both 10:10 and 14:14 gels have very close lc values, 65.4 Å and 65.7 Å, respectively.
In summary, the comparative analysis of cross-sectional parameters of the SAXS data for the 10:10 and the 14:14 gels has not revealed any marked differences between the cross-sections of the underlying peptide fibers in these two gels. Even though the two fibers have similar cross-sectional parameters, fluorescence studies have shown that amino acid side chains pack more tightly in the 10:10 gel fibers. Because the length of the fibers exceeds the detection limit of our SAXS instrument, we do not know whether these two gels have fibers of different lengths. Therefore, whether the higher elastic modulus of the 10:10 gel is entirely due to side chain packing or due to a combination of tighter side chain packing and longer fiber length is not clear at this time.
Caplan et. al., studied the effect of chain-length on the hydrogelation of self-complementary oligopeptides and found a bi-phasic response, i.e., a 500% increase in G′ was observed when the chain length of the oligopeptide was increased from 8 to 12 amino acid residues, but a further increase in chain length from 12 to 16 residues caused a decrease in G′ values, suggesting the existence of optimal chain length for the formation of mechanically strong hydrogel.26,27 A similar chain length effect has been observed in several of the prion proteins where only 8–12 amino acids were found to be involved in the formation of cross-β structure of amyloid fibers. Proteins with chain length longer than 12 residues folds back on to itself to maintain this structural constraint in amyloid fibers.28 Most recently, using molecular dynamic simulations, it was concluded that the optimal chain length for mechanical robustness in β-sheet crystals is around 8–10 amino acid residues.29 Thus, our results are in line with other reports26,27 that for peptide based fibrillar β-sheet assemblies, there appears to be an optimal chain length which is around 10 amino acid residues. The exact origin of this optimal chain length awaits further studies. One possible reason for the existence of an optimal chain length is the balance between enthalpy gain from forming β-sheet and the entropy cost in forming straight β strands.
Conclusions
Rheological, SAXS and fluorescence studies on the gelation of mutually-attractive, self-repulsive peptide pairs at 1% wt/wt total peptide concentration demonstrates that the optimal peptide chain length for mechanil strength is around 10 amino acids. The 6-mer peptides do not form hydrogels while the 14-mer peptides form a much weaker gel. Despite an evident morphological similarity between the cross-sections of the individual fibers in the 10:10 and 14:14 gels observed by SAXS, fluorescence spectroscopy data suggest that amino acid side chains in the 10:10 fibers are more tightly packed than in the 14:14 fibers. Therefore, of the three pairs of oligopeptides, the 10:10 pair demonstrates the highest plateau elastic modulus value, although its gelation is not the fastest. This contrast between mechanical stregnth and assembly kinetics awaits further investigation.
Supplementary Material
Acknowledgments
This work is supported by National Institutes of Health under grant EB004416 (Y.B.Y.) and by a U. S. Department of Energy, Office of Science Grant No. DE-FG02-05ER64026 (J.T.). The authors thank Kavita M. Gupta for her help with the operation of AR 550 stress-controlled rheometer.
Footnotes
Electronic Supplementary Information (ESI) available: Additional fluorescence intensity and anisotropy data and scattering profiles for EAW6:OAW6. EAW10:OAW10, and EAW14:OAW14 pairs. See DOI: 10.1039/b000000x/
Contributor Information
Marc B. Taraban, Email: mtaraban@umd.edu.
Sivakumar Ramachandran, Email: sivakumar.ramachandran@gmail.com.
Ignacy Gryczynski, Email: IgnacyGryczynski@unthsc.edu.
Zygmunt Gryczynski, Email: ZygmuntGrczynski@unthsc.edu, ZGryczynski@TCU.edu.
Jill Trewhella, Email: j.trewhella@usyd.edu.au.
Yihua Bruce Yu, Email: byu@rx.umaryland.edu.
Notes and references
- 1.Kopecek J. Nature. 2002;417:388–389. doi: 10.1038/417388a. [DOI] [PubMed] [Google Scholar]
- 2.Deming TJ. Soft Matter. 2005;1:28–35. doi: 10.1039/b500307e. [DOI] [PubMed] [Google Scholar]
- 3.Holland TA, Tabata Y, Mikos AG. J Control Rel. 2005;101:111–125. doi: 10.1016/j.jconrel.2004.07.004. [DOI] [PubMed] [Google Scholar]
- 4.Nagai Y, Unsworth LD, Koutsopolous S, Zhang S. J Control Rel. 2006;115:18–25. doi: 10.1016/j.jconrel.2006.06.031. [DOI] [PubMed] [Google Scholar]
- 5.Haines-Butterick L, Rajagopal K, Branco M, Salick D, Rughani R, Pilarz M, Lamm M, Pochan D, Schneider J. Proc Natl Acad Sci USA. 2007;104:7791–7796. doi: 10.1073/pnas.0701980104. [DOI] [PMC free article] [PubMed] [Google Scholar]
- 6.Jayawarna V, Ali M, Aline TA, Saiani A, Gough JE, Ulijin RV. Adv Mater. 2006;18:611–614. [Google Scholar]
- 7.Zhang S, Holmes T, Lockshin C, Rich A. Proc Natl Acad Sci USA. 1993;90:3334–3338. doi: 10.1073/pnas.90.8.3334. [DOI] [PMC free article] [PubMed] [Google Scholar]
- 8.Ramachandran S, Tseng Y, Yu YB. Biomacromolecules. 2005;6:1316–1321. doi: 10.1021/bm049284w. [DOI] [PMC free article] [PubMed] [Google Scholar]
- 9.Ramachandran S, Flynn PF, Tseng Y, Yu YB. Chem Mater. 2005;17:6583–6588. [Google Scholar]
- 10.Ramachandran S, Trewhella J, Tseng Y, Yu YB. Chem Mater. 2006;18:6157–6162. [Google Scholar]
- 11.Whitesides GM, Grzybowski B. Science. 2002;295:2418–2421. doi: 10.1126/science.1070821. [DOI] [PubMed] [Google Scholar]
- 12.Chan WC, White PD. Fmoc Solid Phase Peptide Synthesis: A Practical Approach. Oxford University Press; New York: 2000. pp. 1–75. [Google Scholar]
- 13.Ramachandran S, Taraban MB, Trewhella J, Gryczynski I, Gryczynski Z, Yu YB. Biomacromolecules. 2010;11:1502–1506. doi: 10.1021/bm100138m. [DOI] [PMC free article] [PubMed] [Google Scholar]
- 14.Gill SC, von Hippel PH. Analyt Biochem. 1989;182:319–326. doi: 10.1016/0003-2697(89)90602-7. [DOI] [PubMed] [Google Scholar]
- 15.Lakowicz JR. Principles of Fluorescence Spectroscopy. 3. ch 16 Springer; New York: 2006. [Google Scholar]
- 16.Heidorn DB, Trewhella J. Biochemistry. 1988;27:909–915. doi: 10.1021/bi00403a011. [DOI] [PubMed] [Google Scholar]
- 17.Svergun DI, Semenyuk AV, Feigin LA. Acta Cryst. 1988;A44:244–250. [Google Scholar]
- 18.Svergun DI. J Appl Cryst. 1991;24:485–492. [Google Scholar]
- 19.Svergun DI. J Appl Cryst. 1992;25:495–503. [Google Scholar]
- 20.Guinier A. Ann Phys (Paris) 1939;12:161. [Google Scholar]
- 21.Debye P, Bueche AM. J Appl Phys. 1949;20:518. [Google Scholar]
- 22.Ilavsky J, Jemian PR. J Appl Cryst. 2009;42:347. doi: 10.1107/S160057671800643X. [DOI] [PMC free article] [PubMed] [Google Scholar]
- 23.Soni VK, Stein RS. Macromolecules. 1990;23:5257. [Google Scholar]
- 24.Whitten AE, Jeffries CM, Harris SP, Trewhella J. Proc Natl Acad Sci USA. 2008;105:18360–18365. doi: 10.1073/pnas.0808903105. [DOI] [PMC free article] [PubMed] [Google Scholar]
- 25.Glatter O. In: Small Angle X-Ray Scattering. Glatter O, Kratky O, editors. ch 4 Academic Press; London: 1982. [Google Scholar]
- 26.Caplan MR, Schwartzfarb EM, Zhang S, Kamm RD, Lauffenberger DA. J Biomater Sci Polymer Edn. 2002;13:225–236. doi: 10.1163/156856202320176493. [DOI] [PubMed] [Google Scholar]
- 27.Caplan MR, Schwartzfarb EM, Zhang S, Kamm RD, Lauffenberger DA. Biomaterials. 2002;23:219–227. doi: 10.1016/s0142-9612(01)00099-0. [DOI] [PubMed] [Google Scholar]
- 28.Sunde M, Serpell LC, Bartlam M, Fraser PE, Pepys MB, Blake CC. J Mol Biol. 1997;273:729–739. doi: 10.1006/jmbi.1997.1348. [DOI] [PubMed] [Google Scholar]
- 29.Xiao S, Stacklies W, Debes C, Gräter F. Soft Matter. 2010 doi: 10.1039/c0sm00510j. [DOI] [Google Scholar]
Associated Data
This section collects any data citations, data availability statements, or supplementary materials included in this article.