Abstract
It is found that the NMR relaxation rates of diffusants in peptide hydrogels have a linear dependency on the shear modulus of the hydrogels. This finding opens the door for non-invasive and forceless mechanical characterizations of materials and tissues using NMR and MRI.
Unlike optical spectroscopy where spontaneous and stimulated emissions make significant contributions to the relaxation of excited states, the relaxation of nuclear spins is entirely due to interactions with the surroundings.1 Therefore, it is natural to speculate that nuclear spin relaxation rates might have a dependency on the bulk material properties of the surrounding media. Such a relationship is valuable because it enables non-invasive evaluation of material properties using magnetic resonance techniques, such as NMR or MRI. Here, we report a surprisingly simple linear relationship between nuclear spin relaxation rates and shear modulus in hydrogels.
Hydrogels are viscoelastic materials with many natural (e.g., collagen) and manmade (e.g., contact lenses) examples. The mechanical properties of hydrogels are characterized by the elastic modulus G′ and viscous modulus G″, which together give the shear modulus G as G = (G′2 + G″2)½.2 We have previously developed a class of shear-responsive peptide hydrogels by pairing oppositely charged oligopeptides.3
A pair of oppositely charged decapeptides, EAW10 and OAW10 (Table 1), is used to form hydrogels. The peptides were chemically synthesized by standard solid-phase Fmoc-protocol.4 10 mM solution of each peptide was prepared in phosphate-buffered saline (PBS) at pH 7.0. Gelation was initiated by mixing the two peptide solutions at either 5°C or 25°C. Gelation was monitored by NMR spectroscopy and dynamic rheometry. After the gelation reached plateau, the 25°C gel was cooled to 5°C (the resulting gel is denoted as the 25°C → 5°C gel) and the 5°C gel was heated to 25°C (the resulting gel is denoted as the 5°C → 25°C gel). In this work, temperature and temperature switch were used to obtain hydrogels of different mechanical strength.
Table 1.
Sequences and molecular weights (M.W.) of a pair of oppositely charged decapeptides EAW10 and OAW10.a
| peptides | sequences | M.W. (Da) |
|---|---|---|
| EAW10 | formyl-EFEAEAEAEW-amide | 1,237.2 |
| OAW10 | formyl-OFOAOAOAOW-amide | 1,162.3 |
A, alanine; E, glutamic acid; F, phenylalanine; O, ornithine; W, tryptophan. The N- and C-termini of each peptide were formylated (formyl-) and amidated (-amide), respectively.
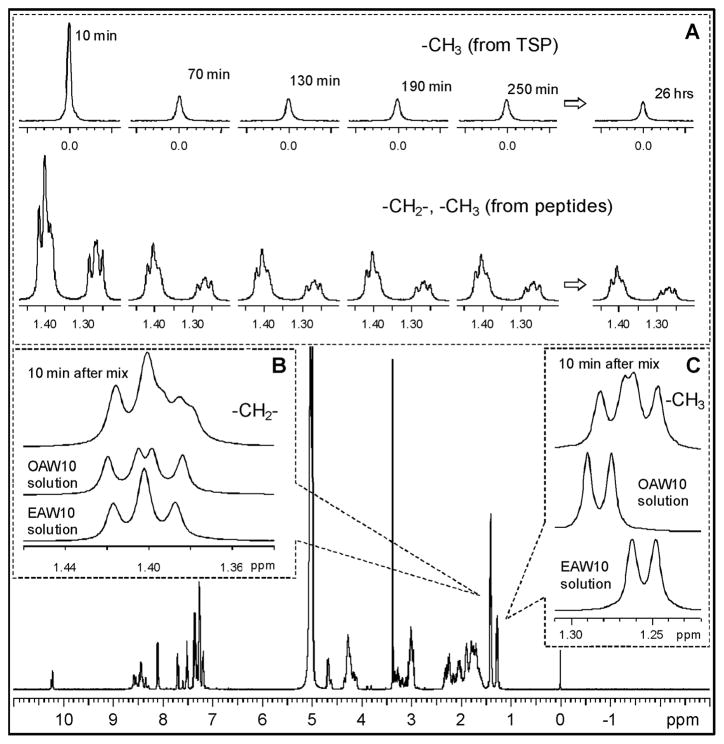
Figure 1 shows a representative 1D 1H spectrum of the hydrogel, which was taken 10 min after mixing the two peptide solutions. The 1H signal intensity decreases as gelation proceeds (inset A, Fig. 1). This is because signals from gelled peptides are too broad to be observed. Therefore, the 1H signal intensity is proportional to the concentration of mobile peptides that have not been incorporated into the hydrogel matrix.
Fig. 1.
1H NMR spectrum of a hydrogel at 5°C (10 min after mixing). (A) Signal intensity decay during gelation. (B) -CH2- and (C) -CH3 proton signals from the peptides. TSP (3-(trimethylsilyl)-2,2′,3,3′-tetradeuteropropionic sodium) is an NMR chemical shift standard added to each peptide solution.
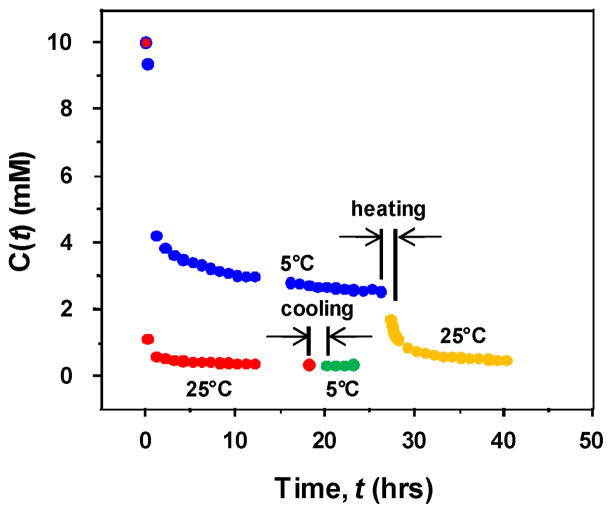
The 1H signal centered at 1.27 ppm comes from the -CH3 groups in both peptides and is used to obtain gelation kinetic data. Its intensity, I(1H), is proportional to the total concentration of mobile peptides. Figure 2 plots the total mobile peptide concentration, which is obtained from I(1H) with the boundary condition that at time 0, the total peptide concentration is 10 mM.
Fig. 2.
Concentration of mobile unincorporated peptide vs. time. The first data point (red dot with blue outline) represents the initial total peptide concentration (10 mM) at both 25°C and 5°C.
In order to investigate the kinetics of gelation, we use a bimolecular reaction model to describe this process:
| (1) |
At t = 0, the total peptide concentration is C0 (= 10 mM). At time t, the concentration of unincorporated mobile peptide is C(t) (the concentration of each unincorporated module is 0.5C(t) due to the 1:1 molar ratio of the two peptides). Assuming at large t, a portion of each peptide, the concentration of which is 0.5Cmobile, remains unincorporated and hence still contributes to the NMR signal intensity. Cmobile is a constant under a given gelation condition (C0 ≥ Cmobile ≥ 0). Then,
| (2) |
The solution of Eqn. (2) gives:
| (3) |
At large t, C(t) = Cmobile. The amount of peptides (in mM) that is eventually incorporated into the hydrogel matrix is C0 – Cmobile. Fitting the experimental data in Figure 2 to Eqn. (3), keff and Cmobile can be obtained for each gelation process and the results are listed in Table 2.
Table 2.
Gelation kinetics parameters from a bimolecular reaction model.
| Samples | keff (mM−1·s−1)a | Cmobile (mM)b | Cimmobile (mM)c | R2 |
|---|---|---|---|---|
| 5°C gel | 0.8 | 2.5 | 7.5 | 0.971 |
| 5°C → 25°C gel | -- | 0.5 | 9.5 | -- |
| 25°C gel | 24.5 | 0.4 | 9.6 | 0.999 |
| 25°C → 5°C gel | -- | 0.4 | 9.6 | -- |
For the 5°C gel and the 25°C gel, fitting Eqn. (3) gives keff and Cmobile. R2 is the goodness of fitting.
For the 5°C → 25°C gel and the 25° → 5°C gel, Cmobile is the last C(t) value collected from each gel.
Cimmobile = 10 mM – Cmobile in all cases.
The results show that keff at 25°C is ~30 times as large as keff at 5°C. At 25°C, ~4% (= 0.4/10) of peptides remain mobile after 18 hr of gelation; at 5°C, ~25% (= 2.5/10) of peptides remain mobile after 26 hr of gelation. Thus, at 25°C, gelation is not only faster, but also has more peptides incorporated into the hydrogel matrix. When the 5°C gel is heated to 25°C, more peptides are immobilized into the hydrogel matrix (~20%). In contrast, when the 25°C gel is cooled to 5°C, no peptides are released from the hydrogel matrix (Fig. 2). This asymmetry between heating and cooling indicates these hydrogels are not equilibrium systems.
Diffusion coefficients of the peptides in solutions and in gels were measured by NMR spectroscopy using the 1H signals from - CH3 and -CH2- groups (Table 3). In all gels, unincorporated peptides in hydrogels have the same diffusion coefficients as peptides in solutions. The results suggest that unincorporated peptides in hydrogels do not form clusters and can diffuse freely.
Table 3.
Diffusion coefficients D, relaxation times, T1 and T2, of peptides in solutions and in hydrogels.a
| Temperature | Sample | D (10−10 m2·s−1) | T1 (ms) | T2 (ms) |
|---|---|---|---|---|
| 5°C | EAW10 solution | 0.63 | 368.4 | 178.1 |
| OAW10 solution | 0.61 | 361.1 | 175.2 | |
| 5°C gel | 0.64 (0.02) | 242.8 (7.1) | 111.1 (3.1) | |
| 25°C → 5°C gel | 0.66 (0.16)b | 125.4 (3.3) | 29.8 (1.3) | |
|
| ||||
| 25°C | EAW10 solution | 0.98 | 445.2 | 274.3 |
| OAW10 solution | 1.03 | 452.6 | 274.2 | |
| 25°C gel | 1.08 (0.13)b | 148.2 (3.1) | 42.3 (3.2) | |
| 5°C → 25°C gel | 1.28 (0.13)b | 204.1 (5.1) | 91.4 (2.4) | |
For hydrogels, the numbers represent the average value and standard deviation (in parentheses), which is based on 10 data points except that for the 25°C → 5°C gel, which is based on 4 data points. The D, T1 and T2 values were obtained from the 1H signal of the -CH3 groups in peptides. Using the 1H signal from the -CH2- groups in peptides, very similar D values are obtained: D(5°C gel) = 0.61±0.01; D(25°C → 5°C gel) = 0.62±0.12; D(25°C gel) = 1.07±0.12; D(5°C → 25°C gel) = 1.14±0.04, all in 10−10 m2·s−1. However, -CH2- groups give T1 and T2 values different from -CH3 groups, as shown in Fig. 4.
As a result of gelation, these NMR spectra had a poor signal to noise ratio, and leads a bigger standard deviation consequently.
The longitudinal and transverse relaxation times, T1 and T2, of the peptides were also measured by NMR spectroscopy (Table 3). Relaxation times satisfy the following relationship (i = 1 or 2):
| (4) |
In solutions, relaxation times increase with temperature because peptides move faster at 25°C, their correlation times shorten, and hence they have longer relaxation times, i.e., Ti(25°C sol) > Ti(5°C sol). In hydrogels, the mobile peptides interact with the hydrogel matrix and their relaxation times were shortened, i.e., Ti(sol) > Ti(gel) in all cases, regardless of temperature. Such shortening has no direct correlation with temperature and depends on gelation history. For example, Ti(5°C gel) > Ti(25°C → 5°C gel) even though the two gels have the same temperature but different history. Similarly, Ti(5°C → 25°C gel) > Ti(25°C gel). Thus, gelation-induced relaxation enhancement is not a temperature effect. In fact, Ti(5°C gel) > Ti(25°C gel), the opposite from what one would expect from a pure temperature effect.
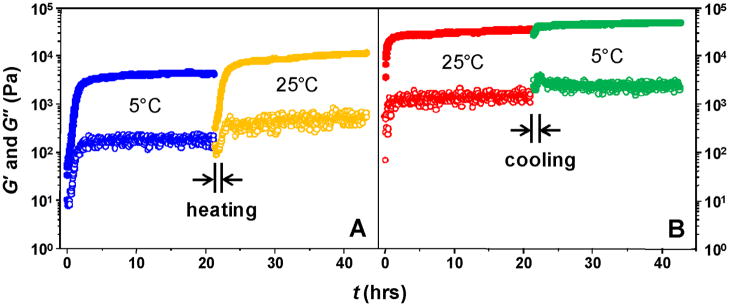
Gelation was also monitored by dynamic rheometry, which gives the elastic (G′), viscous (G″) and shear (G) moduli of the hydrogels (Fig. 3).
Fig. 3.
Gelation process monitored by dynamic rheometry. Solid circles: elastic modulus, G′; open circles, viscous modulus, G″. Blue: gelation at 5°C; orange: temperature switch, 5°C → 25°C; red: gelation at 25°C; green: temperature switch, 25°C→5°C.
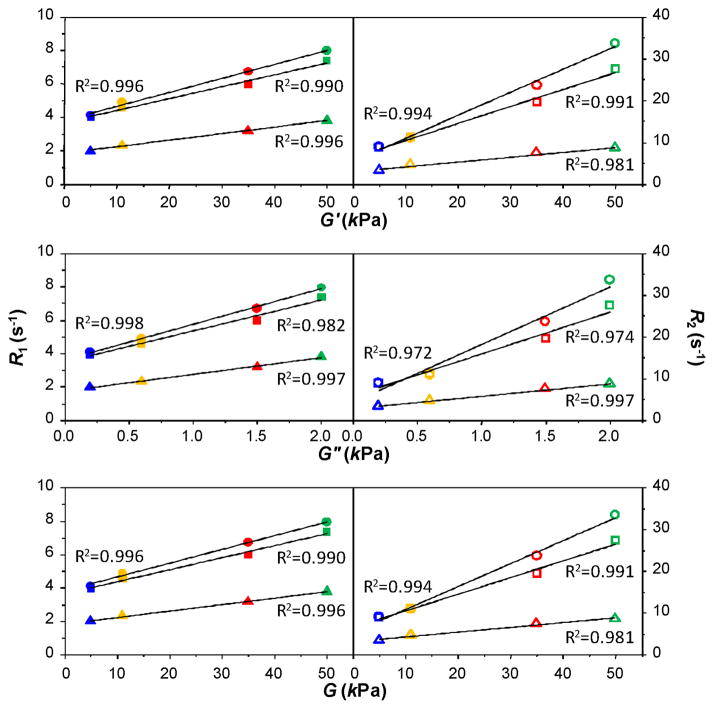
To explore the relationship between NMR relaxation rates (R1 and R2) and mechanical properties of the hydrogels, R1 and R2 of the diffusants (unincorporated peptides and TSP) were plotted vs. G′, G″ and G. A linear relationship was observed in all cases (Fig. 4). As explained above, this linear relationship is not the result of temperature effect.
Fig. 4.
NMR relaxation rates (R1 & R2) of three diffusant groups vs. elastic (G′), viscous (G″) and shear (G) moduli of hydrogels. Circle: -CH3 of peptides; square: -CH2- of peptides; triangle: -CH3 of TSP. Blue: 5°C gel; orange: 5°C→25°C gel; red: 25°C gel; green: 25°C→ 5°C gel. Solid symbols: longitudinal relaxation rates; hollow symbols: transverse relaxation rates. R1 and R2 values are taken from the plateau regions in Fig. 2 while G′, G″ and G values are taken from the plateau regions in Fig. 3. R2 is the goodness of linear fitting.
The relaxation enhancement caused by G (or G′, G″):
| (5) |
parallels the paramagnetic relaxation enhancement caused by paramagnetic ions:5
| (6) |
where C is the concentration of paramagnetic ions. Hence, Eqn. 5. amounts to an “elastic relaxation enhancement”. As ri is called the paramagnetic relaxivity (in M−1·s−1), bi can be called the elastic relaxivity (in Pa−1·s−1). Analogous to r2 > r1,5 b2 > b1 for all three proton groups (Fig. 4.). Whether this parallel between elasticity and paramagnetism goes beyond spin dynamics remains to be seen.
According to the classic BPP (Bloembergen-Purcell-Pound) theory of NMR relaxation in solutions,6 NMR relaxation rate Ri is linearly dependent on the correlation time τc of a molecule; and as it has been shown by Hill that the rotational component of τr has a linear dependency on the viscosity of the solution.7, 8 However, how this translates into a linear dependency of Ri on G′, G″ and G in hydrogels remains to be clarified. Nonetheless, we speculate that the slope of this linear dependency, bi, reflects the strength of the interaction between the diffusants and the hydrogel matrix. This speculation is supported by the observation that bi for the NMR standard TSP is much lower than bi for the peptides, which are components of the hydrogel matrix.
The fact that -CH3 and -CH2- groups have different bi values suggests that different parts of the peptides interact differently with the hydrogel matrix. Measuring the bi values of different amino acid residues along the peptide chain provides a potential method to map the interaction between peptides and the hydrogel matrix.
This surprising finding points to the possibility of non-invasive and forceless mechanical characterizations of materials and tissues using NMR or MRI. Of particular interest is water relaxation in soft tissues for its diagnostic value. Spin relaxivity-based mechanical characterization combines the advantages of magnetic resonance elastography9 and rheo-NMR,10 which are non-invasive, and passive microrheology,11 which is forceless. It would require the collection and proper interpretation of the so-called relaxometry map.12
Supplementary Material
Footnotes
Electronic Supplementary Information (ESI) available: peptide synthesis, purification and characterization, detail of NMR and rheology experiments. See DOI: 10.1039/b000000x/
References
- 1.Cavanagh J, Fairbrother WJ, Palmer AG, Skelton NJ. Protein NMR Spectroscopy: Principles and Practice. Academic Press; San Diego: 1996. [Google Scholar]
- 2.Morrison FA. Understanding Rheology. Oxford University Press; New York: 2001. [Google Scholar]
- 3.Ramachandran S, Tseng Y, Yu YB. Biomacromolecules. 2005;6:1316. doi: 10.1021/bm049284w. [DOI] [PMC free article] [PubMed] [Google Scholar]
- 4.Chan WC, White PD. Fmoc Solid Phase Peptide Synthesis: A Practical Approach. Oxford University Press; New York: 2000. [Google Scholar]
- 5.Caravan P, Ellison JJ, McMurry TJ, Lauffer RB. Chem Rev. 1999;99:2293. doi: 10.1021/cr980440x. [DOI] [PubMed] [Google Scholar]
- 6.Bloembergen N, Purcell EM, Pound RV. Phys Rev. 1948;73:679. [Google Scholar]
- 7.Hill NE. Proc Phys Soc B. 1954;67:149. [Google Scholar]
- 8.Hill NE. Proc Phys Soc B. 1955;68:209. [Google Scholar]
- 9.Muthupillai R, Lomas DJ, Rossman PJ, Greenleaf JF, Manduca A, Ehman RL. Science. 1995;269:1854. doi: 10.1126/science.7569924. [DOI] [PubMed] [Google Scholar]
- 10.Callaghan PT. Rep Prog Phys. 1999;62:599. [Google Scholar]
- 11.Gardel ML, Valentine MT, Weitz DA. In: Microscale Diagnostic Techniques. Breuer K, editor. Ch 1 Springer Verlag; Berlin: 2005. [Google Scholar]
- 12.Cameiro AAO, Vilela GR, de Araujo DB, Baffa O. Brazilian J Phys. 2006;36:9. [Google Scholar]
Associated Data
This section collects any data citations, data availability statements, or supplementary materials included in this article.


