Abstract
Background
Activated Stat3 is an important mediator of oncogenesis in the colon. To test the hypothesis that select Stat activation and/or the pattern of Stat activation serves as a marker for early neoplastic transformation, we examined the distribution of activated Stat1(pStat1), Stat6(pStat6) and Stat3(pStat3) in colitis along the continuum of inactive disease to colitis-associated cancer.
Methods
Tissue microarrays were constructed using colonoscopy biopsy and surgical specimens from 67 patients with ulcerative colitis or Crohn’s colitis and 11 controls. 111 sets of samples were analyzed representing normal tissue, active disease, low-grade dysplasia, high-grade dysplasia, and colitis-associated cancer. Immunohistochemistry to detect pStat1, pStat6 and pStat3 in colonic epithelial and mucosal immune cells was then correlated with clinical and pathological data (tumor location, histologic type, grade and lymph node involvement).
Results
In 50% of colitis-associated cancer samples, pStat3 was detected prominently in epithelial cells, where it was routinely associated with intense pStat3 staining in surrounding immune cells. Stat3 activation was greater in low-grade tumors than in high-grade ones (P<0.05). pStat6 expression was more common in normal tissues than in colitis-associated cancer (P<0.05). pStat1 was detected in a small subset of immune cells in patients with chronic inactive and active colitis, low and high grade dysplasia, but not in colitis-associated cancer.
Conclusions
pStat3 may be a marker for neoplastic transformation in patients with colitis. A shift from predominant immune cell Stat6 activation to Stat3 activation accompanies the onset of dysplasia with concomitant increased epithelial cell Stat3 activation in a subset of patients.
Keywords: Stat3, Th17, Colitis-associated cancer
Introduction
Patients with inflammatory bowel disease (IBD) are at increased risk of developing colitis-associated cancer (CAC), the leading cause of mortality in this group of patients.1 The incidence of CAC is now thought to be similar among patients with ulcerative colitis (UC) and Crohn’s disease (CD), and is almost three-fold higher than the incidence of sporadic colorectal cancer in the general population.2 Intestinal cancer occurs at an earlier age in patients with IBD, approximately 15 to 20 years before the average age of onset of sporadic colorectal cancer. CAC diverges from the well-characterized adenoma-to-carcinoma sequence of sporadic colorectal cancer and instead is marked by sequential progression of inflammation to dysplasia to adenocarcinoma in the colonic mucosa.3 Leading risk factors for the development of CAC are the duration of colitis, extent and severity of intestinal inflammation, and the presence of other inflammatory conditions, mainly, primary sclerosing cholangitis.2 Currently, there is no way to predict an IBD patient’s risk of developing CAC in their lifetime. The current guidelines for cancer surveillance in this high-risk population are frequent colonoscopies, with multiple biopsies, to detect areas of dysplasia or early cancers.2 Compliance with these recommendations is inconsistent and their efficacy has been called into question.4
Chronic inflammation, a hallmark of IBD, is believed to be important in inciting epithelial cell neoplasia such as CAC, but many of the mechanisms and contributing inflammatory cells remain uncertain.5 Although most of the work on the role of the immune system in carcinogenesis has focused on the innate immune system, the adaptive immune system, particularly T cell responses, under certain conditions, can also promote oncogenesis.6 Stat proteins are a family of transcription factors central to the regulation of adaptive immune responses that are activated by tyrosine phosphorylation when cytokine receptor signaling is triggered. Three qualitatively distinct types of T cell responses may contribute to oncogenesis. Th1 responses are dependent on Stat1 and Stat4 signaling, driven by IL-12 and characterized by IFN-γ production. Th2 responses require Stat5 signaling, are driven by IL-13 and characterized by IL-4 secretion. Th17 responses require Stat3 activation, are driven by IL-23 and characterized by IL-17 production. All three types of T cell responses are found in IBD patients. Th1 responses have been shown to be anti-carcinogenic in several systems. 7,8 Limited data support the role of Th2 responses in oncogenesis, whereas growing data suggest Th17 responses contribute to carcinogenesis, including sporadic CRC.9–13
In patients, CD-associated inflammation is predominantly characterized by a Th1-centered immune response, whereas UC-associated inflammation is characterized by enhanced production of Th2-like cytokines, particularly IL-13 and IL-5.14 Both CD and UC can have high levels of Th17 effector cells and cytokines.15 It is unknown if the types of T cell responses vary over time in IBD and/or if the type of mucosal response can serve as an indicator of oncogenic risk. To begin to address these questions, we designed a study to examine UC and CD tissues along the continuum of inactive disease to CAC for activated Stat1 (pStat1), Stat 6 (pStat6) and Stat3 (pStat3). Our goal was to test the hypothesis that select Stat activation and/or the pattern of Stat activation serves as a marker for early neoplastic transformation leading to CAC.
Materials and Methods
Colorectal Tissue and Tissue Microarray (TMA) Construction
Tissue microarrays were constructed using colonoscopy biopsies and surgical colectomy specimens from patients with IBD or patients with no diagnosis of IBD who underwent a colectomy for other indications. All patients were treated at Johns Hopkins Hospital between 1983–2001.
Tissues were fixed in 10% formalin and embedded in paraffin blocks per standard protocols in the pathology department. Tissues from 67 patients (Table 1) were included in the arrays and the hematoxylin and eosin slides from each clinical case were reviewed by a board-certified pathologist to identify areas of chronic active disease, low-grade dysplasia (LGD), high-grade dysplasia (HGD) and/or CAC. Cores (8mm) were taken from the paraffin blocks in the region of interest and then assembled to create eight TMAs. Between one and 24 cores corresponding to each pathologic diagnosis from an individual patient were used in the TMA construction (median (range))cores per patient): chronic active disease 4 (1–12), LGD 2 (1–9), HGD 3 (1–6), CAC 5 (2–24). Of the normal (control) colon tissues included in the TMAs, nine were obtained from flanking normal colon of patients undergoing colectomies for sporadic colorectal cancer. There were also two samples of areas of the colon that were histologically normal from IBD patients who were represented in the LGD, HGD and/or CAC TMAs.
Table 1.
Pathologic diagnosis.
| Diagnosis | Number of Patients | Number of Cores |
|---|---|---|
| Normal* | 11 | 41 |
| Chronic/Active IBD | 39 | 205 |
| Low Grade Dysplasia | 21 | 67 |
| High Grade Dysplasia | 24 | 66 |
| Colitis-Associated Cancer | 16 | 109 |
| Total | 67 ** | 447 |
Normal patients: Unaffected areas of colon from 2 patients with a history of colitis and 9 patients with sporadic colon cancer
Individual patients had more than one histology detected (UC N=37 patients, CD N=27 patients, Indeterminate Colitis N=3 patients)
Patient Data
The clinical diagnosis for each patient (UC or CD), and, for patients with CAC, the tumor location and presence of involved lymph nodes, were determined after review of the clinical and pathology reports. The histologic features (e.g., grade and the presence of mucin) were determined in each core by review of the hematoxylin and eosin-stained TMA by a board-certified pathologist with expertise in gastrointestinal pathology.
Immunohistochemistry
Immunohistochemistry was used to detect pStat1, pStat3 and pStat6 in the formalin-fixed, paraffin-embedded TMAs. Paraffin was removed by baking the slides for 15 minutes at 55°C followed by tissue rehydration and antigen retrieval. Antigen retrieval for pStat1 used 1 mM EDTA (pH 8.0) with steaming for 45 minutes, and for pStat3 and pStat6, used 0.01 M citrate buffer with steaming for 25 minutes. For pStat3, tissues were further permeabilized by a 5-minute incubation with 0.025% trypsin. Endogenous peroxidases and non-specific binding sites were blocked with 0.03% hydrogen peroxide and 2% goat serum. The following primary antibodies were titrated to optimize signal and applied overnight at 4°C: anti-pStat1 (Tyr 701) antibody (CellSignaling, Danvers, MA) (1:100), anti-pStat3 (Tyr 705) antibody (CellSignaling, Danvers, MA) (1:500), and anti-pStat6 (Tyr 641) antibody (Abcam, Cambridge, MA) (1:100). PowerVision horseradish peroxidase mouse anti-goat (pStat1 and pStat3) or rabbit (pStat6) (Leica Microsystems, Bannockburn, IL) (30 minutes at room temperature) was applied as the secondary antibodies, followed by 3.3′-diaminobenzidine to detect the antigen with hematoxylin tissue counterstain. Primary antibody was omitted as a control for non-specific binding of the secondary antibody.
After immunohistochemistry staining, TMA slides were scanned and evaluated digitally using the electronic program, TMAj (Johns Hopkins University). For each TMA, a hematoxylin and eosin stained slide was also scanned and reviewed to confirm the histologic diagnosis of chronic active inflammation, LGD, HGD or CAC. As judged by the pathologist review, cores that did not contain the anticipated pathology or revealed poor staining were not further analyzed. After initial development of the 0–3 grading scale (Table 2, Figure 1), all pStat1, pStat3 and pStat6 sections were graded independently by two separate observers who were not aware of the clinical or pathologic diagnosis. Discrepancies were resolved by combined review.
Table 2.
Grading scale used to evaluate TMAs
| Grade | Immune Cell | Epithelial Cell |
|---|---|---|
| 0 | No staining | No Staining |
| 1 | 1–25 positive cells, scattered | Rare positive cells |
| 2 | > 25 positive cells, with patches of contiguously positive cells | 1–4 clusters with contiguous positive staining |
| 3 | Diffuse positive cells | 5 + clusters with contiguous positive staining |
Figure 1.
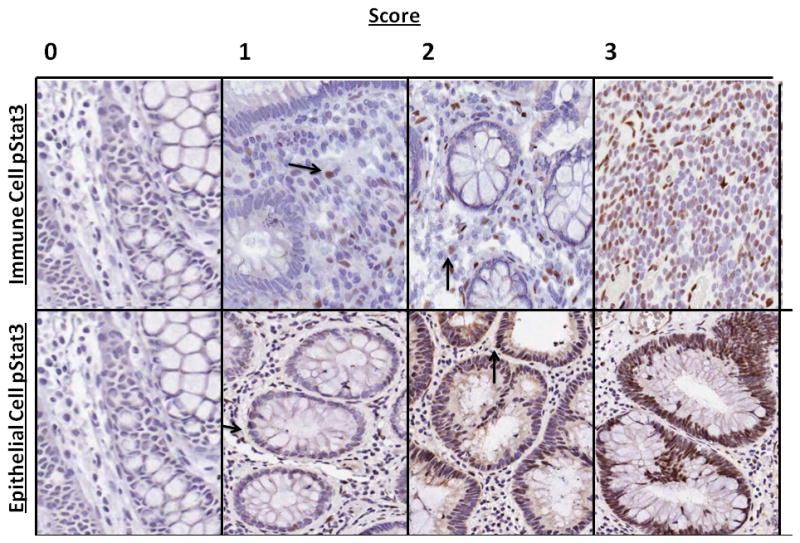
Grading scale used to evaluate tissue microarrays. Representative images of pStat3 staining in the immune cell and epithelial cell compartments (arrows demarcate positive cells)
Statistical Analysis
The Chi-squared test was used to measure the relationship between Stat expression and clinical and pathological data. The Kruskal-Wallis test was used to compare differences between different pathologic diagnosis (normal colon, chronic active, LGD, HGD and CAC). Data are presented as means ± standard errors of the means.
Ethical Considerations
Specimens were obtained in accordance with a protocol approved by Johns Hopkins Hospital Institutional Review Board.
Results
Stat activation was evaluated in 447 cores from 67 patients with IBD (37 UC patients, 27 CD patients and 3 patients with indeterminate colitis) representing a range of pathology from chronic active colitis to CAC, and 41 cores with no inflammation from 11 patients with either a history of colorectal cancer or IBD (controls) (Table 1). Patients with IBD were younger than control patients (median 47 years versus 59 years). Most (74 %) patients with CAC had an underlying diagnosis of UC. CAC tumors were located throughout the colon (Table 3). Pathologic review confirmed the diagnoses of adenocarcinoma: 6/16 tumors had mucinous features and 6/16 patients had evidence of lymph node involvement (Table 3).
Table 3.
Mean (standard error of the mean) pStat6 and pStat3 Scoring by Tumor Characteristics
| Stat6 | Stat3 | |||||
|---|---|---|---|---|---|---|
| N | Epithelial Cell | Immune Cell | Epithelial Cell | Immune Cell | ||
| TUMOR SITE | ALL SITES | 16 | 0.03(0.03) | 0.09(0.04) | 0.77(0.015) | 1.06(0.16) |
| LEFT COLON | 9 | 0.00(0) | 0.08(0.04) | 0.66(0.21) | 1.17(0.22) | |
| RIGHT COLON | 6 | 0.08(0.08) | 0.11(0.08) | 0.96(0.26) | 1.07(0.21) | |
| TRANSVERSE COLON | 1 | 0.00(0) | 0.00(0) | 0.67(0) | 0.00(0) | |
| HISTOLOGIC GRADE | LOW GRADE | 9 | 0.00(0) | 0.10(0.04) | 0.70(0.20) | 1.27(0.16)* |
| HIGH GRADE | 7 | 0.07(0.07) | 0.07(0.07) | 0.87(0.24) | 0.78(0.27) | |
| HISTOLOGIC TYPE | ADENOCARCINOMA | 10 | 0.05(0.05) | 0.12(0.06) | 0.75(0.19) | 1.07(0.21) |
| MUCINOUS (COLLOID) | 6 | 0.00(0) | 0.03(0) | 0.82(0.28) | 1.04(0.25) | |
| LYMPHNODES | METASTASES | 6 | 0.00(0) | 0.00(0) | 1.05(0.22) | 1.21(0.16)** |
| NO METASTASES | 10 | 0.05(0.05) | 0.14(0.05) | 0.61(0.19) | 0.97(0.24) | |
| IBD DIAGNOSIS | CROHN’S DISEASE | 2 | 0.00(0) | 0.01(0.01) | 0.00(0) | 0.67(0.67) |
| ULCERATIVE COLITIS | 14 | 0.04(0.04) | 0.09(0.04) | 0.89(0.15) | 1.11(0.16)*** | |
p<0.05 pStat3 immune cells low versus high grade
p<0.05 pStat3 immune cells lymph node metastases versus no lymph node metastases
p<0.05 pStat3 immune cells Crohn’s disease versus ulcerative colitis
We first sought to determine the pattern of cellular staining in the colonic epithelial cells and associated immune cells of patients without colitis or cancer. In sections of colon that were from control patients (histologically normal), virtually no pStat1 was detected in the epithelial or the immune cell compartments (0/11 and 1/11 patients were positive for epithelial and immune cell pStat1, respectively). In these histologically normal tissues, both pStat3 and pStat6 were rarely detected in the epithelial compartment (2/9 and 2/8 patients, respectively), whereas 6/9 and 8/8 of control patients, respectively, had low levels of pStat3 and pStat6 detected in the colon immune cells (2–3 sets of patient samples per group were not interpretable).
When we characterized pStat1, pStat3 and pStat6 in patients with IBD (chronic active disease, dysplasia or CAC), none had pStat1 staining in the colonic epithelial cells, but they did have low levels of pStat1 expression in immune cells. These levels were similar in patients with UC or CD. Although the level of pStat1 staining was low, the percentage of patients with any pStat1 in the immune cells increased across the spectrum of chronic active disease (15/40, 38%), LGD (10/21 patients, 48%) and HGD (13/24, 54%), but then decreased in patients with CAC (5/25, 20%) (P <0.05 for trend, data not shown). In contrast, most patients had some pStat3 and pStat6 detected in the immune cells, regardless of pathologic diagnosis (Figure 2A). pStat3 was significantly more common in patients with UC than in those with CD (34/39, 87% vs. 10/18, 55%, P<0.05). Interestingly, pStat6 staining in the epithelial and immune cell compartments was much more common in patients with chronic active disease than in those with CAC (53% versus 8% for epithelial cells, P<0.05 and 61% versus 38% for immune cells; P=0.12, Figure 2A).
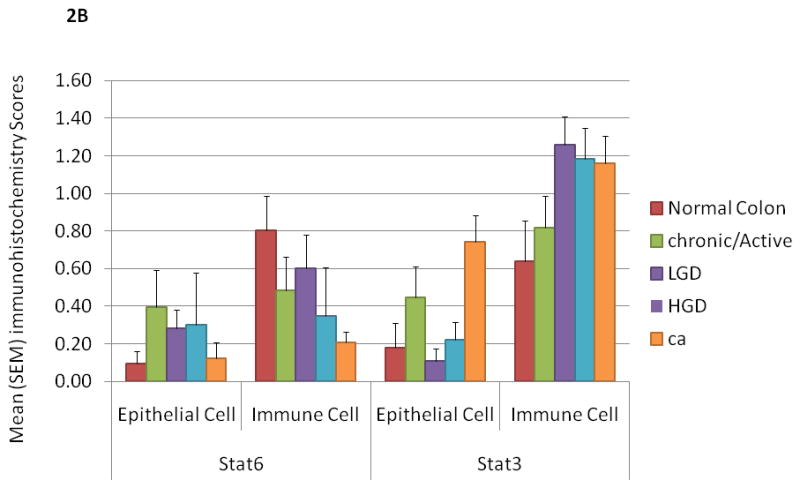
Figure 2.
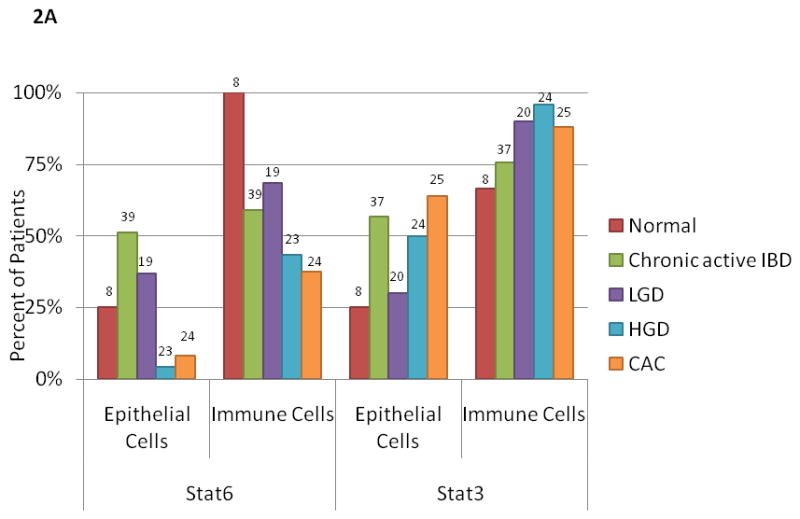
A. pStat3 and pStat6 expression in normal, chronic active IBD, LGD, HGD and CAC expressed as a percentage of patients with any staining in the epithelial or immune cell compartment. The percentage of patients with pStat3 (+) epithelial cells and/or immune cells was significantly higher in CAC as compared to than in normal patients (P<0.05). The percentage of patients with pStat6 (+) immune cells was significantly higher in normal patients as compared to CAC (P<0.05). The number on each bar is the number of patients examined for each histological diagnosis and cell type (epithelial and immune cell).
B. Mean score for pStat3 and pStat6 expression in normal, chronic active IBD, LGD, HGD and CAC tissue samples from patients with UC. The mean score for epithelial cell and immune cell pStat3 (+) is significantly higher in CAC than in normal patients (P<0.05). Mean score for pStat6 (+) in immune cells is less in CAC than in normal patients (P<0.05). Error bars indicate standard error of the mean.
IBD, inflammatory bowel disease; LGD, low-grade dysplasia, HGD, high-grade dysplasia, CAC, colitis-associated cancer.
In patients with chronic active colitis, pStat3 was only detected in rare mucosal immune and epithelial cells whereas pStat3 immune cell staining intensified with progression from chronic active colitis to LGD to HGD to CAC. This effect was most pronounced in UC, where the intensity of Stat3 staining in colonic epithelial cells was also significantly increased in CAC (0.74 ± 0.14) as compared to normal colonic tissue (0.18 ± 0.16), P<0.05. Intensity of Stat3 staining in immune cells was increased in dysplastic/neoplastic tissue (LGD 1.26 ± 0.15, HGD 1.19 ± 0.15, CAC 1.16 ± 0.15) as compared to normal or inflamed tissue (normal 0.64 ± 0.17 and chronic active colitis 0.82 ± 0.15) P<0.05 (Figure 2B, 3). In UC-associated CAC samples, pStat3 expression in epithelial cells was particularly prominent in a subset of 7 patients (50% of patients with UC and CAC) and always associated with strong pStat3 staining in surrounding immune cells (Figure 3).
Figure 3.
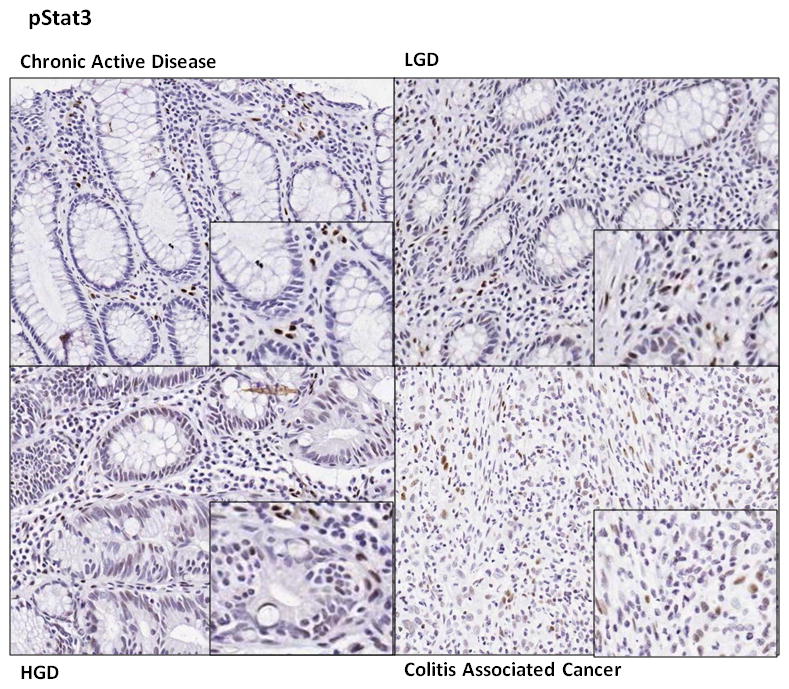
Representative pStat3 staining in chronic active inflammatory bowel disease, low grade dysplasia, high grade dysplasia and colitis associated cancer
In patients with CAC, when Stat staining was analyzed by tumor characteristics, pStat3 staining in immune cells was significantly more intense in low-grade tumors than in high-grade tumors (1.27 vs. 0.78, P<0.05) and tumors with lymph node metastases as compared to those without metastases (1.21 vs. 0.97, P<0.05) (Table 3). The intensity of immune cell staining was greater in CAC with an underlying diagnosis of UC than CD (1.11 vs. 0.67, P<0.05), the colonic epithelial cell staining may be stronger in UC than in CD (0.55 vs. 0.06 P=0.06). There was no association between pStat3 detection and tumor location (right, transverse or left colon) or the presence of mucin (Table 3).
Discussion
Our results demonstrate that in IBD patients, the pattern of Stat activation in immune cells associates best with the colonic pathology. In particular, colonic immune cell pStat3 activation increases as the tissue becomes increasingly inflamed and then dysplastic, whereas immune cell pStat6 activation is significantly lower in CAC than in normal tissue. These findings suggest that the development of CAC is marked by a shift in effector T-cell balance from Th2 to Th17 predominance. Along the continuum of colonic dysplasia/neoplasia, expression of pStat3 in epithelial cells lagged behind that in immune cells, a finding also noted in a murine model of bacterial-induced tumorigenesis (Wick, Rabizadeh, Sears unpublished data).16 In our study, the majority of patients displayed colonic epithelial cell Stat3 activation only as CAC emerged. Epithelial cell pStat3 activation in patients with chronic active disease, LGD or HGD was not significantly greater than activation in the control population, which suggests that activation of pStat3 in the immune cell compartment may be an important precursor for activation of Stat3 in the epithelial cell compartment.
Among the Stat proteins, Stat3 transduces signals from numerous growth factor and cytokine receptors, including the pro-oncogenic IL-6 receptor, and Stat3 is constitutively activated in both inflammatory conditions and cancers, serving as a potential protein for convergence of inflammatory and oncogenic signals. In multiple intestinal neoplasia (Min) mice, enterotoxigenic Bacteroides fragilis infection induces colitis and colonic tumors via activation of pStat3 and a selective Th17 response.16 In this mouse model, blockade of IL-17, whose expression requires Stat3 activation, inhibits tumor formation. In the azoxymethane and dextran sodium sulfate (AOM-DSS) murine model of CAC, mice lacking Stat3 in the intestinal epithelial cells develop fewer tumors as compared to the Stat3-sufficient mice in part, because Stat3 in the intestinal epithelial cell promotes survival and proliferation of dysplastic epithelial cells.17,18 A series of clinical studies have focused on the role of Stats and particularly Stat3 in IBD (Table 4). 19–22 In all of these studies, Stat3 was associated with active disease and recently, Li et al found that in active UC, higher levels of pStat3 was present in patients with dysplasia and CAC than in normal patients (without IBD) or those with sporadic colorectal cancer.21 In our study of 67 patients with UC and CD, we showed that along the spectrum of active disease to CAC there is a concomitant rise in pStat3 and decrease in pStat6 expression in both the intestinal epithelial cells and immune cells.
Table 4.
Summary of studies examining Stat3 expression in IBD
| Study | Number of Patients | Analysis | Major Findings |
|---|---|---|---|
| Lovato et al., 2003 [22] | 7 CD pts 7 healthy patients |
Immunoblot analysis for Stat3 and Stat4 in intestinal immune cells and/or peripheral immune cells | Stat3 and Stat4 are constitutively activated in CD pts |
| Mudter et al., 2005 [19] | 30 IBD patients 6 healthy patients |
Intracellular staining for Stats on isolated lamina propria CD4 cells and IHC | pStat3: markedly increased in inactive IBD vs control pts. pStat1 and pStat6: no difference between active IBD pts and control |
| Carey et al.,2008 [21] | 17 CD patients 26 CD-treated patients 11 UC patients 20 healthy patients |
Serum cytokine analysis pStat3 in peripheral blood leukocytes pStat3 IHC Microarray analysis |
Stat3 + peripheral granulocytes, lamina propria immune cells and colonic epithelial cells correlated with disease activity Circulating IL6 is increased in IBD patients |
| Li et al., 2010 [21] | 73 UC pts (inactive, chronic active, LGD, HGD, CAC) 14 Sporadic colorectal cancer pts |
IHC for pStat3, IL6 and SOCS3 | active UC pts: increased pStat3 and IL6 as compared to pts with inactive disease. SOCS3 elevated. HGD and CAC pts: increased Stat3 and IL6 as compared to controls, decreased SOCS3 |
Abbreviations: IBD, inflammatory bowel disease; LGD, low-grade dysplasia, HGD, high-grade dysplasia, CAC, colitis-associated cancer, IHC, immunohisotchemistry, SOCS3, suppressor of cytokine signalling 3(a target of the pStat3 pathway which regulates negative feedback to Stat and cytokine signaling).
In IBD patients, screening for dysplasia and CAC is done by colonoscopy with frequent biopsies. This screening method is cumbersome and is poor at predicting patients who will develop cancer.4 In addition, it is often challenging for the pathologist to distinguish reactive epithelial changes arising in the setting of inflammation from truly dysplastic changes. Histologic stains of screening colonoscopy biopsy tissues for pStat3 and/or pStat6 may help identify high-risk patients. For example, patients with a shift from predominant pStat6 expression to predominant pStat3 expression may be more likely to have dysplasia either on the biopsies taken at that time or in the future, and thus may warrant closer examination with more frequent colonoscopies and biopsies to detect HGD or CAC.
Our study had several limitations. First, TMAs allowed for very focused evaluation of tissue cores with confirmed detailed pathologic diagnoses. However, fresh tissue was not available and consequently, we could not confirm our IHC results with an alternative method such as immunoblotting, or confirm the Th17 profile associated with CAC by completing more detailed mucosal cytokine analysis. Second, tissue used to construct the TMAs was selected from patient specimens collected between 1989 and 2001. Since all specimens were handled similarly by the Johns Hopkins Department of Pathology, we believe the quality of IHC staining was generally consistent, but some sections were of poor quality and were not evaluated. Third, limited information was available about medication use at the time of tissue collection. Immunomodulating therapies may have affected the mucosal cytokine profile and/or pStat expression.23 Fourth, our study included only a few patients with samples representing the continuum of chronic active disease, LGD, HGD and CAC. Therefore we were not able to analyze Stat activation along the continuum of chronic active disease, LGD, HGD and CAC in single patients to confirm if the changes observed are consistent patient-to-patient. Although significantly more pStat3 was present in low-grade tumors than in high-grade ones, more detailed analysis of association between expression and tumor features was also limited by the available sample size. Detailed, prospective analysis of IBD patients enrolled in CAC surveillance programs would begin to address the shortcomings of our study and further establish if a shift in the intestinal immune cell profile is an indicator of dysplasia, warranting a need for more intensive screening in individual patients.
In conclusion, our study shows that in colonic immune cells in particular, activation of pStat3 increases as the tissue becomes increasingly inflamed and then dysplastic. Since IL-6 is recognized as an increasingly important mediator of intestinal inflammation and pStat3 is an important transcription factor down-stream of IL-6 that coordinates innate and adaptive immune responses and oncogenic signals, pStat3 may be a marker for neoplastic transformation in a subset of patients with colitis.15 A shift from predominant immune cell pStat6 expression to pStat3 expression may be an early sign of neoplasia. Stat 3 may even be one of the links between inflammation and cancer in IBD having implications for both CAC surveillance and treatment.
Figure 4.
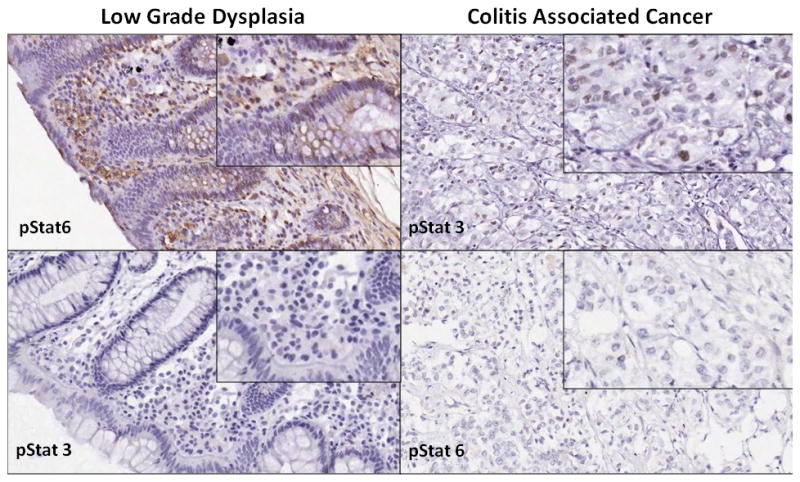
Sections from a single patient with ulcerative colitis. The figure shows areas of low grade dysplasia and colitis associated cancer demonstrating increased pStat3 and decreased pStat6 expression in colitis associated cancer and increased pStat6 and decreased pStat3 in low grade dysplasia.
Acknowledgments
Grant support: R01 CA151393 (CLS), RO1 CA 091409(CLS), RO1 DK 45496(CLS), RO1 DK 080817(CLS), K08 DK 087856 (ECW), American Society of Colorectal Surgeons Career Development Award (ECW)
References
- 1.Eaden JA, Abrams KR, Mayberry JF. The risk of colorectal cancer in ulcerative colitis: a meta-analysis. Gut. 2001;48:526–535. doi: 10.1136/gut.48.4.526. [DOI] [PMC free article] [PubMed] [Google Scholar]
- 2.Farraye FA, Odze RD, Eaden J, et al. AGA technical review on the diagnosis and management of colorectal neoplasia in inflammatory bowel disease. Gastroenterology. 2010;138:746–74. 774, e1–4. doi: 10.1053/j.gastro.2009.12.035. quiz e12-3. [DOI] [PubMed] [Google Scholar]
- 3.Riddell RH, Goldman H, Ransohoff DF, et al. Dysplasia in inflammatory bowel disease: standardized classification with provisional clinical applications. Hum Pathol. 1983;14:931–968. doi: 10.1016/s0046-8177(83)80175-0. [DOI] [PubMed] [Google Scholar]
- 4.Eaden JA, Ward BA, Mayberry JF. How gastroenterologists screen for colonic cancer in ulcerative colitis: an analysis of performance. Gastrointest Endosc. 2000;51:123–128. doi: 10.1016/s0016-5107(00)70405-6. [DOI] [PubMed] [Google Scholar]
- 5.Coussens LM, Werb Z. Inflammation and cancer. Nature. 2002;420:860–867. doi: 10.1038/nature01322. [DOI] [PMC free article] [PubMed] [Google Scholar]
- 6.Yu H, Jove R. The STATs of cancer--new molecular targets come of age. Nat Rev Cancer. 2004;4:97–105. doi: 10.1038/nrc1275. [DOI] [PubMed] [Google Scholar]
- 7.Bromberg J, Wang TC. Inflammation and cancer: IL-6 and STAT3 complete the link. Cancer Cell. 2009;15:79–80. doi: 10.1016/j.ccr.2009.01.009. [DOI] [PMC free article] [PubMed] [Google Scholar]
- 8.Shankaran V, Ikeda H, Bruce AT, et al. IFNgamma and lymphocytes prevent primary tumour development and shape tumour immunogenicity. Nature. 2001;410:1107–1111. doi: 10.1038/35074122. [DOI] [PubMed] [Google Scholar]
- 9.Galon J, Costes A, Sanchez-Cabo F, et al. Type, density, and location of immune cells within human colorectal tumors predict clinical outcome. Science. 2006;313:1960–1964. doi: 10.1126/science.1129139. [DOI] [PubMed] [Google Scholar]
- 10.Morikawa T, Baba Y, Yamauchi M, et al. STAT3 expression, molecular features, inflammation patterns, and prognosis in a database of 724 colorectal cancers. Clin Cancer Res. 2011;17:1452–1462. doi: 10.1158/1078-0432.CCR-10-2694. [DOI] [PMC free article] [PubMed] [Google Scholar]
- 11.Sobhani I, Tap J, Roudot-Thoraval F, et al. Microbial dysbiosis in colorectal cancer (CRC) patients. PLoS One. 2011;6:e16393. doi: 10.1371/journal.pone.0016393. [DOI] [PMC free article] [PubMed] [Google Scholar]
- 12.Tosolini M, Kirilovsky A, Mlecnik B, et al. Clinical impact of different classes of infiltrating T cytotoxic and helper cells (Th1, th2, treg, th17) in patients with colorectal cancer. Cancer Res. 2011;71:1263–1271. doi: 10.1158/0008-5472.CAN-10-2907. [DOI] [PubMed] [Google Scholar]
- 13.Su X, Ye J, Hsueh EC, et al. Tumor microenvironments direct the recruitment and expansion of human Th17 cells. J Immunol. 2010;184:1630–1641. doi: 10.4049/jimmunol.0902813. [DOI] [PubMed] [Google Scholar]
- 14.Maynard CL, Weaver CT. Intestinal effector T cells in health and disease. Immunity. 2009;31:389–400. doi: 10.1016/j.immuni.2009.08.012. [DOI] [PMC free article] [PubMed] [Google Scholar]
- 15.Strober W, Fuss IJ. Proinflammatory cytokines in the pathogenesis of inflammatory bowel diseases. Gastroenterology. 2011;140:1756–1767. doi: 10.1053/j.gastro.2011.02.016. [DOI] [PMC free article] [PubMed] [Google Scholar]
- 16.Wu S, Rhee KJ, Albesiano E, et al. A human colonic commensal promotes colon tumorigenesis via activation of T helper type 17 T cell responses. Nat Med. 2009;15:1016–1022. doi: 10.1038/nm.2015. [DOI] [PMC free article] [PubMed] [Google Scholar]
- 17.Atreya R, Neurath MF. Signaling molecules: the pathogenic role of the IL-6/STAT-3 trans signaling pathway in intestinal inflammation and in colonic cancer. Curr Drug Targets. 2008;9:369–74. doi: 10.2174/138945008784221116. [DOI] [PubMed] [Google Scholar]
- 18.Grivennikov S, Karin E, Terzic J, et al. IL-6 and Stat3 are required for survival of intestinal epithelial cells and development of colitis-associated cancer. Cancer Cell. 2009;15:103–113. doi: 10.1016/j.ccr.2009.01.001. [DOI] [PMC free article] [PubMed] [Google Scholar]
- 19.Mudter J, Weigmann B, Bartsch B, et al. Activation pattern of signal transducers and activators of transcription (STAT) factors in inflammatory bowel diseases. Am J Gastroenterol. 2005;100:64–72. doi: 10.1111/j.1572-0241.2005.40615.x. [DOI] [PubMed] [Google Scholar]
- 20.Carey R, Jurickova I, Ballard E, et al. Activation of an IL-6:STAT3-dependent transcriptome in pediatric-onset inflammatory bowel disease. Inflamm Bowel Dis. 2008;14:446–57. doi: 10.1002/ibd.20342. [DOI] [PMC free article] [PubMed] [Google Scholar]
- 21.Li Y, de Haar C, Chen M, et al. Disease-related expression of the IL6/STAT3/SOCS3 signalling pathway in ulcerative colitis and ulcerative colitis-related carcinogenesis. Gut. 2010;59:227–235. doi: 10.1136/gut.2009.184176. [DOI] [PubMed] [Google Scholar]
- 22.Lovato P, Brender C, Agnholt J, et al. Constitutive STAT3 activation in intestinal T cells from patients with Crohn’s disease. J Biol Chem. 2003;278:16777–81. doi: 10.1074/jbc.M207999200. [DOI] [PubMed] [Google Scholar]
- 23.Schreiber S, Rosenstiel P, Hampe J, et al. Activation of signal transducer and activator of transcription (STAT) 1 in human chronic inflammatory bowel disease. Gut. 2002;51:379–385. doi: 10.1136/gut.51.3.379. [DOI] [PMC free article] [PubMed] [Google Scholar]


