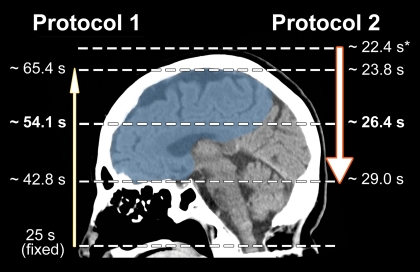
Figure 1:
Scheme of image acquisition with protocols 1 and 2. Blue = anterior circulation territory. Note the differences in image direction (caudocranial vs craniocaudal), imaging starting point (C1 vertebral body vs vertex), delay time (25-second fixed delay vs SmartPrep), and table speed (3.75–5.63 vs 9.38–39.38 mm/sec), which result in different mean imaging times for the anterior circulation territory. ∗ = Monitoring delay (10 seconds) plus trigger time plus diagnostic delay (3 seconds).

