

A normative model based on the variability of growth rates measured in lung nodules that were stable for an average of 6.4 years enabled identification of lung cancer.
Abstract
Purpose:
To determine the precision of a three-dimensional (3D) method for measuring the growth rate of solid and subsolid nodules and its ability to detect abnormal growth rates.
Materials and Methods:
This study was approved by the Institutional Research Board and was HIPAA compliant. Informed consent was waived. The growth rates of 123 lung nodules in 59 patients who had undergone lung cancer screening computed tomography (CT) were measured by using a 3D semiautomated computer-assisted volume method. Clinical stability was established with long-term CT follow-up (mean, 6.4 years ± 1.9 [standard deviation]; range, 2.0–8.5 years). A mean of 4.1 CT examinations per patient ± 1.2 (range, two to seven CT examinations per patient) was analyzed during 2.4 years ± 0.5 after baseline CT. Nodule morphology, attenuation, and location were characterized. The analysis of standard deviation of growth rate in relation to time between scans yielded a normative model for detecting abnormal growth.
Results:
Growth rate precision increased with greater time between scans. Overall estimate for standard deviation of growth rate, on the basis of 939 growth rate determinations in clinically stable nodules, was 36.5% per year. Peripheral location (P = .01; 37.1% per year vs 25.6% per year) and adjacency to pleural surface (P = .05; 38.9% per year vs 34.0% per year) significantly increased standard deviation of growth rate. All eight malignant nodules had an abnormally high growth rate detected. By using 3D volumetry, growth rate–based diagnosis of malignancy was made at a mean of 183 days ± 158, compared with radiologic or clinical diagnosis at 344 days ± 284.
Conclusion:
A normative model derived from the variability of growth rates of nodules that were stable for an average of 6.4 years may enable identification of lung cancer.
© RSNA, 2011
Supplemental material: http://radiology.rsna.org/lookup/suppl/doi:10.1148/radiol.11100878/-/DC1
Introduction
The ability to detect an increase in the size of a pulmonary nodule, whether indeterminate or of known malignant potential, is of high clinical importance, particularly in light of the recent announcement by the National Lung Screening Trial that reported preliminarily a reduction in lung cancer–related deaths by 20% with computed tomographic (CT) screening, in comparison with chest radiography (1). Although potentially related to benign processes, growth of a nodule raises clinical suspicion of malignancy and alters subsequent management (2,3).
Current radiologic practice for assessing changes in nodule size at chest CT relies on manually obtained one- and two-dimensional measures (4,5). Measurement techniques include the use of calipers for determining the largest or the two largest orthogonal dimensions on a representative single axial section, which can be multiplied or used to determine the area of a nodule on a single section, by using mathematical assumptions of nodule shape.
Semiautomated and fully automated three-dimensional (3D) volume evaluation has been shown to be both accurate and precise for quantifying the size of small solid nodules (6–26). While absolute accuracy or the ability to measure true volume of a nodule is of interest, in clinical practice, the precision or reproducibility of a measurement method is more relevant. Three-dimensional techniques have been shown to be more sensitive, particularly for asymmetric nodules, than one- or two-dimensional methods for identifying changes in nodule size (6,8,27–31). Several reports addressed the precision of 3D volume techniques for measuring nodules in vivo (8,10,11,32), primarily on single CT studies or CT studies obtained the same day. To our knowledge, the precision of assessing in vivo the volume of subsolid nodules has only been reported in one promising study that used manual tracing for nodule volumetry (33).
To assess changes in nodule volume, we developed a semiautomated 3D algorithm that is applicable to both solid and ground-glass attenuation nodules. Validation by using stationary phantoms has been performed. However, phantom studies cannot assess potentially significant errors due to respiratory motion, changes in the parenchyma surrounding nodules, varying nodule orientation in relation to the chest wall and other structures, irregular nodular borders, and asymmetric nodule shape and attenuation. Before a 3D volume technique can be reliably applied in clinical practice, it is essential to assess its precision for measuring growth rate in vivo. We also examined the ability of 3D volumetry to depict abnormal growth rates by applying our model to pathologically proved malignant nodules. We hypothesized that the use of the model depicts suspicious growth earlier than criteria used in present practice.
Given this need, clinically stable individuals participating in a long-term lung cancer screening study were analyzed to measure the growth rate of solid and subsolid nodules at CT. Our purpose was to determine the precision of a 3D method for measuring the growth rate of solid and subsolid nodules and its ability to depict abnormal growth rates.
Materials and Methods
Study Subjects
This study was approved by the Institutional Research Board with a waiver of consent and was Health Insurance Portability and Accountability Act compliant. Chest CT reports of all individuals enrolled between March 1, 2000 and November 30, 2001 in a lung cancer CT and biomarker screening trial at our institution were reviewed for the presence of clinically stable lung nodules. Nodules were determined to be stable on the basis of reports issued by interpreting dedicated thoracic radiologists (including J.P.K. and D.P.N.) with experience ranging between 3 and 25 years. Clinical stability was established with long-term CT follow-up, which lasted for a mean of 6.4 years ± 1.9 (standard deviation) and ranged from 2.0 to 8.5 years, after the initial baseline examination. A total of 123 stable lung nodules were identified in 59 individuals. There were 25 female (mean age, 56.6 years ± 8.4) and 34 male (mean age, 61.1 years ± 8.3) patients.
A total of 239 CT examinations, 59 baseline and 180 follow-up examinations, with an average of 4.1 examinations per patient ± 1.2 (range, two to seven examinations per patient), were identified for volumetric analysis. Subsequent examinations were performed during a mean of 2.4 years ± 0.5 (range, 1–3.6 years) after baseline examination (Table 1). The majority (approximately 85%) of subsequent CT examinations were performed for nodule follow-up. Images of each nodule that had been obtained at multiple time points were reviewed by a thoracic radiologist (J.P.K., 9 years of postfellowship experience) to confirm stability.
Table 1.
Number of Patients, Nodules, and CT Examinations per Patient
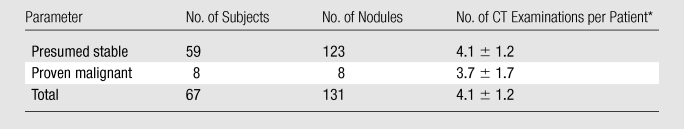
Data are means ± standard deviations.
Nodules in eight patients with lung malignancy diagnosed by a change in size were identified during the same time period, and malignancy was confirmed by using surgery (n = 7) or biopsy (n = 1) results. There were five women (mean age, 65.9 years ± 4.31) and three men (mean age, 59.9 years ± 1.5). Five of eight patients had been imaged as part of a CT screening trial, with a mean of four CT examinations per patient (range, two to seven examinations per patient) performed during a mean of 1.45 years (range, 0.2–3.2 years). One patient had a screening CT ordered by a referring physician for smoking history, with two CT studies acquired 85 days apart. Two remaining patients underwent three and five CT studies separated by 466 and 758 days, respectively. One was ordered for an abnormal radiograph and smoking history, while the other was ordered for follow-up after lung cancer resection. CT reports were reviewed to document the date on which abnormal growth was detected.
Imaging Protocol
Imaging was performed with a four–detector row CT scanner (Volume Zoom 4; Siemens Medical Solutions, Iselin, NJ). All of the initial scans were performed with a low-dose technique by using 120–140 kVp with 20–40 mAs and reconstruction by using a high-frequency algorithm (kernel b60), 512 × 512 resolution, and 25–35-cm field of view. For the subsequent follow-up CT examinations, 77% were conducted by using a low dose (20–40 mAs), and 23% were conducted by using doses ranging from 50 to 120 mAs. Images were reconstructed in 1.25-mm sections at 1.0-mm intervals for determination of nodule characteristics and 3D volume measurements. Protected health information was removed, and the anonymous data were transferred in Digital Imaging and Communications in Medicine format to a standard desktop computer for analysis.
Nodule Characteristics and Caliper Measurements
Each nodule was categorized in terms of its attenuation, location, overall shape, and borders at baseline CT. The presence of image artifacts was assessed at every time point. This was performed by two experienced thoracic radiologists (J.P.K.; D.P.N., 25 years of experience in chest radiology). Characteristics were initially assessed independently to study interobserver variability. A consensus session was performed to resolve discrepancies, and results were analyzed to assess the effect of these characteristics on growth rate estimates. Nodule attenuation was characterized as solid for nodules closely approximating soft-tissue attenuation or subsolid when there was presence (either the entire nodule or its component) of attenuation lower than that of soft tissue. The attenuation of adjacent vessels in the lung parenchyma was used as a reference. Nodule location was defined as central if the lesion was found within the inner two-thirds of a lobe; otherwise, it was considered peripheral. When the nodule contacted the pleura, the pleural surfaces (mediastinal, costal, and/or fissural) were recorded. A nodule shape was determined to be either round (ie, spherical or elliptical) or irregular. The morphology of the border of a nodule was categorized as smooth, lobulated or spiculated, or poorly defined. The presence of CT artifacts in the vicinity of the nodule and the presence and number of vessels contacting each nodule were noted.
The longest dimension of each nodule was measured by one of two readers (one with 3 years of in-residency training [E.J.B.] and the other [M.K.] with 1 year of training after medical school) by using electronic calipers on the axial section in which the nodule appeared the largest. The maximal transverse dimension of the largest adjacent vessel that abutted the nodule was also measured at the point of contact with the nodule.
Volume Measurement
The volume of each nodule was computed by using a previously described method based on a partial volume model (7,34) with subsequent modifications (35). The observer was required to place an overinclusive region of interest (I1) around the nodule while avoiding adjacent structures (blood vessels, chest wall) and unrelated disease such as atelectasis and consolidation. Manual delineation of the overinclusive 3D region encompassing a nodule took 35 seconds on average. I1 included the nodule on all CT sections in which it was visible in addition to penumbra of the lung, extending 1–3 mm (approximately 2–6 voxels) beyond the apparent margin of the nodule. A nodule map as a subset of I1 was generated. Nodule volume was then computed by summing partial volumes of voxels on the nodule map (Appendix E1 [online]).
The two observers who completed the caliper measurements also performed volumetric assessment after a training session. Each observer analyzed one-half of the nodules. The training session entailed use of the software program on two sample nodules. The training session reviewed the procedure for region of interest placement, so that the adjacent structures that abutted the nodule, such as the chest wall or blood vessels, were excluded. All serial CT studies in a given nodule were analyzed by the same observer at the same time, reflecting the radiologic practice of comparing current with prior examination results (Fig 1). To assess interobserver variability, at all imaging time points for a random subset of 19 of these nodules, ranging in volume between 10.7 and 100.3 mm3, volume was independently measured by both observers.
Figure 1:

Axial chest CT images of two representative stable nodules. Top: Ovoid solid nodule abuts the costal pleural surface in the right lower lobe. Bottom: Round nodule in the right lower lobe. Both nodules were imaged at four time points (left to right).
Data Analysis
The apparent growth rate (GR) measured at any two points in time (T1, T2) was computed as
where V1 and V2 were the two volume estimates. For stable nodules with presumably minimal growth, the variance of growth rate reflected predominantly the precision of volume measurement. A total of 939 pairs of V1 and V2 were available for analysis, including 142 growth rate values for nonsolid nodules.
The distribution of growth rate for all stable nodule measurements was used to determine the relationship between variability of growth rate and the time interval (ΔT = T2 − T1) and to correct growth rate for the effect of the time interval. For modeling of the relationship between standard deviation of apparent growth rate as a function of time interval, all growth rate values were sorted according to time interval and then divided into 10 approximately equal-sized bins on the basis of increasing values of time interval. Each bin contained 93–94 data points. A power function, σ = a (ΔT)−b, with two free parameters a and b, was used to model the dependence of standard deviation of growth rate on time interval. The Levene test (36) of homogeneity of variance was used to identify nodule characteristics that significantly affected the precision of growth rate. A P value of less than .05 was considered to indicate a statistically significant difference. The agreement between observers was assessed for nodule characteristics and for measured volumes by using intraclass correlation coefficient (ICC) (absolute agreement).
Results
Table 2 lists the characteristics of lung nodules as assessed by the consensus reading. The mean linear dimension of stable nodules was 5.4 mm ± 4.7 and ranged from 1.6 to 19.0 mm.
Table 2.
Nodule Characteristics
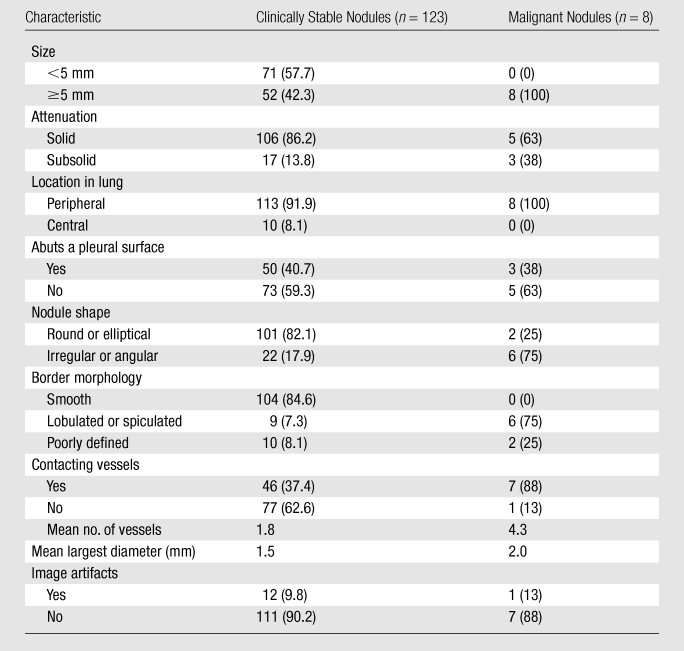
Note.—Unless otherwise indicated, data are numbers of nodules, with percentages in parentheses. Percentages may not add up to 100% because of rounding.
A plot of growth rate values (Fig 2) with all available time points for clinically stable nodules showed that values were clustered around a zero growth rate (mean, 3.3% per year), which was consistent with the notion that these nodules were truly clinically stable. Growth rate did not differ significantly between solid (2.8% per year ± 35.5) and nonsolid (8.0% per year ± 38.2) nodules (t test, T = −1.6, P = .11). The variability of growth rate clearly decreased with increasing time interval, suggesting that volume changes were less precisely determined over shorter time intervals. Across all observations, the standard deviation of growth rate was 36.5% per year.
Figure 2:

Plots show annual growth rate (GR) for clinically stable nodules by using all 939 available pairs of time points T1 and T2 with T2 greater than T1 for solid and subsolid nodules. The growth values were centered around zero growth. There was no significant difference in growth rate distribution between solid and nonsolid nodules.
The relationship between the standard deviation of the apparent growth rate as a function of time interval (Fig 3) was well approximated by the power function. A least-squares regression analysis yielded a equals 30.4 and b equals 0.63 for all stable nodules, implying the standard deviation of 47.0% per year at a time interval of 0.5 year, 30.4% per year at a time interval of 1 year, and 19.6% per year at a time interval of 2 years. In a truly stable nodule, the standard deviation of the growth rate would be inversely proportional to time interval (ie, σ = a/ΔT). However, the inverse model fitted our data much more poorly, with R2 of 0.738 and root-mean-square residual of 8.9% per year, compared with R2 of 0.972 and root-mean-square residual of 3.1% per year for the power function. On the basis of this relationship, an operational procedure (Fig 4) can be used to determine if a measured value of growth rate signifies abnormal nodule growth.
Figure 3:

Plot shows standard deviation (σ) of growth rate (GR) is well approximated by a power of time interval (ΔT).
Figure 4:

List shows method for identifying nodules with abnormal growth rates. σ = standard deviation.
Significant factors (Table 3) associated with variability according to the Levene test were related to nodule location. Peripheral location was associated with a larger variability (37.1% per year) than central (25.6% per year) location (P = .01). Nodules that abutted the pleural surface had greater variability (38.9% per year) than those that did not (34.0% per year) (P = .05).
Table 3.
Variability of Growth Rate for Stable Nodules according to Nodule Characteristics
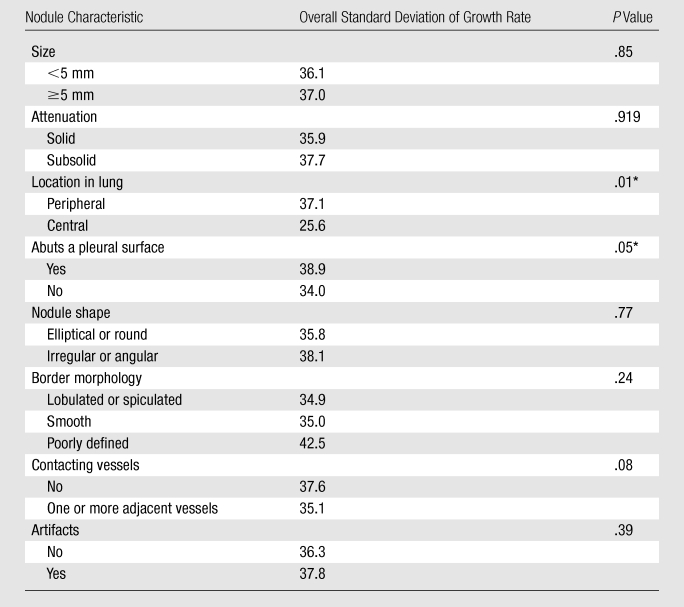
Note.—Unless otherwise indicated, data are percentages per year.
P value significantly different when less than .05 (Levene test).
Malignant Nodules
All eight nodules that had increased in size and were proved to be malignant at pathologic examination (Table 4, Fig 5) had an abnormally high growth rate detected by using the method. The abnormal growth was detected at a mean of 344 days ± 284 for radiologic or clinical diagnosis that did not include 3D volumetry, compared with 183 days ± 158 when using the 3D volumetric growth method (P = .05, paired t test).
Table 4.
Characteristics of Malignant Nodules and Time of Detection
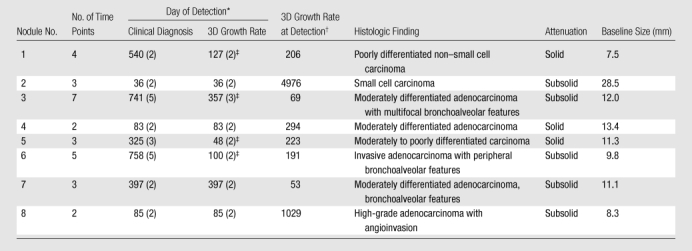
Data in parentheses are time points.
Data are percentages per year.
Detected earlier than clinical diagnosis.
Figure 5:

Graphs show growth of eight malignant nodules. Volume (black lines, ●, left vertical scale in cubic millimeters) and linear (gray lines, ▲, right vertical scale in millimeters) dimensions of malignant nodules plotted in relation to time (in days, horizontal axis). Significant volume increase was observed in each case by using volume measurement.
Interobserver Agreement for Nodule Volume and Characteristics
The nodules selected for the interobserver agreement study ranged in volume from 10.7 to 100.3 mm3. There was excellent intraclass correlation between volumes measured by two readers (ICC = 0.98). When nodules were characterized independently (prior to consensus reading) by two experts, there was good agreement for nodule attenuation (ICC = 0.67), location in the lung (ICC = 0.76), and surface morphology (ICC = 0.61); fair agreement for nodule shape (ICC = 0.27) and adjacency to blood vessels (ICC = 0.32); and poor agreement for interference of CT artifacts (ICC = 0.09).
Discussion
We analyzed the precision of growth rate measurements in a study of 123 nodules with long-term CT follow-up on the order of 6.4 years ± 1.9. While volume doubling time is often used for quantifying growth of malignant nodules (37), the variability of volume doubling time is much larger than that for growth rate for nodules likely to be stable, making growth rate a more suitable measure of change (38). In addition, as suggested by Lindell et al (39), who calculated nodule volume from orthogonal linear measurements, an exponential pattern may not describe the growth of all lung cancers. With the use of 939 growth rate estimates, a normative model (Fig 4) for growth rate precision as a function of time interval was validated in our investigation. Across all observations, the standard deviation was 36.5% per year; for a time interval of 1 year, it was 30.4% per year.
Detection of growth by using growth rate–based measures will not have perfect accuracy. Depending on the statistical threshold, a fraction of clinically stable nodules will be incorrectly flagged as having an abnormal increased growth rate. To reduce the frequency of false-positive findings, at the cost of increasing the false-negative rate, the threshold for differentiation can be increased. When applied to eight cancers that changed in size on serial CT images, the model identified disease significantly earlier than did conventional manual linear measures in half of our cases. In none of the cases did our method delay the diagnosis.
In addition to a shorter time interval, peripheral location and adjacency to pleura were associated with a larger variation in growth rate. Gietema et al (17) showed that variability of segmenting nodules with irregular margins or nonspherical shape was more than twice as large than for nodules lacking these characteristics.
The subsolid nodule has been associated with adenocarcinoma and preneoplasia, which has been termed atypical adenomatous hyperplasia. Attention therefore has been directed toward differentiating subsolid nodules with more indolent as opposed to aggressive behavior. The subsolid nodule has been associated with slow growth whose detection has been hindered by poorly defined nature. The precision of measuring the volumes of subsolid nodules, either of pure ground-glass or mixed attenuation, has been addressed in vivo only recently (33). Such nodules are of high clinical importance; a majority are thought to be adenocarcinomas or preneoplastic foci of atypical adenomatous hyperplasia (40,41). A minority of these lesions represent inflammatory conditions such as focal interstitial fibrosis (40). By using growth rate estimates for pure and mixed ground-glass nodules, we did not identify a significant difference in precision between these nodules and their solid counterparts (Fig 2). Therefore, our method may prove useful for longitudinal follow-up of the important category of subsolid lung nodules. This conclusion is supported by prior phantom experiments in which subvoxel modeling and partial volume methods were found more accurate than threshold techniques for measuring ground-glass nodules (7,35). It is acknowledged that the category of subsolid nodules has members with heterogeneous clinical behavior. Possibility remains that, in spite of our long 6.4 year ± 1.9 CT follow-up, some of these nodules nevertheless will eventually become malignant or have abnormal growth rates detected. A previous study by Hasegawa et al (42), utilizing two-dimensional manual caliper measurements, reported slow doubling times, 2.2 years ± 1.0 for 19 pure ground-glass nodules and 1.3 years ± 0.7 for 19 mixed attenuation nodules. In our study, the lack of significant growth during a long observation period supports our classification of these nodules as clinically stable. Our data, when confirmed with future studies, could enable radiologic differentiation of clinically stable nodules from their more aggressive ground-glass–containing counterparts, which would require aggressive treatment in a timely manner.
Previous studies have evaluated the precision of volume measurement by repeating CT examinations on the same day (11) or by measuring clinically stable nodules at two examinations separated by several months or years (10). While both approaches account for variability in the phase of respiration, the latter strategy may have greater clinical relevance; scarring, atelectasis, and other lung disease have a greater chance to develop when there are longer time intervals between CT examinations. These processes may increase the variability (reduce the precision) of nodule volume measurement (43–45).
Our experimental design was similar to that used by Kostis et al (10), who examined the precision of percentage volume change of 115 stable pulmonary nodules during an average of 243 days. For a subset of nodules with minimal or no artifacts on CT images (n = 94), they observed a standard deviation of percentage volume change (PVC = GR · ΔT) of 17.7% for a time interval of 6–12 months and 22.3% for a time interval of 12–30 months. When our results are restated in terms of percentage volume change, our standard deviation was 28.5% for a time interval in the range 6–12 months and 34.1% for a time interval in the range 12–30 months. The possible reason for better precision found by Kostis et al was their use of standard-dose CT technique and a small targeted field of view of 9.6 cm. In addition, cases that presented a challenge for automatic volumetry, such as nodules that abutted the pleura and subsolid nodules, were not included. In our study, the size of the nodule on the initial study did not affect the precision of our measurement. Our method explicitly accounted for partial volume effects and may have overcome the difficulties encountered when measuring smaller nodules.
Our study had several limitations. The analysis focuses solely on volumetric growth. It is also recognized that changes in other CT features (eg, morphology, distribution of attenuation values within the nodule) aid in identifying abnormal change. Recently, de Hoop et al (33) showed for ground-glass nodules that an increase in nodule mass was a better indicator of growth than a volume increase. The mean nodule mass was expressed as the nodule volume multiplied by the mean attenuation in the volume (Hounsfield units adjusted by adding 1000). Their observers were required to manually determine the volume, which was subject to technical factors that affect quantitative evaluation (46). Future work will clarify the role of new measures for monitoring the growth of ground-glass nodules.
Another limitation was that our method is semiautomated and required the user to manually differentiate the nodule from any adjacent chest wall and blood vessels. This manual step possibly degrades measurement reproducibility and adds time needed for nodule assessment. The time for measurement of the nodules was approximately 35 seconds per nodule volume assessment, although this was not measured specifically for this investigation.
Our study did not address the effect of several methodological factors (reconstruction kernel, field of view, section thickness, radiation exposure, or the use of intravenous contrast material), which are known to affect the precision of nodule volumetry (7,19,24,47) performed in phantoms and in vivo (15,17,23,47–49). In one investigation of ultra-low-dose CT, Hein et al (22) did not demonstrate significant difference in precision for 5 mAs compared with 75 mAs, although these findings may not apply to all patient populations.
Nonzero mean growth for stable nodules could be a statistical consequence of the definition of growth rate as the relative growth rate. With no growth but rather statistical errors, the same distribution of positive changes as negative changes will result in larger percentage changes for positive changes, given the denominator will be smaller for positive changes. In addition, the reason that the power model with exponent not equal to 1 fitted our data significantly better than the ideal model (σ = a/ΔT) may be related to mild volume changes of clinically stable nodules related to inflammation, scarring, and atelectasis that can develop over years. This may potentially increase standard deviation for a time interval longer than 1 year more than for a very short time interval. The advantage of the power model could be related to the sparsity of data at a short time interval; the shortest time interval was about 3 months. Last, we were not able to match the size of malignant and clinically stable nodules that could potentially exhibit slow growth. The ability to detect abnormal growth may therefore have been enhanced by the larger initial nodule size. Nevertheless, we have shown a significant difference in growth rate between these two groups.
In conclusion, a normative model based on the variability of growth rates measured in lung nodules that were stable for an average of 6.4 years enabled identification of lung cancer. The method based on normal variability appears promising for the challenging task of monitoring lung nodules at CT.
Advances in Knowledge.
A model for growth rates, established by using serial CT scans, demonstrated decreased variability of the growth rate as time intervals between CT scans increased, ranging from 47.0% per year at an interval of 0.5 year, to 30.4% per year at an interval of 1 year, to 19.6% per year at an interval of 2 years.
The model enabled abnormal growth rates to be detected in all eight pathologically proved malignancies.
The standard deviation of growth rate increased with peripheral location (P = .01) and when nodules abutted the pleural surface (P = .05).
Implications for Patient Care.
A model derived from the normal distribution of variability can potentially be used for surveillance of lung nodules suspected of being malignant by differentiating normal from abnormal growth rates.
With further understanding of its limitations, the model may assist in monitoring solid and subsolid nodules for significant growth.
Disclosures of Potential Conflicts of Interest: J.P.K. No potential conflicts of interest to disclose. E.J.B. No potential conflicts of interest to disclose. M.K. No potential conflicts of interest to disclose. J.S.B. No potential conflicts of interest to disclose. E.B. No potential conflicts of interest to disclose. A.K.G. No potential conflicts of interest to disclose. D.P.N. No potential conflicts of interest to disclose. H.R. No potential conflicts of interest to disclose.
Supplementary Material
Acknowledgments
The authors thank Bernard Assadourian, RTR CT, and Emilio Vega, RTR CT, for their expert technical assistance. Acknowledgment is made to Marmy Shah, MD, for her assistance with data acquisition, Joseph Stember, PhD, for data analysis, and Ellen Eylers, RN, for her assistance with Early Detection Research Network data.
Received April 30, 2010; revision requested June 24; revision received June 13, 2011; accepted July 22; final version accepted August 30.
Funding: This research was supported by the National Institutes of Health (grants K23 CA96604 and UO1 CA86137).
J.P.K. supported in part by an RSNA Research and Education Foundation Scholars Grant.
Abbreviations:
- ICC
- intraclass correlation coefficient
- 3D
- three dimensional
References
- 1.National Lung Screening Trial Research Team , Aberle DR, Adams AM, et al. Reduced lung-cancer mortality with low-dose computed tomographic screening. N Engl J Med 2011;365(5):395–409 [DOI] [PMC free article] [PubMed] [Google Scholar]
- 2.van Klaveren RJ, Oudkerk M, Prokop M, et al. Management of lung nodules detected by volume CT scanning. N Engl J Med 2009;361(23):2221–2229 [DOI] [PubMed] [Google Scholar]
- 3.Gould MK, Fletcher J, Iannettoni MD, et al. Evaluation of patients with pulmonary nodules: when is it lung cancer?—ACCP evidence-based clinical practice guidelines (2nd edition). Chest 2007;132(3 suppl):108S–130S [DOI] [PubMed] [Google Scholar]
- 4.Therasse P, Arbuck SG, Eisenhauer EA, et al. New guidelines to evaluate the response to treatment in solid tumors. European Organization for Research and Treatment of Cancer, National Cancer Institute of the United States, National Cancer Institute of Canada. J Natl Cancer Inst 2000;92(3):205–216 [DOI] [PubMed] [Google Scholar]
- 5.MacMahon H, Austin JH, Gamsu G, et al. Guidelines for management of small pulmonary nodules detected on CT scans: a statement from the Fleischner Society. Radiology 2005;237(2):395–400 [DOI] [PubMed] [Google Scholar]
- 6.Yankelevitz DF, Reeves AP, Kostis WJ, Zhao B, Henschke CI. Small pulmonary nodules: volumetrically determined growth rates based on CT evaluation. Radiology 2000;217(1):251–256 [DOI] [PubMed] [Google Scholar]
- 7.Ko JP, Rusinek H, Jacobs EL, et al. Small pulmonary nodules: volume measurement at chest CT—phantom study. Radiology 2003;228(3):864–870 [DOI] [PubMed] [Google Scholar]
- 8.Revel MP, Lefort C, Bissery A, et al. Pulmonary nodules: preliminary experience with three-dimensional evaluation. Radiology 2004;231(2):459–466 [DOI] [PubMed] [Google Scholar]
- 9.Kostis WJ, Reeves AP, Yankelevitz DF, Henschke CI. Three-dimensional segmentation and growth-rate estimation of small pulmonary nodules in helical CT images. IEEE Trans Med Imaging 2003;22(10):1259–1274 [DOI] [PubMed] [Google Scholar]
- 10.Kostis WJ, Yankelevitz DF, Reeves AP, Fluture SC, Henschke CI. Small pulmonary nodules: reproducibility of three-dimensional volumetric measurement and estimation of time to follow-up CT. Radiology 2004;231(2):446–452 [DOI] [PubMed] [Google Scholar]
- 11.Wormanns D, Kohl G, Klotz E, et al. Volumetric measurements of pulmonary nodules at multi-row detector CT: in vivo reproducibility. Eur Radiol 2004;14(1):86–92 [DOI] [PubMed] [Google Scholar]
- 12.Goo JM, Tongdee T, Tongdee R, Yeo K, Hildebolt CF, Bae KT. Volumetric measurement of synthetic lung nodules with multi-detector row CT: effect of various image reconstruction parameters and segmentation thresholds on measurement accuracy. Radiology 2005;235(3):850–856 [DOI] [PubMed] [Google Scholar]
- 13.Revel MP, Merlin A, Peyrard S, et al. Software volumetric evaluation of doubling times for differentiating benign versus malignant pulmonary nodules. AJR Am J Roentgenol 2006;187(1):135–142 [DOI] [PubMed] [Google Scholar]
- 14.Gietema HA, Wang Y, Xu D, et al. Pulmonary nodules detected at lung cancer screening: interobserver variability of semiautomated volume measurements. Radiology 2006;241(1):251–257 [DOI] [PubMed] [Google Scholar]
- 15.Das M, Ley-Zaporozhan J, Gietema HA, et al. Accuracy of automated volumetry of pulmonary nodules across different multislice CT scanners. Eur Radiol 2007;17(8):1979–1984 [DOI] [PubMed] [Google Scholar]
- 16.Bolte H, Riedel C, Müller-Hülsbeck S, et al. Precision of computer-aided volumetry of artificial small solid pulmonary nodules in ex vivo porcine lungs. Br J Radiol 2007;80(954):414–421 [DOI] [PubMed] [Google Scholar]
- 17.Gietema HA, Schaefer-Prokop CM, Mali WP, Groenewegen G, Prokop M. Pulmonary nodules: interscan variability of semiautomated volume measurements with multisection CT— influence of inspiration level, nodule size, and segmentation performance. Radiology 2007;245(3):888–894 [DOI] [PubMed] [Google Scholar]
- 18.Nietert PJ, Ravenel JG, Leue WM, et al. Imprecision in automated volume measurements of pulmonary nodules and its effect on the level of uncertainty in volume doubling time estimation. Chest 2009;135(6):1580–1587 [DOI] [PMC free article] [PubMed] [Google Scholar]
- 19.Ravenel JG, Leue WM, Nietert PJ, Miller JV, Taylor KK, Silvestri GA. Pulmonary nodule volume: effects of reconstruction parameters on automated measurements—a phantom study. Radiology 2008;247(2):400–408 [DOI] [PMC free article] [PubMed] [Google Scholar]
- 20.Larici AR, Storto ML, Torge M, et al. Automated volumetry of pulmonary nodules on multidetector CT: influence of slice thickness, reconstruction algorithm and tube current—preliminary results. Radiol Med (Torino) 2008;113(1):29–42 [DOI] [PubMed] [Google Scholar]
- 21.Petrou M, Quint LE, Nan B, Baker LH. Pulmonary nodule volumetric measurement variability as a function of CT slice thickness and nodule morphology. AJR Am J Roentgenol 2007;188(2):306–312 [DOI] [PubMed] [Google Scholar]
- 22.Hein PA, Romano VC, Rogalla P, et al. Variability of semiautomated lung nodule volumetry on ultralow-dose CT: comparison with nodule volumetry on standard-dose CT. J Digit Imaging 2010;23(1):8–17 [DOI] [PMC free article] [PubMed] [Google Scholar]
- 23.Honda O, Sumikawa H, Johkoh T, et al. Computer-assisted lung nodule volumetry from multi-detector row CT: influence of image reconstruction parameters. Eur J Radiol 2007;62(1):106–113 [DOI] [PubMed] [Google Scholar]
- 24.Das M, Mühlenbruch G, Katoh M, et al. Automated volumetry of solid pulmonary nodules in a phantom: accuracy across different CT scanner technologies. Invest Radiol 2007;42(5):297–302 [DOI] [PubMed] [Google Scholar]
- 25.de Hoop B, Gietema H, van Ginneken B, Zanen P, Groenewegen G, Prokop M. A comparison of six software packages for evaluation of solid lung nodules using semi-automated volumetry: what is the minimum increase in size to detect growth in repeated CT examinations. Eur Radiol 2009;19(4):800–808 [DOI] [PubMed] [Google Scholar]
- 26.Marchianò A, Calabrò E, Civelli E, et al. Pulmonary nodules: volume repeatability at multidetector CT lung cancer screening. Radiology 2009;251(3):919–925 [DOI] [PubMed] [Google Scholar]
- 27.Jennings SG, Winer-Muram HT, Tarver RD, Farber MO. Lung tumor growth: assessment with CT–comparison of diameter and cross-sectional area with volume measurements. Radiology 2004;231(3):866–871 [DOI] [PubMed] [Google Scholar]
- 28.Tran LN, Brown MS, Goldin JG, et al. Comparison of treatment response classifications between unidimensional, bidimensional, and volumetric measurements of metastatic lung lesions on chest computed tomography. Acad Radiol 2004;11(12):1355–1360 [DOI] [PubMed] [Google Scholar]
- 29.Marten K, Auer F, Schmidt S, Rummeny EJ, Engelke C. Automated CT volumetry of pulmonary metastases: the effect of a reduced growth threshold and target lesion number on the reliability of therapy response assessment using RECIST criteria. Eur Radiol 2007;17(10):2561–2571 [DOI] [PubMed] [Google Scholar]
- 30.Revel MP, Bissery A, Bienvenu M, Aycard L, Lefort C, Frija G. Are two-dimensional CT measurements of small noncalcified pulmonary nodules reliable? Radiology 2004;231(2):453–458 [DOI] [PubMed] [Google Scholar]
- 31.Reeves AP, Biancardi AM, Apanasovich TV, et al. The Lung Image Database Consortium (LIDC): a comparison of different size metrics for pulmonary nodule measurements. Acad Radiol 2007;14(12):1475–1485 [DOI] [PMC free article] [PubMed] [Google Scholar]
- 32.Goodman LR, Gulsun M, Washington L, Nagy PG, Piacsek KL. Inherent variability of CT lung nodule measurements in vivo using semiautomated volumetric measurements. AJR Am J Roentgenol 2006;186(4):989–994 [DOI] [PubMed] [Google Scholar]
- 33.de Hoop B, Gietema H, van de Vorst S, Murphy K, van Klaveren RJ, Prokop M. Pulmonary ground-glass nodules: increase in mass as an early indicator of growth. Radiology 2010;255(1):199–206 [DOI] [PubMed] [Google Scholar]
- 34.Mikheev A, Nevsky G, Govindan S, Grossman R, Rusinek H. Fully automatic segmentation of the brain from T1-weighted MRI using Bridge Burner algorithm. J Magn Reson Imaging 2008;27(6):1235–1241 [DOI] [PMC free article] [PubMed] [Google Scholar]
- 35.Ko JP, Marcus R, Bomsztyk E, et al. Effect of blood vessels on measurement of nodule volume in a chest phantom. Radiology 2006;239(1):79–85 [DOI] [PMC free article] [PubMed] [Google Scholar]
- 36.Levene H. Contributions to probability and statistics: essays in honor of Harold Hotelling. 1960; Stanford, Calif: Stanford University Press [Google Scholar]
- 37.Schwartz M. A biomathematical approach to clinical tumor growth. Cancer 1961;14:1272–1294 [DOI] [PubMed] [Google Scholar]
- 38.Reeves AP, Chan AB, Yankelevitz DF, Henschke CI, Kressler B, Kostis WJ. On measuring the change in size of pulmonary nodules. IEEE Trans Med Imaging 2006;25(4):435–450 [DOI] [PubMed] [Google Scholar]
- 39.Lindell RM, Hartman TE, Swensen SJ, Jett JR, Midthun DE, Mandrekar JN. 5-year lung cancer screening experience: growth curves of 18 lung cancers compared to histologic type, CT attenuation, stage, survival, and size. Chest 2009;136(6):1586–1595 [DOI] [PMC free article] [PubMed] [Google Scholar]
- 40.Kim HY, Shim YM, Lee KS, Han J, Yi CA, Kim YK. Persistent pulmonary nodular ground-glass opacity at thin-section CT: histopathologic comparisons. Radiology 2007;245(1):267–275 [DOI] [PubMed] [Google Scholar]
- 41.Kim TJ, Goo JM, Lee KW, Park CM, Lee HJ. Clinical, pathological and thin-section CT features of persistent multiple ground-glass opacity nodules: comparison with solitary ground-glass opacity nodule. Lung Cancer 2009;64(2):171–178 [DOI] [PubMed] [Google Scholar]
- 42.Hasegawa M, Sone S, Takashima S, et al. Growth rate of small lung cancers detected on mass CT screening. Br J Radiol 2000;73(876):1252–1259 [DOI] [PubMed] [Google Scholar]
- 43.Tateishi U, Tsukagoshi S, Inokawa H, Okumura M, Moriyama N. Fluctuation in measurements of pulmonary nodule under tidal volume ventilation on four-dimensional computed tomography: preliminary results. Eur Radiol 2008;18(10):2132–2139 [DOI] [PubMed] [Google Scholar]
- 44.Goo JM, Kim KG, Gierada DS, Castro M, Bae KT. Volumetric measurements of lung nodules with multi-detector row CT: effect of changes in lung volume. Korean J Radiol 2006;7(4):243–248 [DOI] [PMC free article] [PubMed] [Google Scholar]
- 45.Petkovska I, Brown MS, Goldin JG, et al. The effect of lung volume on nodule size on CT. Acad Radiol 2007;14(4):476–485 [DOI] [PMC free article] [PubMed] [Google Scholar]
- 46.Naidich DP. Part-solid nodules: two steps forward.... Radiology 2010;255(1):16–18 [DOI] [PubMed] [Google Scholar]
- 47.Honda O, Johkoh T, Sumikawa H, et al. Pulmonary nodules: 3D volumetric measurement with multidetector CT—effect of intravenous contrast medium. Radiology 2007;245(3):881–887 [DOI] [PubMed] [Google Scholar]
- 48.Rampinelli C, De Fiori E, Raimondi S, Veronesi G, Bellomi M. In vivo repeatability of automated volume calculations of small pulmonary nodules with CT. AJR Am J Roentgenol 2009;192(6):1657–1661 [DOI] [PubMed] [Google Scholar]
- 49.Wang Y, de Bock GH, van Klaveren RJ, et al. Volumetric measurement of pulmonary nodules at low-dose chest CT: effect of reconstruction setting on measurement variability. Eur Radiol 2010;20(5):1180–1187 [DOI] [PMC free article] [PubMed] [Google Scholar]
Associated Data
This section collects any data citations, data availability statements, or supplementary materials included in this article.