

Abstract
Fungi display a large diversity in genome size and complexity, variation that is often considered to be adaptive. But because nonadaptive processes can also have important consequences on the features of genomes, we investigated the relationship of genetic drift and genome size in the phylum Ascomycota using multiple indicators of genetic drift. We detected a complex relationship between genetic drift and genome size in fungi: genetic drift is associated with genome expansion on broad evolutionary timescales, as hypothesized for other eukaryotes; but within subphyla over smaller timescales, the opposite trend is observed. Moreover, fungi and bacteria display similar patterns of genome degradation that are associated with initial effects of genetic drift. We conclude that changes in genome size within Ascomycota have occurred using two different routes: large-scale genome expansions are catalyzed by increasing drift as predicted by the mutation-hazard model of genome evolution and small-scale modifications in genome size are independent of drift.
Keywords: genetic drift, genome expansion, Ascomycota, mutation hazard
Introduction
Eukaryotes display enormous variation in genome size, ranging from 2.3 Mb in a microsporidian to more than 105 Mb in some flowering plants (Gregory et al. 2007; Peyretaillade et al. 2011). In contrast, the genomes of bacteria are small and span over a much narrower range, from only 0.16 to 13 Mb for sequenced genomes (Nakabachi et al. 2006; Schneiker et al. 2007). Although the differences between eukaryotes and bacteria in the size and complexity of their genomes have been known for decades, only recently have the evolutionary and population-level processes underlying this diversity been recognized (Lynch and Conery 2003; Kuo et al. 2009).
The variation in the size and contents of genomes has been considered to emerge as a consequence of the differential degree of genetic drift, and therefore the efficacy of selection, acting on the genomes. Under this model, species with small effective population sizes have larger genomes because they can tolerate the slightly deleterious accumulation of extra DNA in the form of transposable elements, multiple introns, and gene duplications (Lynch 2002, 2006; Lynch and Conery 2003). The negative association between genome size and population size seems to hold across a wide range of eukaryotes (Lynch and Conery 2003); but there are some exceptions. For example, some species of Microsporidia display extreme genome reduction and a lack of mobile elements despite displaying evidence in their genomes of increased drift bought about by their obligate parasitic lifestyle (Katinka et al. 2001; Gill et al. 2008).
Genetic drift also has consequences on genome size in bacteria; however, its effect is opposite to that hypothesized to occur in eukaryotes. Bacteria with lifestyles that reduce long-term effective population size (such as obligate endosymbiosis or vector-dependent transmission) and impose higher levels of drift have the most highly reduced genomes (Moran and Plague 2004; Ochman and Davalos 2006; Moran et al. 2008, 2009). This difference arises due to the inherent bias in bacterial genomes toward deletions, such that sequences that are not under functional constraints are removed (Mira et al. 2001). Because the host provides a nutrient-rich environment, which renders many genes superfluous, and at the same time exerts limitations on population sizes, which decreases the efficacy of selection, bacterial lineages that have only recently become host restricted sometimes harbor large numbers of inactivated genes and mobile elements (Moran and Plague 2004; Plague et al. 2008). These nonfunctional sequences are eventually eliminated by deletions yielding the reduced genomes observed in long-term obligate pathogens and symbionts.
Despite the generality of these drift-based “mutation-hazard” (MH) models of eukaryotic and bacterial genome evolution, changes in genome size are often viewed as adaptive. Recent sequencing efforts have uncovered large variation in the sizes of fungal genomes (Cuomo and Birren 2010; Martin et al. 2010; Spanu et al. 2010; Goodwin et al. 2011). Because fungi represent some of the most compact eukaryotic genomes, it has been hypothesized that some of the recent genome expansions observed in fungi result as an adaptation to their parasitic lifestyle (Martin et al. 2010). For example, the sequenced species within the phylum Ascomycota, which originated ≈460 Ma, have genomes ranging from 10 to 160 Mb (Lücking et al. 2009; Spanu et al. 2010). The smallest of these genomes, corresponding to both free-living and pathogenic species in the family Saccharomycetaceae, have lost most of their introns and mobile elements and have become similar in size and organization to bacterial genomes (Dujon 1996). By contrast, the largest Ascomycota genomes are obligately parasitic and have greatly expanded genomes containing large numbers of transposable elements (Martin et al. 2010; Spanu et al. 2010).
Given that the broad variation in fungal genome sizes and structure is accompanied by changes in lifestyles that can impose different constraints on population sizes, we asked whether the genome evolution in Ascomycota could be explained within a framework of nonadaptive evolution. Genetic drift, depending on its intensity and timescale, will have a variety of consequences on eukaryotic genomes, including reduced selection on protein-coding regions (Daubin and Moran 2004; Kuo et al. 2009), decreases in gene density, and proliferation of introns (Lynch 2002). By investigating the relationship between genome size and these indicators of genetic drift within the densely sampled Ascomycotae, we identified the processes mediating genome expansion in fungi. In addition, examination of enlarged genomes provided insights into the evolution and assimilation of new genes.
Materials and Methods
Selecting Genes and Genomes
From the phylogeny of Ascomycota fungi whose genome sequences are available, we initially selected 16 pairs of closely related taxa in which length of the smaller genome was at least 90% that of the larger genome (fig. 1). The complete sets of annotated genes, transcripts, and proteins for each of these 32 genomes were retrieved from the Fungal Genome Initiative (FGI) at the Broad Institute (broad.mit.edu/annotation/fgi), the US Department of Energy Joint Genome Institute (JGI) (http://genome.jgi-psf.org/programs/fungi/index.jsf), and Génolevures Consortium (Sherman et al. 2009).
FIG. 1.—

Phylogenetic relationships and genome sizes of Ascomycota fungi. The 16 pairs of sister taxa joined by weighted black or red lines are those genome pairs for which Ka/Ks and Ka/K18s ratios were examined, with those in red indicating genome pairs selected for the regression analyses after quality filtering. All taxa except Golovinomyces orontii and Erysiphe pisi were included in tests of intron features. Scale on right displays genome sizes in megabases (Mb). A, B, and C denote ancestral branches on which genome expansions are inferred (see Discussion). Relationships among taxa are based on previously published phylogenies (Hirose et al. 2005; Hao et al. 2009).
To obtain the set of genes orthologous for a given genome pair, we parsed all annotated proteins with lengths >100 amino acids from each genome and implemented OrthoMCL (Li et al. 2003) to identify and group orthologous and nonorthologous proteins, as well as the recent paralogs (“in-paralogs”), present in the pair. For each OrthoMCL group containing more than one member from each genome, we retained as orthologs only the reciprocal-best-hit pair of proteins. Next, we curated the sets of gene pairs by removing orthologous pairs in which 1) the shorter gene was <80% of the size of the larger gene, 2) the high-scoring pair (HSP) obtained from BlastP alignments (Altschul et al. 1990) accounted for <80% of the shorter gene, or 3) the amino acid sequence similarity within the HSP was <90%. The coding regions of orthologs within each genome pair were aligned based on their amino acid sequences using TranslatorX (Abascal et al. 2010), and then the pairwise divergence at synonymous (Ks) and nonsynonymous (Ka) sites were calculated using PAML4 (Yang 2007). Gene pairs that lacked sufficient divergence (Ks < 0.3) and those in saturation (Ks > 1.5) were removed prior to subsequent analyses.
Recovering Orthologous Genes from Unannotated Genomes
Because the genome annotations for Erysiphe pisi and Golovinomyces orontii are not currently available, we identified the orthologs in this genome pair by computational gene-finding methods. We obtained the E. pisi genome assembly from National Center for Biotechnology Information (GenBank project ID 50315) and then used CEGMA (Parra et al. 2007) to extract intron–exon structures and the protein sequences within eukaryotic orthologous groups (KOG) clusters. In addition to identifying orthologs from the resulting KOG clusters, we searched the E. pisi genome for 22 genes that were conserved in all the annotated genome pairs. This was done by feeding the HMMer-generated (hmmer.wustl.edu) HMM profiles for each of these genes into CEGMA to detect their intron–exon structures and sequences within the E. pisi assembly. Together, the KOGs and the conserved orthologs yielded a total of 311 genes from E. pisi with potential orthologs in G. orontii.
To recover the corresponding orthologs in G. orontii, we queried the G. orontii Blast server hosted at the Max Planck Institute (gbrowse.mpiz-koeln.mpg.de/cgi-bin/gbrowse/Golovinomyces_orontii_V1_public/) with protein sequences of the 311 E. pisi genes applying an e-value threshold of e−15. From G. orontii genome contigs returned from this search, the sequences of 182 G. orontii genes were obtained with CEGMA, 158 of which had a clear ortholog in E. pisi. Of these, only 16 had Ks values within the prescribed cutoffs (0.3 < Ks < 1.5).
Measuring 18S Ribosomal DNA Sequence Divergence
To measure the divergence between members of each genome pair, we calculated the extent of sequence dissimilarity of their 18S ribosomal DNA (rDNA) sequences (K18s). Sequences of a minimal length of 1,700 bp were obtained for each of the annotated genomes from the Silva ribosomal RNA (rRNA) database (Pruesse et al. 2007). Because most species have multiple, albeit quite similar, copies of 18S rDNA sequences, only the BlastN-based reciprocal best hits from each genome pair was chosen. Sequences were aligned and their pairwise divergence calculated using the standalone version of BlastAlign (Belshaw and Katzourakis 2005).
Calculating Ka/Ks and Ka/K18s Ratios
Of the 16 annotated genome pairs, ten possessed >100 orthologous gene pairs with Ks values between 0.3 and 1.5 and K18s values >95% and could thus provide reliable genome-wide measures of sequence divergence. For these ten pairs and for G. orontii–E. pisi genome pair, we calculated Ka/Ks ratios for each pair of orthologs using PAML4 (Yang 2007). To obtain a Ka/K18s ratio for each of these 11 genome pairs, genome-wide average Ka values were calculated.
Characterizing Introns
To analyze the relationship between intron features and genome size, we expanded the set of genomes to include all 54 Ascomycota species whose genomes have been annotated and whose intron–exon structures have been verified by computational and, in some cases, experimental methods. We obtained the intron annotations for the complete set of coding sequences (CDS) within each of the 54 genomes from the FGI and JGI websites. Of the unpublished genomes whose annotations were utilized, Thielavia terrestris, Mycosphaerella fijiensis, Cryphonectria parasitica, Neurospora discreta, and Cochliobolus heterostrophus genomes were sequenced and analyzed by US Department of Energy JGI (http://genome.jgi-psf.org/programs/fungi/index.jsf); Colletotrichum higginsianum, G. orontii, and E. pisi genomes were sequenced and annotated at Max Planck Institute for Plant Breeding Research; and the remaining unpublished genomes were sequenced and annotated at the Broad Institute of MIT and Harvard. Intron annotations for Blumeria graminis genes were determined by aligning (using sim4, Florea et al. 1998) transcript sequences to their corresponding whole-gene sequences, which are available at www.blugen.org.
Identifying Novel Genes
For finer examination of genetic drift in midsized genomes (25–75 Mb), we implemented OrthoMCL on all the 40 genomes falling within this size range. We identified two classes of novel genes: 1) genome-specific genes are those that do not cluster with any gene in any other genome in the phylogeny and 2) lineage-specific genes are those that have OrthoMCL-identified homologs in only the evolutionarily closest group of genomes (for instance, within the Fusarium group) (fig. 1). The lineage-specific genes were utilized as a reliable set of novel genes because their existence was verified from more than one genome.
Regression Analyses
All regressions were conducted using the R statistical package (Team 2010). Two intron features (number of introns per intron-bearing gene and percentage of genes with introns) and two gene features (gene count and gene density) were separately used as dependent variables for regressions on genome size. To eliminate the nonindependence of data points due to common ancestry, we tested the significance of regressions after applying the phylogenetic independent contrasts method of Felsenstein (1985) implemented in the APE package (Paradis et al. 2004). Because the exact published lengths of many branches within the examined fungal phylogeny vary (Fitzpatrick et al. 2006; Robbertse et al. 2006; Schoch et al. 2009), we compared the performance of regressions (using r2 as the criterion) after using Mesquite (Maddison WP and Maddison DR 2010) to 1) set all branch lengths a length of 1.0, 2) apply Pagel’s branch length transformation, and 3) assign Nee’s arbitrary branch lengths. In all cases, regressions obtained by using unit branch lengths achieved the best fit.
Results
By examining multiple signatures of genetic drift, we tested if the genomic expansions observed in lineages of Ascomycota fungi resulted from adaptive or nonadaptive processes. For two of these features, we find that increases in genome size are associated with the increased accumulation of slightly deleterious traits, as expected to arise through genetic drift, and for two other indicators of drift, we observed no difference between small or large genomes. Although the organization of many fungal genomes, with their small size, tight packing of genes, and short noncoding regions, resembles that of bacteria, the broad-scale pattern of genome size evolution generally follows that predicted by the MH hypothesis for eukaryotes, with notable exceptions within some clades.
Genome Size versus Ka/Ks Ratios
Genome-wide comparisons of Ka/Ks ratios across lineages have been used as a proxy for differences in the effects of genetic drift on a genome because high levels of drift will escalate the fixation of slightly deleterious substitutions, thereby increasing the relative numbers of nonsynonymous substitutions (Daubin and Moran 2004; Kuo et al. 2009). For 11 pairs of sequenced Ascomycota genomes, with sizes ranging from 10 to 160 Mb, we calculated ratios of the number of nonsynonymous mutations per site (Ka) to number of synonymous mutations per site (Ks) to determine which lineages might be subjected to elevated levels of genetic drift.
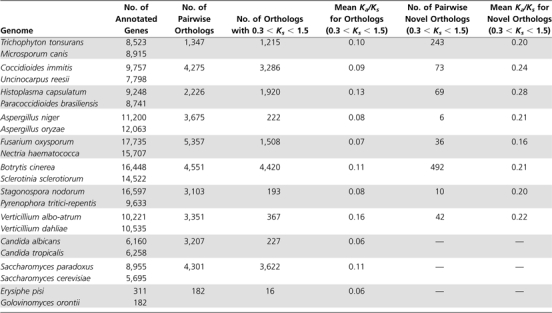
The slight negative relationship between Ka/Ks ratios and genome size is not statistically significant (P = 0.24; fig. 2A). The numbers of orthologous gene pairs meeting our criteria and used in these Ka/Ks comparisons varied widely across lineages, ranging from 16 in E. pisi–G. orontii genome pair to 4,420 for the Botrytis cinerea–Scletorinia sclerotiorum comparison (table 1). Despite this large variation, the stringent selection procedures used to extract orthologs make for reliable comparisons as evident by the facts that 1) the ranges of Ka values are equivalent across lineages and 2) by removing the lineage with the smallest ortholog set the trend did not change.
FIG. 2.—

Relationship between genome size and (A) Ka/Ks ratios and (B) Ka/K18s ratios for 11 Ascomycota genome pairs. Plotted are average ratios calculated for orthologous genes in a given genome pair. Dashed lines separate the points representing Pezizomycotina genomes (right) from those belonging to subphyla Saccharomycotina and Taphrinomycotina.
Table 1.
Number of Orthologous Genes Identified from 11 Species Pairs
 |
Genome Size versus Ka/K18s Ratios
Small subunit (SSU) rRNA is very highly conserved and functionally constrained, which has fostered its use in determining very distant phylogenetic relationships. Although there is some evidence that SSU rDNA accumulates slightly deleterious substitutions in long-term bacterial symbionts as a result of genetic drift (von Dohlen and Moran 1995; Lambert and Moran 1998), it does so at much slower rates than the nonsynonymous sites of proteins, making it suitable for examining the effects of drift over recent timescales. Therefore, lineages subject to the recent effects of genetic drift might have increased ratios of nonsynonymous mutations per site to the divergence of 18S rRNA sequence between pairs of closely related genomes.
There is a positive association between Ka/K18s ratios and genome size, as might be expected if fungal genomes follow the pattern observed in other eukaryotes; however, this correlation is due primarily to the inclusion of the Aspergillus and the S. sclerotiorum–Botrytinia fuckelinia genome pairs (fig. 2B). Thus, there is no strong evidence of an increase in Ka/K18s ratios with genome size in these fungal lineages.
Genome Size versus Gene Count and Gene Density
In eukaryotes, there is only a weak association between genome size and gene number because genome expansion is usually propelled by increases in the number of transposable elements (Lynch and Conery 2003). This contrasts the situation in bacteria, in which genome size is tightly linked to gene number. When considering all annotated Ascomycota genomes whose genes and intron–exon structures have been defined, there is a significant association between gene number and genome size for genomes less than 100 Mb (r2 = 0.32, P < 0.0001) (fig. 3A). Note, however, that the largest fungal genomes that we examined, those of Tuber melanosporum and B. graminis, have gene counts of less than 8,000 genes, similar to that of the smallest Saccharomycotina genomes.
FIG. 3.—

Relationship between genome size and (A) total number of protein-coding genes, and (B) coding density in phylum Ascomycota. Dashed lines separate the points representing Pezizomycotina genomes (right) from those belonging to subphyla Saccharomycotina and Taphrinomycotina. In (A), gene count increases significantly with genome size in genomes up to 80 Mb (P < 0.0001), but the largest genomes are among those with the fewest genes. In (B), coding density decreases with genome size throughout the phylum (P = 2.74 × 10⁻¹⁰). Note that for statistical purposes, gene count is regressed against genome size and coding density is regressed against log genome size.
The strong positive correlation between genome size and gene number in moderately sized (<80 Mb) genomes and the absence of this trend in larger (>100 Mb) ones suggest that increases in gene numbers within the set of moderately sized genomes are a function of adaptive evolution, whereas the large-scale genome expansions (leading to genomes >100 Mb) are driven by drift. However, there is a progressive decrease in gene density with increasing genome size across the entire phylum (r2 = 0.56, P = 2.74 × 10⁻¹⁰), indicating that genome size changes are targeted toward intergenic regions and that large-scale genome expansions/contractions are primarily driven by elevation/decline of genetic drift (fig. 3B).
Genome Size and Intron Frequency
Because the proliferation of introns in eukaryotic genomes has been ascribed to genetic drift (Lynch 2002), we measured intron frequency, that is, mean numbers of introns per intron-bearing gene, in each of the annotated Ascomycota genomes. Intron frequency exhibited a positive association with genome size (r2 = 0.23, P < 0.0005) (fig. 4A), indicative of an increased influence of drift in the expansion of fungal genomes. Notably, two of the larger genomes have high intron frequencies although they differ substantially in gene number: Mycospaerella fijensis has 13,194 genes and T. melanosporum has only 7,496 genes, although both average more than 3.5 introns per gene. In contrast, the genomes of species within the Saccharomycotina subphylum are highly reduced and exhibit massive intron loss.
FIG. 4.—

Relationship between genome size and (A) mean number of introns per intron-bearing genes (“intron frequency”) and (B) percentage of intron-bearing genes. Black-filled circles indicate measurements extracted from complete sets of annotated genes in a genome. Gray-filled circles indicate values from genes orthologous to the Pezizomycotina with midsized (25–75 Mb) genomes. Dashed lines separate the points representing Pezizomycotina genomes (right) from those belonging to subphyla Saccharomycotina and Taphrinomycotina. Over all genomes considered, intron frequency and the percentage of genes with introns are positively associated with genome size in Ascomycota (P = 0.02 and P = 0.05, respectively). But among genes that are orthologous across midsized genomes (gray-filled circles), the percentage of intron-bearing genes decreases with genome size (P = 6.2 × 10⁻⁵).
Trends in Midsized (25–75 Mb) Genomes
Two features examined above (i.e., intron frequency and percentage of intron-bearing genes) point to a broad positive relationship between genome size and genetic drift in phylum Ascomycota. However, species with genomes in the 25- to 75-Mb size range stand out for their following properties, which run counter to the trends observed in the phylum as a whole: In these organisms, 1) there is an increase in genome size associated with an apparent decrease in genetic drift (figs. 2A and 4) and 2) there is a positive association between gene count and genome size (fig. 3).
We further examined the genomic features within this restricted set of organisms, which all belong to subphylum Pezizomycotina, utilizing two gene sets: 1) all annotated protein-coding genes (the “complete gene” set) and 2) only those protein-coding genes that are conserved in all 40 genomes (the “orthologous gene” set). In addition to the two features noted above, this set of genomes displays several additional trends, examined below, that are the opposite of those observed for the phylum as a whole.
(i) Genome size versus intron frequency: For the complete gene set, intron frequencies decrease significantly with genome size (r2 = 0.14, P = 0.02). This association is not apparent in the orthologous gene set (fig. 4A), indicating that broadly conserved genes are, as a group, under stronger selective constraints.
(ii) Genome size versus percentage of intron-bearing genes: As an additional indicator of intron prevalence, we examined the association between the percentage of intron-bearing genes and genome size. In this case, the relationship is not significant in complete gene set (P = 0.5) but is strongly negative in the orthologous gene set (r2 = 0.38, P = 6.2 × 10⁻⁵) (fig. 4B). That broadly conserved genes lose introns as genome sizes increase suggests that the genome expansions are associated with reduced levels of genetic drift.
(iii) Genome size versus protein-coding length: In eukaryotes, genes with shorter protein CDS are under higher selective constraints than longer genes when compared within (Akashi 2003) and among genomes (Jeffares et al. 2006). Regressing genome size against mean protein CDS length for the complete gene set showed that mean CDS length decreases significantly with genome size (r2 = 0.09, P = 0.04) (fig. 5). This was not the case when we consider only the orthologous gene set, again indicating the existence of larger selective constraints on CDS lengths of broadly conserved genes.
FIG. 5.—

Relationship between genome size and gene length in Pezizomycotina genomes. Black-filled circles denote the mean CDS lengths of all annotated protein-coding genes within a genome except for any genome-specific genes and duplicates. Gray-filled circles are average CDS lengths from the set of genes that are conserved in genomes. Gene lengths are negatively associated with genome size (P = 0.04).
Intron Paucity of Novel Genes
Genomes consist of genes that have homologs in related genomes (orthologs and paralogs) and novel genes, which represent genes new to a lineage (and those rare cases in which homologs have been lost from all related genomes). Because the characteristics of novel genes often diverge from those of rest of the genome (Domazet-Loso and Tautz 2003; Long et al. 2003) and could confound analyses, we compared the features of novel (i.e., lineage specific) and conserved genes in the 40 Pezizomycotina genomes (supplementary fig. S1, Supplementary Material online):
(i) Pairwise Ka/Ks: We calculated Ka/Ks values for each of the genome pairs that has at least ten lineage-specific genes with Ks values between 0.3 and 1.5 (table 1). In each case (except for the Verticillium albo-atrum/Verticillium dahiae genome pair), the average Ka/Ks ratios of lineage-specific genes were more than twice that of nonlineage-specific genes.
(ii) Intron frequency: In each of the 29 genomes that possessed at least 30 lineage-specific genes, the average number of introns per novel gene was significantly smaller than that in conserved genes (Student’s t-test; P < 0.03). Because the expanded genomes, such as those of Fusarium oxysporum, Nectria haematococca, and M. fijiensis, have a higher percentage of novel genes, this findings explain why we initially observed a significant reduction in intron frequency with increases in genome size and why this trend was absent in our comparisons of broadly distributed orthologous genes.
(iii) Percentage of intron-bearing genes: The fraction of novel genes that have introns is significantly lower than that of conserved genes in each of the 29 genomes that have at least 30 lineage-specific genes (χ2 test; P < 0.05).
(iv) CDS length: Novel genes have significantly shorter CDS than broadly distributed conserved genes in each of the 29 genomes that have at least 30 lineage-specific genes (Student’s t-test; P < 0.03). Again, this explains our initial observation of a significant reduction in mean CDS length with increasing genome size and the lack of the corresponding decline among widely distributed orthologous genes.
Taken together, these results indicate that lineage-specific genes account for many of the associations observed between genome size and indicators of genetic drift in the midsized genomes. For example, the negative association between the percentages of intron-bearing conserved genes and genome size points to decreases in genetic drift with genome expansion, in contrast to the broad-scale pattern observed in the phylum as a whole.
Discussion
If fungal genomes follow the MH model for eukaryotes, as it was originally developed to account for variation in genome sizes (Lynch and Conery 2003), lineages subjected to increased levels of genetic drift would have larger genomes due to the accumulation of slightly deleterious elements, such as introns and mobile DNAs. This contrasts the situation in bacteria where the higher levels of drift are associated with smaller genomes (Kuo et al. 2009) due to mutational biases that cause the removal both of nonfunctional sequences and of genes that are under reduced selective constraints due to drift. Because many fungal genomes are tightly packed with genes (Dujon 1996; Stajich et al. 2007), these seemed likely to follow the pattern observed in bacteria rather than that of higher eukaryotes.
We find that on a broad scale, genome expansions in Ascomycota fungi are associated with indicators of genetic drift, such as a decrease in gene density and increase in intron frequency. But opposing this overall trend, genomes within the 25- to 75-Mb size range show reductions associated with genetic drift. These patterns are robust when one accounts for the underlying phylogenetic relationships among strains and indicate that drift, rather than selection, has been a dominant force in the evolution of genome size in fungi, although its effects differ across lineages.
Multiple Modes of Genome Expansion in Fungi
The most parsimonious scenario for the evolution of genome expansion within the Ascomycota phylogeny is as follows: 1) a genome expansion event took place in the common ancestor of subphylum Pezizomycotina (point A in fig. 1); 2) independent large-scale expansions occurred in the ancestors of family Erysiphaceae (consisting of E. pisi, G. orontii, and B. graminis) and in the T. melanosporum lineage (points B and C in fig. 1); and 3) additional, smaller scale changes arose within the subphylum Pezizomycotina.
Our analyses, along with those of others (Cornell et al. 2007; Yoshihama et al. 2007; Sanchez-Rodriguez et al. 2010; Yun and Nishida 2011), indicate that the major genome expansion event within the Pezizomycotina ancestor was accompanied by increases in gene numbers, dispersal of mobile elements, and introns. Similarly, the independent, recent, and much larger genome expansions in the Erysiphe ancestor and in the T. melanosporum lineage each involved extensive proliferation of mobile elements, genome restructuring, and gene loss (Martin et al. 2010; Spanu et al. 2010). Moreover, the very low-extant genetic diversity in T. melanosporum and the smaller genome sizes (∼34 Mb) of related members of genus Tuber also suggest that these large-scale genome size changes were facilitated by recent elevation of genetic drift (Bertault et al. 2001; Murat et al. 2004; Gregory et al. 2007; Martin et al. 2010).
In addition to the two major large-scale increases in genome size in Ascomycota fungi, there have been several small-scale changes within the Pezizomycotina genomes in the 25- to 75-Mb genome size range. Scrutiny of individual genera, such as among the Aspergilli, reveals that many recent changes involve genome expansions (Machida et al. 2005; Ma et al. 2010). Within these Pezizomycotina, we detected no elevation of genetic drift in the larger genomes, and in fact, one feature—the percentage of intron-bearing genes—suggests that drift has played a larger role in shaping the smaller Pezizomycotina genomes.
Whereas large genome expansions, such as those at points A, B, and C in figure 1, involve increases in the numbers of transposable elements throughout the genome, the genome increases with the Pezizomycotina have taken place largely through the lineage-specific emergence of large subtelomeric islands or supernumerary chromosomes (Machida et al. 2005; Fedorova 2008; Aboukhaddour et al. 2009; Kasuga et al. 2009; Ma et al. 2010; Goodwin et al. 2011; Klosterman et al. 2011). The elevation of genetic drift in multiple Pezizomycotina lineages has likely assisted the repeated emergence of these zones of genome expansion, which are repeat rich and gene poor; however, pathogenicity genes are often situated on these regions, indicating that they accommodate adaptive changes to the genome (Machida et al. 2005; Nierman et al. 2005; Aboukhaddour et al. 2009; Ma et al. 2010; Goodwin et al. 2011; Klosterman et al. 2011). The genome size variation within Pezizomycotina is also tightly linked with increases in gene number, although in the light of the problems associated with annotating and validating these lineage-specific genes, the identification of these genes and their introns must be viewed as provisional.
The genomes of species within the Saccharomycotina, unlike those within the Pezizomycotina, have experienced large-scale reductions in intron numbers. One lineage within the Saccharomycotina (Saccharomyces) has also experienced duplicate gene loss and genome compaction following whole-genome duplications (Dujon et al. 2004). These reductive trends do not parallel the drift-associated genome degradation observed in endosymbiotic bacteria and nucleomorphs in that these fungi have large effective population sizes (estimated to be ∼107 for Saccharomyces cerevisiae), a lack of a deletional bias and strong purifying selection of intron splice sequences (Skelly et al. 2009; Nishant et al. 2010). Instead, such trends suggest these genomes have contracted due to selection.
Parallel Patterns of Genome Degradation in Eukaryotes and Prokaryotes
The loss of nonessential genes in host-specialized fungi is often considered to be adaptive (e.g., Martin et al. 2010). However, results from several sources suggest that gene losses in the specialized tree symbiont T. melanosperorum and in the obligate plant pathogen B. graminis and the related powdery mildew genomes have taken place concurrently with, and are most likely as a consequence of, recently increased genetic drift (Bertault et al. 2001; Spanu et al. 2010).
Gene loss, resulting from drift-facilitated genome degradation, in the large fungal genomes is comparable to what is observed in the genomes of long-term bacterial endosymbionts (Tamas et al. 2002; Moran et al. 2008). Both groups have genes that are inactivated or rendered redundant through the association with hosts and are subsequently lost. Although this genome degradation has led to genome expansion in fungi and genome contraction in bacteria, the different direction of genome size evolution is due to the mobile element-mediated insertion bias in eukaryotes and the deletion bias in bacteria (Mira et al. 2001; Kuo and Ochman 2009).
The initial increases in genetic drift results in the fixation of slightly deleterious mutations and gene inactivation coupled with genome expansion via the dispersal of mobile elements: features that are evident in bacteria that are at early stages of endosymbiosis (Moran et al. 2008; Plague et al. 2008). Furthermore, sustained high genetic drift as in the case of long-term bacterial endosymbionts, and eukaryotic nucleomorph genomes, compounded with an underlying bias toward deletion (Kuo and Ochman 2009) leads to the elimination of all genomic regions that are not essential to survival.
Testing the MH Hypothesis
Recent discussions have centered on the need to eliminate phylogenetic signal from regression analyses when investigating the effects of genetic drift on genome size (Lynch 2011; Whitney et al. 2011). Given the substantially smaller divergence time and high density of lineages of Ascomycota fungi examined in the present study (in contrast to the phylogenetically divergent array of genomes examined previously, Lynch 2011; Whitney et al. 2011), all our statistical tests were performed on phylogenetically independent comparisons from our data. Such adjustments can greatly affect the results; for example, our regressions of intron features and protein CDS length with genome size do not reach statistical significance once phylogenetic relationships are taken into account. Because we observed divergent trends of genome evolution in different clades, we expect such loss of statistical significance when the phylogenetic concordance among species is removed. Nevertheless, several indicators of drift yielded associations with genome size, lending support to the MH hypothesis in the evolution of fungal genome sizes.
Effects of Drift on Different Genomic Features
Although comparisons of genome-wide Ka/Ks ratios have been applied to determine the degree to which genetic drift has affected different species (e.g., Kuo et al. 2009), this ratio is relatively insensitive to changes in drift within the Ascomycota fungi due to the recent divergence of the lineages. However, intron proliferation was diagnostic of genetic drift within Ascomycota. Moreover, the largest of the observed genome expansions that occurred in the lineage leading to T. melanosporum as well as in the ancestor of B. graminis are associated with a loss of genes, an expected outcome of large-scale genetic drift. In contrast, we detected no participation of genetic drift in the slight genome size changes that are observed in other Pezizomycotina genomes. Our results demonstrate that such threshold effects of genetic drift can be observed even within a dense phylogeny comprising a single phylum.
In conclusion, our investigation of genome size evolution in Ascomycota fungi supports the leading population genetic model for genome evolution for eukaryotes in two ways: First, on a broad evolutionary scale, genome expansions are facilitated by increase in genetic drift. Second, within the broad-scale pattern, the reverse trend emerges in some lineages, with genome expansions associated with selection and/or completely neutral processes.
Supplementary Data
Supplementary figure S1 and table S1 are available at Genome Biology and Evolution online (http://www.gbe.oxfordjournals.org/).
Acknowledgments
We thank Cindy Barlan for assistance with bioinformatic analyses and the Department of Energy’s JGI, The Broad Institute, and the Max Planck Institute for Plant Breeding Research for making available and permitting us to use the prepublished genome data for many of the examined genomes. This research is supported by National Institutes of Health award GM74738 to H.O.
References
- Abascal F, Zardoya R, Telford MJ. TranslatorX: multiple alignment of nucleotide sequences guided by amino acid translations. Nucleic Acids Res. 2010;38:W7–W13. doi: 10.1093/nar/gkq291. [DOI] [PMC free article] [PubMed] [Google Scholar]
- Aboukhaddour R, Cloutier S, Ballance GM, Lamari L. Genome characterization of Pyrenophora tritici-repentis isolates reveals high plasticity and independent chromosomal location of ToxA and ToxB. Mol Plant Pathol. 2009;10:201–212. doi: 10.1111/j.1364-3703.2008.00520.x. [DOI] [PMC free article] [PubMed] [Google Scholar]
- Akashi H. Translational selection, yeast proteome evolution. Genetics. 2003;164:1291–1303. doi: 10.1093/genetics/164.4.1291. [DOI] [PMC free article] [PubMed] [Google Scholar]
- Altschul SF, Gish W, Miller W, Myers EW, Lipman DJ. Basic local alignment search tool. J Mol Biol. 1990;215:403–410. doi: 10.1016/S0022-2836(05)80360-2. [DOI] [PubMed] [Google Scholar]
- Belshaw R, Katzourakis A. BlastAlign: a program that uses blast to align problematic nucleotide sequences. Bioinformatics. 2005;21:122–123. doi: 10.1093/bioinformatics/bth459. [DOI] [PubMed] [Google Scholar]
- Bertault G, et al. Population genetics and dynamics of the black truffle in a man-made truffle field. Heredity. 2001;86:451–458. doi: 10.1046/j.1365-2540.2001.00855.x. [DOI] [PubMed] [Google Scholar]
- Cornell MJ, et al. Comparative genome analysis across a kingdom of eukaryotic organisms: specialization and diversification in the fungi. Genome Res. 2007;17:1809–1822. doi: 10.1101/gr.6531807. [DOI] [PMC free article] [PubMed] [Google Scholar]
- Cuomo CA, Birren BW. The fungal genome initiative and lessons learned from genome sequencing. Methods Enzymol. 2010;470:833–855. doi: 10.1016/S0076-6879(10)70034-3. [DOI] [PubMed] [Google Scholar]
- Daubin V, Moran NA. Comment on “The Origins of Genome Complexity.” Science. 2004;306:978. doi: 10.1126/science.1100559. [DOI] [PubMed] [Google Scholar]
- Domazet-Loso T, Tautz D. An evolutionary analysis of orphan genes in Drosophila. Genome Res. 2003;13:2213–2219. doi: 10.1101/gr.1311003. [DOI] [PMC free article] [PubMed] [Google Scholar]
- Dujon B. The yeast genome project: what did we learn? Trends Genet. 1996;12:263–270. doi: 10.1016/0168-9525(96)10027-5. [DOI] [PubMed] [Google Scholar]
- Dujon B, et al. Genome evolution in yeasts. Nature. 2004;430:35–44. doi: 10.1038/nature02579. [DOI] [PubMed] [Google Scholar]
- Fedorova ND, et al. Genomic Islands in the pathogenic filamentous fungus. Aspergillus fumigatus. PLoS Genet. 4:e1000046. 2008 doi: 10.1371/journal.pgen.1000046. [DOI] [PMC free article] [PubMed] [Google Scholar]
- Felsenstein J. Phylogenies and the comparative method. Am Nat. 1985;125:1–15. [Google Scholar]
- Fitzpatrick DA, Logue ME, Stajich JE, Butler G. A fungal phylogeny based on 42 complete genomes derived from supertree and combined gene analysis. BMC Evol Biol. 2006;6:99. doi: 10.1186/1471-2148-6-99. [DOI] [PMC free article] [PubMed] [Google Scholar]
- Florea L, Hartzell G, Zhang Z, Rubin GM, Miller W. A computer program for aligning a cDNA sequence with a genomic DNA sequence. Genome Res. 1998;8:967–974. doi: 10.1101/gr.8.9.967. [DOI] [PMC free article] [PubMed] [Google Scholar]
- Gill EE, Becnel JJ, Fast NM. ESTs from the microsporidian Edhazardia aedis. BMC Genomics 9:296. 2008 doi: 10.1186/1471-2164-9-296. [DOI] [PMC free article] [PubMed] [Google Scholar]
- Goodwin SB, et al. Finished genome of the fungal wheat pathogen Mycosphaerella graminicola reveals dispensome structure, chromosome plasticity, and stealth pathogenesis. PLoS Genet. 2011;7:e1002070. doi: 10.1371/journal.pgen.1002070. [DOI] [PMC free article] [PubMed] [Google Scholar]
- Gregory TR, et al. Eukaryotic genome size databases. Nucleic Acids Res. 2007;35:D332–D338. doi: 10.1093/nar/gkl828. [DOI] [PMC free article] [PubMed] [Google Scholar]
- Hao BL, Wang H, Xu Z, Gao L. A fungal phylogeny based on 82 complete genomes using the composition vector method. BMC Evol Biol. 2009;9:195. doi: 10.1186/1471-2148-9-195. [DOI] [PMC free article] [PubMed] [Google Scholar]
- Hirose S, et al. Molecular phylogeny and evolution of the maple powdery mildew (Sawadaea, Erysiphaceae) inferred from nuclear rDNA sequences. Mycol Res. 2005;109:912–922. doi: 10.1017/s0953756205003527. [DOI] [PubMed] [Google Scholar]
- Jeffares DC, Mourier T, Penny D. The biology of intron gain and loss. Trends Genet. 2006;22:16–22. doi: 10.1016/j.tig.2005.10.006. [DOI] [PubMed] [Google Scholar]
- Kasuga T, Mannhaupt G, Glass NL. Relationship between phylogenetic distribution and genomic features in Neurospora crassa. PLoS One. 2009;4:e5286. doi: 10.1371/journal.pone.0005286. [DOI] [PMC free article] [PubMed] [Google Scholar]
- Katinka MD, et al. Genome sequence and gene compaction of the eukaryote parasite Encephalitozoon cuniculi. Nature. 2001;414:450–453. doi: 10.1038/35106579. [DOI] [PubMed] [Google Scholar]
- Klosterman SJ, et al. Comparative genomics yields insights into niche adaptation of plant vascular wilt pathogens. PLoS Pathog. 2011;7:e1002137. doi: 10.1371/journal.ppat.1002137. [DOI] [PMC free article] [PubMed] [Google Scholar]
- Kuo CH, Moran NA, Ochman H. The consequences of genetic drift for bacterial genome complexity. Genome Res. 2009;19:1450–1454. doi: 10.1101/gr.091785.109. [DOI] [PMC free article] [PubMed] [Google Scholar]
- Kuo CH, Ochman H. Deletional bias across the three domains of life. Genome Biol Evol. 2009;1:145–152. doi: 10.1093/gbe/evp016. [DOI] [PMC free article] [PubMed] [Google Scholar]
- Lambert JD, Moran NA. Deleterious mutations destabilize ribosomal RNA in endosymbiotic bacteria. Proc Natl Acad Sci U S A. 1998;95:4458–4462. doi: 10.1073/pnas.95.8.4458. [DOI] [PMC free article] [PubMed] [Google Scholar]
- Li L, Stoeckert CJ, Roos DS. OrthoMCL: identification of ortholog groups for eukaryotic genomes. Genome Res. 2003;13:2178–2189. doi: 10.1101/gr.1224503. [DOI] [PMC free article] [PubMed] [Google Scholar]
- Long M, Betran E, Thornton K, Wang W. The origin of new genes: glimpses from the young and old. Nat Rev Genet. 2003;4:865–875. doi: 10.1038/nrg1204. [DOI] [PubMed] [Google Scholar]
- Lücking R, Huhndorf S, Pfister DH, Plata ER, Lumbsch HT. Fungi evolved right on track. Mycologia. 2009;101:810–822. doi: 10.3852/09-016. [DOI] [PubMed] [Google Scholar]
- Lynch M. Intron evolution as a population-genetic process. Proc Natl Acad Sci U S A. 2002;99:6118–6123. doi: 10.1073/pnas.092595699. [DOI] [PMC free article] [PubMed] [Google Scholar]
- Lynch M. The origins of eukaryotic gene structure. Mol Biol Evol. 2006;23:450–468. doi: 10.1093/molbev/msj050. [DOI] [PubMed] [Google Scholar]
- Lynch M. Statistical inference on the mechanisms of genome evolution. PLoS Genet. 2011;7:e1001389. doi: 10.1371/journal.pgen.1001389. [DOI] [PMC free article] [PubMed] [Google Scholar]
- Lynch M, Conery JS. The origins of genome complexity. Science. 2003;302:1401–1404. doi: 10.1126/science.1089370. [DOI] [PubMed] [Google Scholar]
- Ma LJ, et al. Comparative genomics reveals mobile pathogenicity chromosomes in Fusarium. Nature. 2010;464:367–373. doi: 10.1038/nature08850. [DOI] [PMC free article] [PubMed] [Google Scholar]
- Machida M, et al. Genome sequencing and analysis of Aspergillus oryzae. Nature. 2005;438:1151–1161. doi: 10.1038/nature04300. [DOI] [PubMed] [Google Scholar]
- Maddison WP, Maddison DR. Mesquite: a modular system for evolutionary analysis. 2010. [Internet]. Version 2.73. [cited 2011 May 16]. Available from: http://mesquiteproject.org/mesquite/mesquite.html. [Google Scholar]
- Martin F, et al. Périgord black truffle genome uncovers evolutionary origins and mechanisms of symbiosis. Nature. 2010;464:1033–1038. doi: 10.1038/nature08867. [DOI] [PubMed] [Google Scholar]
- Mira A, Ochman H, Moran NA. Deletional bias and the evolution of bacterial genomes. Trends Genet. 2001;17:589–596. doi: 10.1016/s0168-9525(01)02447-7. [DOI] [PubMed] [Google Scholar]
- Moran NA, McCutcheon JP, Nakabachi A. Genomics and evolution of heritable bacterial symbionts. Annu Rev Genet. 2008;42:165–190. doi: 10.1146/annurev.genet.41.110306.130119. [DOI] [PubMed] [Google Scholar]
- Moran NA, McLaughlin HJ, Sorek R. The dynamics and time scale of ongoing genomic erosion in symbiotic bacteria. Science. 2009;323:379–382. doi: 10.1126/science.1167140. [DOI] [PubMed] [Google Scholar]
- Moran NA, Plague GR. Genomic changes following host restriction in bacteria. Curr Opin Genet Dev. 2004;14:627–633. doi: 10.1016/j.gde.2004.09.003. [DOI] [PubMed] [Google Scholar]
- Murat C, et al. Polymorphism at the ribosomal DNA ITS and its relation to postglacial re-colonization routes of the Perigord truffle Tuber melanosporum. New Phytol. 2004;164:401–411. doi: 10.1111/j.1469-8137.2004.01189.x. [DOI] [PubMed] [Google Scholar]
- Nakabachi A, et al. The 160-kilobase genome of the bacterial endosymbiont Carsonella. Science. 2006;314:267. doi: 10.1126/science.1134196. [DOI] [PubMed] [Google Scholar]
- Nierman WC, et al. Genomic sequence of the pathogenic and allergenic filamentous fungus Aspergillus fumigatus. Nature. 2005;438:1151–1156. doi: 10.1038/nature04332. [DOI] [PubMed] [Google Scholar]
- Nishant KT, et al. The baker's yeast diploid genome is remarkably stable in vegetative growth and meiosis. PLoS Genet. 6:e1001109. 2010 doi: 10.1371/journal.pgen.1001109. [DOI] [PMC free article] [PubMed] [Google Scholar]
- Ochman H, Davalos LM. The nature and dynamics of bacterial genomes. Science. 2006;311:1730–1733. doi: 10.1126/science.1119966. [DOI] [PubMed] [Google Scholar]
- Paradis E, Claude J, Strimmer K. APE: analyses of phylogenetics and evolution in R language. Bioinformatics. 2004;20:289–290. doi: 10.1093/bioinformatics/btg412. [DOI] [PubMed] [Google Scholar]
- Parra G, Bradnam K, Korf I. CEGMA: a pipeline to accurately annotate core genes in eukaryotic genomes. Bioinformatics. 2007;23:1061–1067. doi: 10.1093/bioinformatics/btm071. [DOI] [PubMed] [Google Scholar]
- Peyretaillade E, et al. Extreme reduction and compaction of microsporidian genomes. Res Microbiol. 2011;162:598–606. doi: 10.1016/j.resmic.2011.03.004. [DOI] [PubMed] [Google Scholar]
- Plague GR, Dunbar HE, Tran PL, Moran NA. Extensive proliferation of transposable elements in heritable bacterial symbionts. J Bacteriol. 2008;190:777–779. doi: 10.1128/JB.01082-07. [DOI] [PMC free article] [PubMed] [Google Scholar]
- Pruesse E, et al. SILVA: a comprehensive online resource for quality checked and aligned ribosomal RNA sequence data compatible with ARB. Nucleic Acids Res. 2007;35:7188–7196. doi: 10.1093/nar/gkm864. [DOI] [PMC free article] [PubMed] [Google Scholar]
- Robbertse B, Reeves JB, Schoch CL, Spatafora JW. A phylogenomic analysis of the Ascomycota. Fungal Genet Biol. 2006;43:715–725. doi: 10.1016/j.fgb.2006.05.001. [DOI] [PubMed] [Google Scholar]
- Sanchez-Rodriguez A, Martens C, Engelen K, Van de Peer Y, Marchal K. The potential for pathogenicity was present in the ancestor of the Ascomycete subphylum Pezizomycotina. BMC Evol Biol. 2010;10:318. doi: 10.1186/1471-2148-10-318. [DOI] [PMC free article] [PubMed] [Google Scholar]
- Schneiker S, et al. Complete genome sequence of the myxobacterium Sorangium cellulosum. Nat Biotechnol. 2007;25:1281–1289. doi: 10.1038/nbt1354. [DOI] [PubMed] [Google Scholar]
- Schoch CL, et al. The Ascomycota tree of life: a phylum-wide phylogeny clarifies the origin and evolution of fundamental reproductive and ecological traits. Syst Biol. 2009;58:224–239. doi: 10.1093/sysbio/syp020. [DOI] [PubMed] [Google Scholar]
- Sherman DJ, et al. Génolevures: protein families and synteny among complete hemiascomycetous yeast proteomes and genomes. Nucleic Acids Res. 2009;37:D550–D554. doi: 10.1093/nar/gkn859. [DOI] [PMC free article] [PubMed] [Google Scholar]
- Skelly DA, Ronald J, Connelly CF, Akey JM. Population genomics of intron splicing in 38 Saccharomyces cerevisiae genome sequences. Genome Biol Evol. 2009;1:466–478. doi: 10.1093/gbe/evp046. [DOI] [PMC free article] [PubMed] [Google Scholar]
- Spanu PD, et al. Genome expansion and gene loss in powdery mildew fungi reveal tradeoffs in extreme parasitism. Science. 2010;330:1543–1546. doi: 10.1126/science.1194573. [DOI] [PubMed] [Google Scholar]
- Stajich JE, Dietrich FS, Roy SW. Comparative genomic analysis of fungal genomes reveals intron-rich ancestors. Genome Biol. 2007;8:R223. doi: 10.1186/gb-2007-8-10-r223. [DOI] [PMC free article] [PubMed] [Google Scholar]
- Tamas I, et al. 50 Million years of genomic stasis in endosymbiotic bacteria. Science. 2002;296:2376–2379. doi: 10.1126/science.1071278. [DOI] [PubMed] [Google Scholar]
- Team RDC. R: a language and environment for statistical computing. Vienna (Austria): R Foundation for Statistical Computing; 2010. [Google Scholar]
- von Dohlen CD, Moran NA. Molecular phylogeny of the Homoptera: a paraphyletic taxon. J Mol Evol. 1995;41:211–223. doi: 10.1007/BF00170675. [DOI] [PubMed] [Google Scholar]
- Whitney KD, Boussau B, Baack EJ, Garland T., Jr Drift and genome complexity revisited. PLoS Genet. 2011;7:e1002092. doi: 10.1371/journal.pgen.1002092. [DOI] [PMC free article] [PubMed] [Google Scholar]
- Yang ZH. PAML 4: phylogenetic analysis by maximum likelihood. Mol Biol Evol. 2007;24:1586–1591. doi: 10.1093/molbev/msm088. [DOI] [PubMed] [Google Scholar]
- Yoshihama M, Nguyen HD, Kenmochi N. Intron dynamics in ribosomal protein genes. PLoS One. 2007;1:e141. doi: 10.1371/journal.pone.0000141. [DOI] [PMC free article] [PubMed] [Google Scholar]
- Yun C-S, Nishida H. Distribution of introns in fungal histone genes. PLoS One. 2011;6:e16548. doi: 10.1371/journal.pone.0016548. [DOI] [PMC free article] [PubMed] [Google Scholar]